Cryptocurrency Technical Analysis Indicators: The Complete Guide to Every Indicator That Matters
Master every cryptocurrency technical analysis indicator with this complete guide. Covers 27 indicators across trend, momentum, volume, volatility, and crypto-native categories with comparison tables and recommended stacks.
MC
Marcus ChenSenior Quantitative Strategist·Jun 2, 2026 · 20 min read · Updated Oct 6
There are over 100 technical indicators available on most charting platforms. The average crypto trader uses three to five. The profitable ones know which three to five actually matter — and more importantly, why those specific indicators complement each other instead of just repeating the same information in a different wrapper.
This guide is your single reference point for every technical indicator worth using in crypto markets. We cover 27 indicators across five categories, explain exactly what each one does, and — critically — show you how to combine them without falling into the redundancy trap that quietly kills most trading strategies.
Whether you're graduating from our beginner technical analysis guide or looking to sharpen an existing edge, this page links to every in-depth indicator guide we publish and gives you the framework to build an indicator stack that actually works.
Where this fits: This article is part of our complete Crypto Technical Analysis guide for 2026, which covers not just indicators but chart patterns, market structure, and strategy frameworks.
What Are Technical Indicators?
Technical indicators are mathematical calculations applied to price, volume, or open interest data. They transform raw market data into visual signals that help traders identify trends, gauge momentum, measure volatility, and spot potential reversals.
In cryptocurrency markets, indicators serve the same fundamental purpose as in traditional markets — but with a few crucial differences:
24/7 markets mean indicators never "gap" at the open the way stock indicators do. Signals are continuous.
Higher volatility causes many indicators calibrated for equities (like default Bollinger Band settings) to produce more false signals. Crypto traders often need to adjust parameters.
Crypto-native data — funding rates, on-chain flows, open interest — gives you indicator categories that simply don't exist in stocks or forex.
Lower institutional dominance (compared to equities) means certain momentum indicators like RSI tend to produce more reliable overbought/oversold signals on higher timeframes.
Every indicator falls into one of two broad types:
Type
What It Does
Examples
Leading indicators
Attempt to predict future price movement
RSI, Stochastic RSI, Williams %R
Lagging indicators
Confirm trends already in progress
Moving Averages, MACD, Parabolic SAR
Neither type is inherently better. The best indicator setups use both: a lagging indicator to confirm the trend direction and a leading indicator to time entries and exits within that trend.
For a deeper exploration of how these indicators integrate into a broader analytical framework, see our complete technical analysis guide.
The 5 Categories of Crypto Indicators
Every indicator you'll encounter fits into one of five categories. Understanding these categories is more important than memorizing any single indicator, because the category tells you what type of question the indicator answers — and that's the key to combining them effectively.
1. Trend Indicators
Trend indicators answer one question: "What direction is the market moving, and how strong is that direction?" They smooth out price noise and help you identify whether you should be looking for long setups, short setups, or staying on the sidelines.
Exponential Moving Average (EMA) / Simple Moving Average (SMA)
Moving averages are the foundation of trend analysis. The SMA calculates the average closing price over a set period, giving equal weight to every candle. The EMA applies more weight to recent prices, making it faster to react to new price action. For the mathematical breakdown of these indicators, refer to Investopedia's Moving Average Guide.
Most crypto traders favor the EMA over the SMA because crypto markets move fast and the EMA's responsiveness helps avoid late entries. The 20 EMA, 50 EMA, and 200 EMA are the most widely watched levels — institutional algorithms are often programmed around these values, which creates self-fulfilling support and resistance.
Best for: Identifying trend direction, dynamic support/resistance, crossover signals.
The Supertrend combines ATR (Average True Range) with a multiplier to create a single line that flips above or below price, clearly signaling whether you should be long or short. Its simplicity is its strength — there's no ambiguity in the signal.
In crypto, the Supertrend works best on 4-hour and daily charts where it filters out the noise of lower timeframes. It's particularly effective for swing trading strategies where you want to hold positions through the meat of a move.
The Ichimoku Cloud is an all-in-one indicator system that displays support/resistance, trend direction, momentum, and potential future support/resistance levels — all in a single overlay. Its five components (Tenkan-sen, Kijun-sen, Senkou Span A, Senkou Span B, and Chikou Span) work together to create the most comprehensive single-indicator view available.
The cloud (Kumo) is projected 26 periods forward, making Ichimoku one of the few indicators that provides a forward-looking support/resistance framework. When price trades above a green cloud, the trend is bullish. Below a red cloud, bearish. Inside the cloud, the trend is uncertain.
Best for: All-in-one trend assessment, identifying support/resistance zones, gauging momentum within a trend.
The Parabolic SAR plots dots above or below price candles. Dots below price indicate an uptrend; dots above indicate a downtrend. When the dots flip, it signals a potential reversal. The indicator accelerates as the trend progresses, tightening the trailing stop.
In crypto, the Parabolic SAR works best in trending markets and produces excessive whipsaws during consolidation. Pair it with the ADX to filter out low-conviction signals.
Best for: Trailing stop placement, identifying trend reversals, simple trend-following.
The ADX doesn't tell you which direction the market is trending — it tells you how strongly it's trending. Readings above 25 indicate a strong trend (in either direction), while readings below 20 suggest a ranging market.
This distinction makes the ADX a critical meta-indicator: it tells you which other indicators to pay attention to. In strong trends (ADX > 25), use trend-following tools. In ranges (ADX < 20), switch to oscillators and mean-reversion setups.
Best for: Measuring trend strength, filtering signals from other indicators, determining whether to use trend or range strategies.
Momentum oscillators answer: "Is the current move running out of steam, and is this asset overbought or oversold?" They oscillate between fixed boundaries and are most useful for timing entries and exits within an established trend.
Relative Strength Index (RSI)
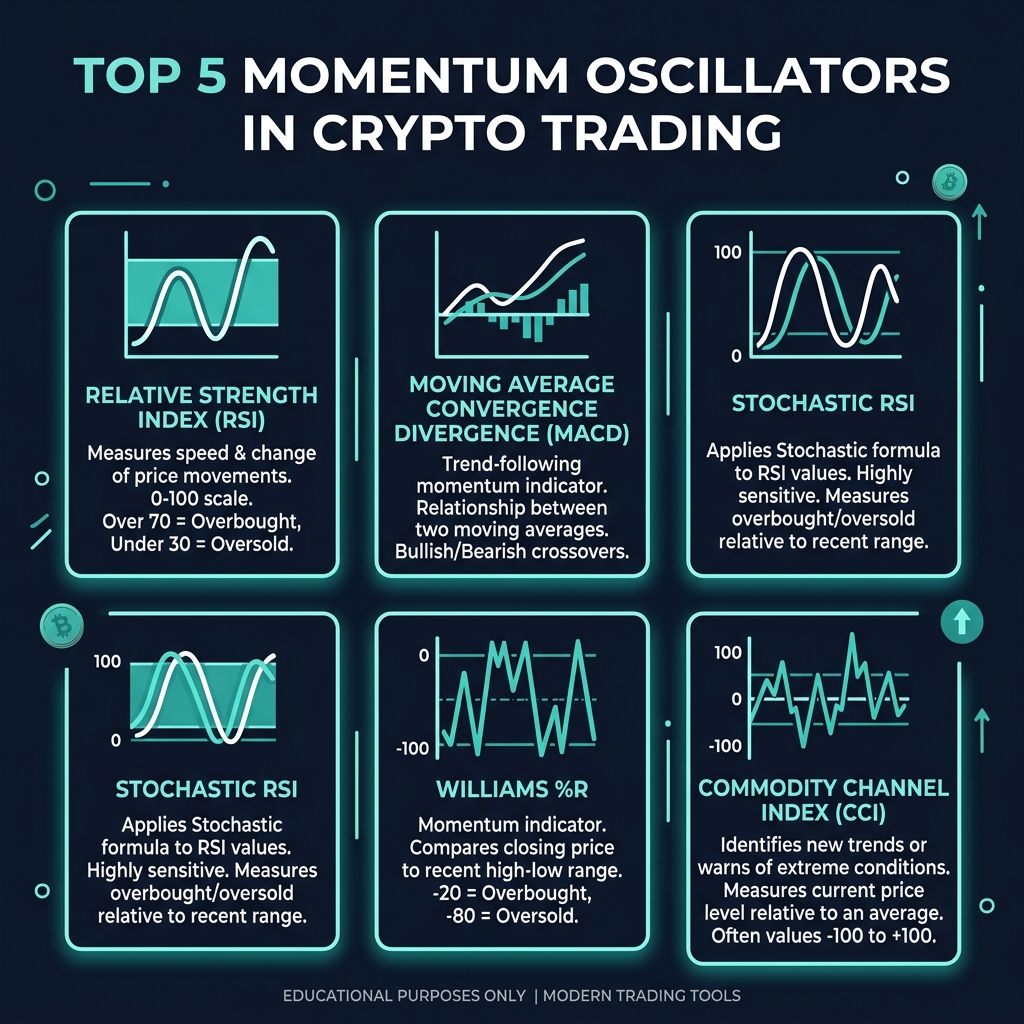
The RSI measures the speed and magnitude of recent price changes on a scale of 0–100. Readings above 70 traditionally indicate overbought conditions; below 30, oversold. But in crypto's trending markets, the 80/40 levels (bull markets) and 60/20 levels (bear markets) often produce more reliable signals.
RSI divergence — where price makes a new high but RSI makes a lower high — is one of the most powerful reversal signals in all of technical analysis.
Best for: Overbought/oversold identification, divergence trading, trend strength confirmation.
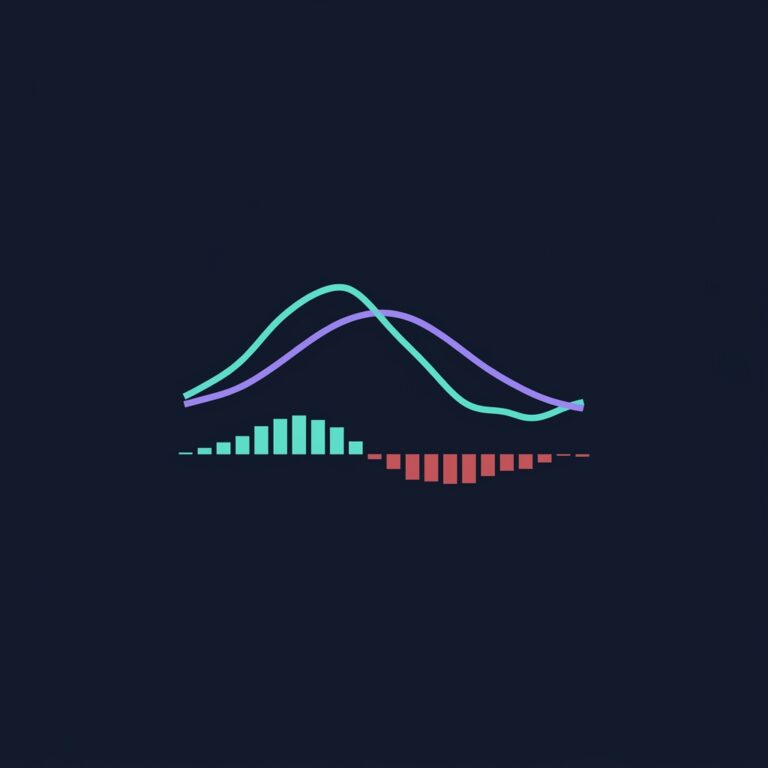
The MACD tracks the relationship between two EMAs (typically 12 and 26 periods) and displays it as a histogram. When the MACD line crosses above the signal line, it's a bullish signal. Below, bearish. The histogram shows the acceleration of momentum — widening bars mean the trend is strengthening; narrowing bars mean it's losing steam.
MACD is technically a lagging indicator since it's based on moving averages, but the histogram component gives it a leading edge. It sits in a unique position between trend confirmation and momentum measurement.
Best for: Momentum shifts, trend confirmation, crossover signals, divergence detection.
The Stochastic RSI applies the Stochastic Oscillator formula to RSI values instead of price. The result is a more sensitive oscillator that moves between 0 and 1 (or 0 and 100 depending on the platform). It reaches overbought and oversold extremes more frequently than standard RSI, making it useful for short-term timing.
Best for: Short-term entry timing, fast overbought/oversold signals, scalping setups.
⚠️ Redundancy warning: Using both RSI and Stochastic RSI simultaneously provides very little additional information. They're measuring the same underlying momentum — one is just a more sensitive version of the other. Pick one based on your trading timeframe. See our section on indicator redundancy below.
Williams %R
Williams %R is a momentum oscillator that moves between 0 and -100, measuring where the current close sits relative to the highest high over a lookback period. Values above -20 indicate overbought conditions; below -80, oversold.
Williams %R tends to turn before RSI does, making it faster but more prone to false signals. It works best as a timing tool once a trend has been confirmed by another indicator.
Best for: Fast overbought/oversold readings, timing entries in confirmed trends, quick reversals.
The CCI measures how far price has deviated from its statistical mean. Unlike RSI, it has no fixed boundaries — readings can go well beyond +100/-100. In crypto, extreme readings (±200 or higher) often coincide with the blow-off tops and capitulation bottoms that define this asset class.
Volume indicators answer: "Is there real conviction behind this price move?" A breakout on high volume is far more likely to sustain than one on thin volume. Volume analysis is arguably more important in crypto than in traditional markets because of the prevalence of fake breakouts and manipulation.
On-Balance Volume (OBV)
OBV keeps a running total of volume, adding volume on up days and subtracting on down days. When price makes a new high but OBV doesn't, it warns that the rally may lack conviction. OBV divergences are among the most reliable early warning signals in crypto markets.
Best for: Confirming breakouts, divergence detection, identifying accumulation/distribution phases.
VWAP shows the average price weighted by volume throughout the trading session. Institutional traders use VWAP as a benchmark — buying below VWAP and selling above it. For crypto's 24/7 markets, the anchored VWAP (starting from a specific event) is often more useful than the session-based version.
Best for: Intraday fair value, institutional-level benchmarking, day trading setups.
Volume Profile displays trading volume at specific price levels rather than over time. It reveals where the most trading activity has occurred, identifying high-volume nodes (areas of acceptance) and low-volume nodes (areas price tends to move through quickly).
The Point of Control (POC) — the price level with the highest traded volume — acts as a magnet for price and is one of the strongest support/resistance concepts available.
The MFI combines price and volume into a single oscillator scaled from 0 to 100, essentially acting as a volume-weighted RSI. It tells you whether money is flowing into or out of an asset. Readings above 80 suggest overbought (too much inflow); below 20, oversold.
Because it incorporates volume, the MFI produces fewer false signals than pure price-based oscillators during volume spikes.
Best for: Volume-weighted overbought/oversold readings, confirming momentum with volume, spotting smart money activity.
Order flow goes beyond aggregate volume to analyze the actual buy and sell orders at each price level. It reveals the real-time battle between buyers and sellers through tools like the order book heatmap, footprint charts, and cumulative volume delta.
This is an advanced technique that provides the most granular view of market microstructure, revealing institutional positioning and potential liquidity grabs before they show up on any other indicator.
Best for: Reading institutional order placement, identifying liquidity zones, advanced scalping and day trading.
Volatility indicators answer: "How much is price likely to move, and are current conditions calm or explosive?" They don't predict direction — they quantify the magnitude of potential moves, which is critical for position sizing and risk management.
Bollinger Bands
Bollinger Bands plot a standard deviation envelope around a 20-period SMA. When bands contract (a "Bollinger Squeeze"), volatility is low and a breakout is imminent. When bands expand, volatility is high. Price touching the upper band doesn't automatically mean "sell" — in strong trends, price can "walk the band" for extended periods.
The ATR measures the average range of price movement over a set period, accounting for gaps. It doesn't indicate direction — only how much an asset is moving. A 14-period ATR of $2,000 on Bitcoin means BTC has averaged $2,000 of range per candle over the last 14 periods.
ATR is indispensable for position sizing. Setting stop losses at 1.5× ATR and take profits at 2–3× ATR creates a built-in edge that adapts to market volatility automatically.
Best for: Position sizing, stop-loss calibration, volatility measurement, comparing volatility across assets.
Keltner Channels look similar to Bollinger Bands but use ATR instead of standard deviation for the envelope width. This makes them smoother and less reactive to individual price spikes. When Bollinger Bands contract inside Keltner Channels, it creates the "TTM Squeeze" — one of the most reliable breakout setups across all markets.
Best for: Trend following, identifying squeeze breakouts (combined with Bollinger Bands), smoother volatility envelopes.
This category is unique to cryptocurrency markets. These indicators leverage data that doesn't exist in traditional finance — blockchain transaction data, derivatives market metrics, and exchange-specific flows. Ignoring this category means ignoring some of the most powerful signals available to crypto traders.
Funding Rate & Open Interest
Funding rates are periodic payments between long and short traders on perpetual futures contracts. When funding is highly positive, longs are paying shorts — the market is over-leveraged to the upside and a correction is more likely. When negative, shorts are paying and the market may be primed for a squeeze.
Open interest measures the total number of outstanding derivative contracts. Rising OI with rising price indicates new money entering the trend (strong). Rising price with falling OI means shorts are covering (weaker move).
Exchange flow analysis tracks the movement of crypto assets into and out of exchanges. Large inflows to exchanges often precede selling pressure (entities deposit to sell). Large outflows suggest accumulation (entities withdraw to hold).
Combined with whale tracking, exchange flows provide an institutional-grade view of supply and demand dynamics that no price-based indicator can match.
Best for: Identifying accumulation/distribution by large holders, predicting supply shocks, macro trend analysis.
Whale tracking monitors the blockchain transactions of large holders (typically those holding 1,000+ BTC or equivalent). When whales move large amounts to exchanges, it historically correlates with sell-offs. When they withdraw from exchanges or move between wallets, it often signals accumulation.
This is the closest you can get to tracking "smart money" in real time — a transparency that simply doesn't exist in traditional markets.
Best for: Tracking large holder behavior, identifying accumulation phases, anticipating major market moves.
Use this table as a quick-reference to find the right indicator for your trading style. Every indicator we cover links to its dedicated deep-dive guide.
Which Indicators to Combine (The Redundancy Problem)
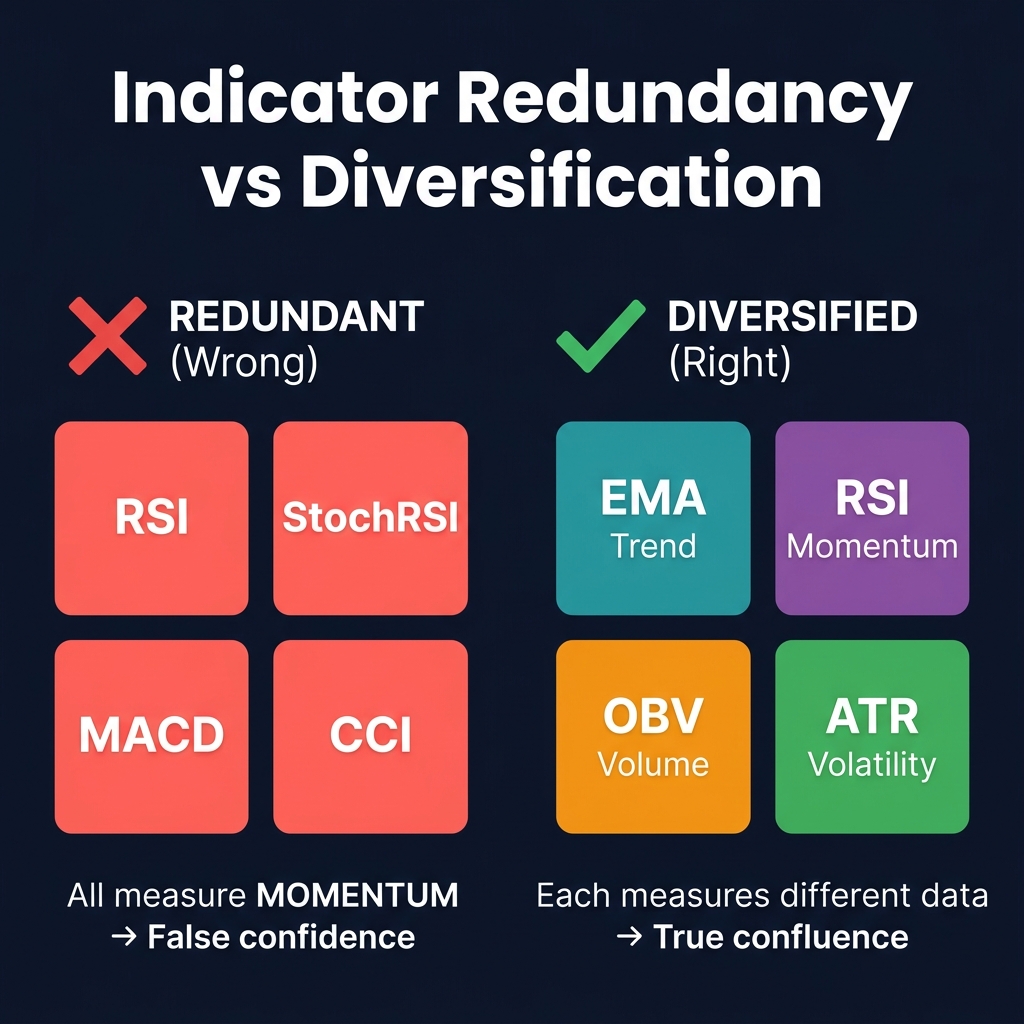
The single most common mistake in indicator-based trading is indicator redundancy — using multiple indicators that all measure the same thing. When three indicators all confirm a signal, it feels like you have three independent confirmations. But if they're all measuring momentum, you really just have one signal displayed three different ways.
How Redundancy Fools You
Consider this common beginner setup:
RSI — momentum oscillator
Stochastic RSI — momentum oscillator (derived from RSI)
MACD — momentum/trend (EMA-based)
CCI — momentum oscillator
Four indicators, and they'll almost always agree because they're all feeding off the same price momentum data. When all four flash "buy," the trader feels confident. But it's false confidence — one genuine signal masquerading as four confirmations.
[!WARNING]
The Collinearity (Redundancy) Trap: Combining multiple indicators of the same mathematical type is a statistically flawed approach. In data science, this is known as collinearity — where inputs are highly correlated, skewing your results and inflating confidence. To build a robust system, you must diversify your indicator types so each input captures a distinct market dimension (price direction, rate of change, volume, and derivatives market positioning).
The Fix: One Indicator Per Category
Effective indicator stacks pull from different categories so each indicator provides genuinely independent information:
Calculates stop-loss distance and position size automatically
How it works: EMAs tell you the direction. RSI tells you when momentum is stretched. ATR tells you where to place your stop. Three indicators, three different data types, zero redundancy.
Squeeze setups for breakout timing; band walks for trend continuation
How it works: EMAs define the trend. MACD identifies momentum shifts within it. OBV confirms volume is supporting the move. Bollinger Bands flag when volatility is about to expand. This is a robust swing trading setup.
Confirms whether large players are accumulating or distributing
How it works: Ichimoku provides the structural framework. RSI divergence flags high-probability reversal zones. Volume Profile identifies where institutional participants are positioned. Funding/OI reveals when the derivatives market is stretched. Exchange flows add on-chain confirmation. This is a complete analysis system.
The 4-Indicator Rule: Less Is More
Academic research and decades of professional trading experience converge on the same conclusion: more indicators do not produce better results. In fact, analysis paralysis from too many indicators actively harms performance.
Here's why four indicators is the practical ceiling:
Diminishing returns. The first indicator you add provides the most information. Each additional one provides progressively less — if it's from the same category, it provides almost zero new information.
Conflicting signals. With five or more indicators, you'll regularly encounter situations where 3 indicators say buy and 2 say sell. What do you do? Most traders freeze, second-guess, or cherry-pick whichever indicators support their bias.
Optimization trap. Every parameter you add (RSI length, EMA period, Bollinger Band width) is another variable you can over-optimize to historical data. More indicators = more parameters = more overfitting = worse live performance.
Decision speed. In crypto markets that move 5% in minutes, you need to make decisions quickly. Four indicators can be processed at a glance. Eight cannot.
The rule of thumb: Use one indicator from each category you care about, up to a maximum of four. If you need a fifth data source, make it on-chain data — it provides genuinely orthogonal information that no chart-based indicator can replicate.
The crypto trading community is split into two camps: indicator traders who rely on mathematical signals, and price action traders who read raw candles, support/resistance, and market structure. The reality is that the best traders use both.
Approach
Strengths
Weaknesses
Indicators only
Objective, quantifiable signals; easier to backtest; removes emotion
Lagging by nature; can't read context; fails in choppy markets
Price action only
Real-time, no lag; reads market structure directly; adapts to any market condition
Subjective interpretation; harder to backtest; requires significant screen time
Combined (recommended)
Objective signals validated by real-time context; strongest edge
Requires more skill; must understand both disciplines
How to combine them in practice
Start with price action. Read the market structure. Is price making higher highs and higher lows (uptrend), lower highs and lower lows (downtrend), or ranging? Use candlestick patterns and support/resistance levels to identify the current context.
Use indicators to confirm. If price action shows a bullish reversal candle at support, check if RSI is oversold and OBV is diverging positively. If all three agree, the signal is high-conviction.
Use indicators for what price action can't do. Price action can't easily measure volatility, calculate position sizes, or track funding rates. This is where indicators fill the gap.
Use multi-timeframe analysis. Align the higher-timeframe trend (using indicators) with lower-timeframe price action entries. This is one of the most reliable frameworks across all trading styles.
Frameworks like Smart Money Concepts and the Wyckoff Method bridge both worlds — they use structural price action principles backed by volume and indicator confirmation.
Common Indicator Mistakes
After reviewing thousands of trading setups, these are the mistakes we see destroying accounts most consistently:
1. Using Default Settings Without Adjustment
Most indicators ship with settings calibrated for the stock market (RSI 14, Bollinger Bands 20/2, MACD 12/26/9). Crypto's higher volatility and 24/7 trading can require different parameters. For instance, some traders find RSI 10 more responsive on 4-hour crypto charts, while Bollinger Bands with a 2.5 standard deviation setting reduce false signals on volatile altcoins.
Always backtest parameter changes on your specific asset and timeframe before trading with real capital.
2. Ignoring the Trend Context
An RSI reading of 30 doesn't mean "buy" if the asset is in a strong downtrend. In bear markets, RSI can stay oversold for weeks while price continues to fall. Always determine the trend first (using trend indicators or price action), then use oscillators within that context.
3. Treating Indicators as Signal Machines
Indicators are decision-support tools, not decision-making tools. An RSI cross above 30 is not a buy signal by itself. It's one piece of evidence that should be evaluated alongside trend direction, volume, support/resistance, and broader market conditions.
4. Neglecting Volume Confirmation
A breakout without volume is a fake breakout until proven otherwise. Always confirm significant price moves with volume indicators like OBV or Volume Profile. This single habit will save you from more losing trades than any parameter optimization.
5. Skipping Risk Management
No indicator setup eliminates losing trades. Even the best systems have a 40-60% win rate. What makes them profitable is proper risk management: consistent position sizing (using ATR), predefined stop losses, and favorable risk-reward ratios.
6. Overfitting to Historical Data
If your backtested strategy uses RSI 13.7 with Bollinger Bands set to 19 periods and 2.3 standard deviations, you haven't found a system — you've found a curve-fit that will fall apart in live trading. Robust strategies use round-number, widely-watched settings and work across multiple assets and timeframes.
7. Ignoring Crypto-Native Data
Trading crypto with only traditional indicators is like analyzing a company's stock without looking at its financials. Funding rates, exchange flows, and whale movements provide uniquely powerful data that exists nowhere else. Ignoring this edge means leaving money on the table.
Frequently Asked Questions
What is the best technical indicator for cryptocurrency trading?
There is no single "best" indicator. The most effective approach uses one indicator from each major category — typically a trend indicator (like EMA), a momentum oscillator (like RSI), and a volume indicator (like OBV). The best indicator for you depends on your trading style, timeframe, and risk tolerance. See our recommended indicator stacks for specific combinations.
How many indicators should I use for crypto trading?
Three to four indicators from different categories is optimal. Research consistently shows that adding more than four indicators increases analysis paralysis without improving accuracy. The key is choosing indicators from different categories (trend, momentum, volume, volatility) to avoid redundancy. Read more in our 4-Indicator Rule section.
Do technical indicators work differently in crypto vs stocks?
Yes, in several meaningful ways. Crypto's 24/7 trading means no opening gaps. Higher baseline volatility means default indicator settings may need adjustment. And crypto has entirely unique indicator categories — funding rates, on-chain exchange flows, and whale tracking — that don't exist in traditional markets.
What are the best indicators for crypto day trading?
For crypto day trading, focus on fast-responding indicators: VWAP for intraday fair value, Stochastic RSI for quick overbought/oversold readings, Volume Profile for key levels, and ATR for dynamic stop-loss placement. Order flow analysis provides an additional edge for advanced day traders.
What is the difference between RSI and MACD?
RSI is a bounded oscillator (0–100) that measures overbought/oversold conditions and is best for spotting extremes and divergences. MACD is an unbounded indicator that measures the convergence and divergence of two moving averages, making it better for identifying momentum shifts and trend changes. RSI is generally better for mean-reversion setups; MACD is better for trend-following. Using both together is acceptable since they measure momentum in fundamentally different ways.
Should beginners use technical indicators or price action?
Beginners should start with a small set of indicators — our beginner stack of EMA + RSI + ATR is a great foundation. Indicators provide clear, objective signals that are easier to follow than subjective price action interpretation. As you gain experience, layer in price action skills like candlestick pattern recognition and support/resistance analysis. The beginner technical analysis guide walks through this progression step by step.
How do I know if my indicators are giving false signals?
False signals are more common in ranging markets and on lower timeframes. To filter them: (1) Check if the ADX confirms a trend exists before acting on trend-following signals. (2) Require volume confirmation from OBV or MFI. (3) Use multi-timeframe analysis — if the higher timeframe doesn't agree, skip the trade. (4) In crypto, check funding rates to see if the derivatives market supports the move. Tools like CoinXSight's Deep Alpha module can help you cross-reference multiple indicator signals across timeframes to filter noise.
Putting It All Together
Indicators are not magic formulas — they're lenses that help you see different dimensions of market behavior. The trend trader and the scalper look at the same Bitcoin chart but need completely different indicator setups to extract useful information.
Here's the framework for building your indicator stack:
Define your trading style. Are you day trading, swing trading, or position trading? This determines your timeframe, which determines which indicators work best.
Pick one indicator per category. Choose from trend, momentum, volume, and volatility. That's your core stack.
Add crypto-native data.Funding rates and exchange flows provide information that no chart indicator can. This is your informational edge over traders using generic tools.
Learn each indicator deeply. Don't add a new indicator until you've spent at least 2–4 weeks studying and paper trading with the ones you have. Our individual indicator guides (linked throughout this article and summarized in the comparison table) will take you from theory to execution.
Manage your risk. Even the best indicator setup loses 40% or more of the time. Consistent profitability comes from risk management, not from finding the perfect indicator.
Bookmark this page as your reference hub. As you progress through each indicator guide, you'll build a layered understanding of market analysis that compounds over time — and that understanding is ultimately worth more than any single indicator signal.
[!WARNING]
Financial Disclaimer: Trading cryptocurrencies involves substantial risk and may not be suitable for every investor. The high volatility of crypto assets can result in significant financial losses. The information provided in this guide is for educational purposes only and does not constitute financial, investment, or trading advice. Always conduct your own research, practice proper risk management, and consult with a licensed financial advisor before making any investment decisions.
About the Author
Sarah Mitchell is a Technical Analysis Specialist at CoinXSight, focusing on combining traditional chart patterns with modern on-chain metrics and machine learning algorithms. With over seven years of active trading experience, she specializes in swing trading strategies and trend-following frameworks. Connect with her on LinkedIn or follow her latest market updates on Twitter/X.