MACD Indicator: How to Read Trend Momentum in Crypto Markets
Learn how the MACD indicator works, how to read crossovers, histogram shifts, and divergences to time crypto entries — with real CoinXSight Deep Alpha examples.
JV
Julian VanceLead Technical Systems Architect·Mar 22, 2026 · 9 min read · Updated Oct 6
MACD (Moving Average Convergence Divergence) is a trend-following momentum indicator created by Gerald Appel in 1979. It measures the relationship between two Exponential Moving Averages (EMAs) to reveal whether bullish or bearish momentum is accelerating or decelerating.
Unlike RSI, which operates on a bounded 0–100 scale, MACD has no upper or lower limit. It tells you two things simultaneously:
Trend direction — which side of zero the MACD sits on
Momentum velocity — whether the trend is speeding up or slowing down
MACD consists of three components built from EMA calculations:
MACD Line = EMA(12) - EMA(26)
Signal Line = EMA(9) of the MACD Line
Histogram = MACD Line - Signal Line
In plain terms:
The MACD Line measures the gap between a fast EMA (12-period) and a slow EMA (26-period). When price rises rapidly, the fast EMA pulls away from the slow EMA, and MACD increases.
The Signal Line smooths the MACD Line over 9 periods. It acts as a trigger — crossovers between these two lines generate buy and sell signals.
The Histogram visualizes the distance between MACD and Signal. Growing bars = momentum accelerating. Shrinking bars = momentum fading.
💡 On CoinXSight, MACD is automatically computed by the platform's analysis engine and the results are available across multiple modules: Deep Alpha displays the numerical reading, status, and direction; Chart Pro overlays the full MACD panel (Line + Signal + Histogram) on the candlestick chart; and Discovery factors MACD into signal triage scoring.
How to Read MACD — The 4 Key Signals
This is where crypto technical analysis becomes practical — a quality crypto analytics platform will display these signals in real time, helping you act on setups as they form.
Signal 1: Bullish Crossover (MACD Line Crosses Above Signal)
When the MACD Line crosses above the Signal Line from below, short-term momentum is accelerating faster than the trend's average pace. This is the most common MACD buy signal.
Strength depends on location:
Crossover below zero → potential trend reversal from bearish to bullish (stronger)
Crossover above zero → trend continuation — bulls are accelerating (moderate)
Signal 2: Bearish Crossover (MACD Line Crosses Below Signal)
The opposite. MACD Line drops below the Signal Line, indicating momentum is decelerating or reversing.
Strength depends on location:
Crossover above zero → potential trend reversal from bullish to bearish (stronger)
Crossover below zero → trend continuation — bears are accelerating (moderate)
Signal 3: Zero Line Cross
When the MACD Line itself crosses the zero line:
Crosses above zero → the 12-period EMA is now above the 26-period EMA → the short-term trend has officially turned bullish
Crosses below zero → the short-term trend has turned bearish
This signal is slower than crossovers but more reliable for confirming trend direction.
Signal 4: Histogram Shifts
The histogram tells you whether momentum is accelerating or fading, even before a crossover occurs:
Histogram Pattern
Meaning
Green bars getting taller
Bullish momentum accelerating
Green bars shrinking
Bullish momentum fading — watch for reversal
Red bars getting taller
Bearish momentum accelerating
Red bars shrinking
Bearish momentum fading — watch for reversal
The histogram often warns you 1-2 candles before a crossover happens. Professional traders watch the histogram rather than waiting for the crossover itself.
MACD Divergence — The Advanced Signal
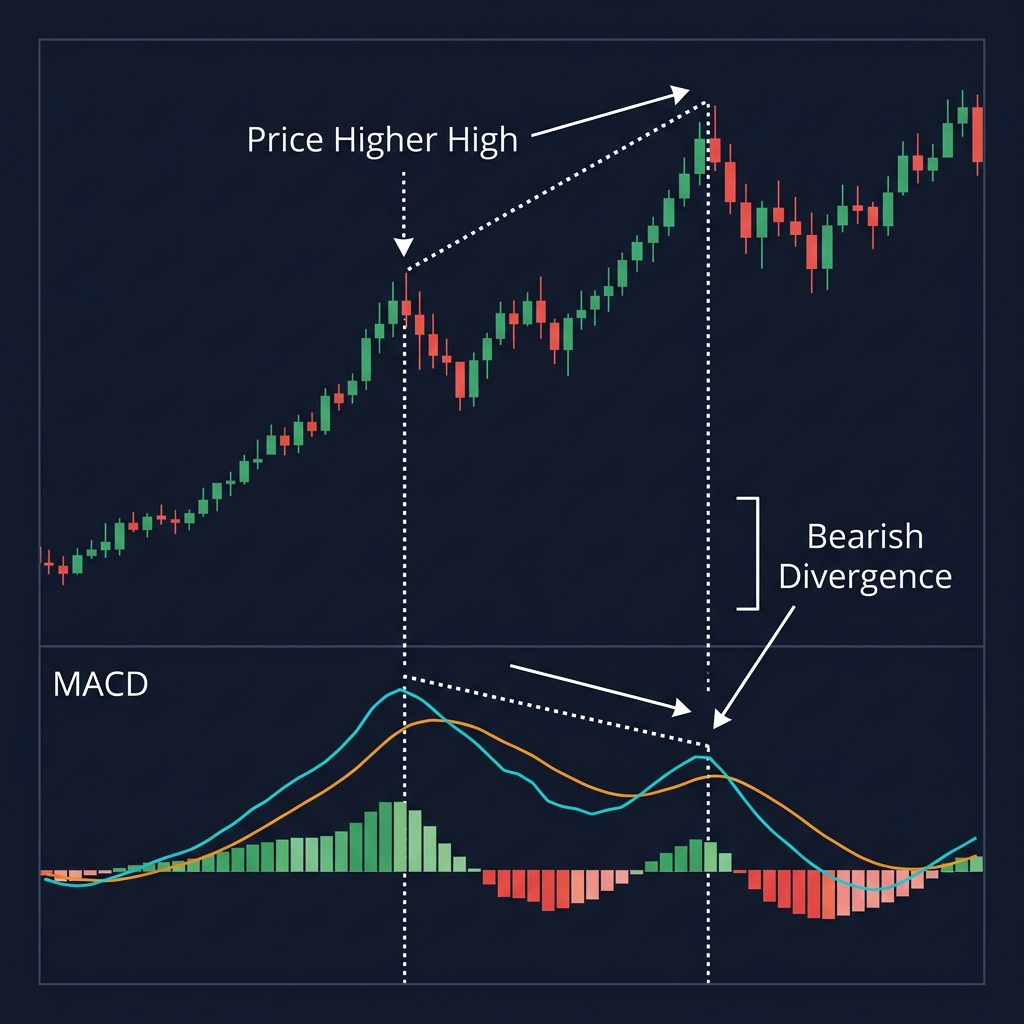
Like RSI, MACD produces divergence signals when price and the indicator move in opposite directions:
Type
Price
MACD
Implication
Bullish Divergence
Lower low
Higher low
Selling pressure is weakening internally
Bearish Divergence
Higher high
Lower high
Buying momentum is fading despite new highs
MACD divergence is slower to develop than RSI divergence but often produces more reliable signals because MACD already incorporates trend information (it is built from EMAs, not raw price comparisons).
Real-World Scenario: SOL on CoinXSight Deep Alpha + Chart Pro
Scenario — SOL, April 2026, 4H timeframe:
On April 22, 2026, SOL had dropped from $185 to $156 over 5 days. Many traders assumed the downtrend would continue. Here is what CoinXSight showed across modules:
Deep Alpha module:
MACD Line: -2.4, approaching Signal Line from below
MACD Status: "Bearish, but narrowing"
RSI: 33 — approaching oversold
EMA ribbon: Price below EMA 34 but sitting on EMA 89 ($154) — medium-term support holding
Chart Pro module:
The MACD histogram was printing shorter and shorter red bars for 6 consecutive candles
A bullish divergence was forming: SOL made a lower low at $156, but the MACD histogram low was shallower than the previous swing
What happened next: SOL's MACD crossed above the Signal Line on the 4H chart at $158, triggering a bullish crossover below zero. Combined with RSI rising off oversold and EMA 89 support, the Confluence Score jumped to 7/10. SOL rallied to $178 within 4 days — a 12.6% move.
Multi-module confirmation workflow:
Deep Alpha → spotted MACD narrowing + RSI approaching oversold
Chart Pro → visually confirmed histogram compression and bullish divergence
Confluence Score → synthesized all signals into 7/10 actionable score
⚠️ Limitation: MACD is a lagging indicator — it is built from moving averages, which inherently look backward. In fast-moving crypto markets, MACD crossovers can occur after 30-50% of a move has already happened. Never use MACD alone for entries. Pair it with a leading indicator like RSI or Smart Money Concepts (Order Blocks, FVG) to catch moves earlier.
MACD vs. RSI — When to Use Which
Aspect
MACD
RSI
Type
Trend + Momentum
Momentum only
Bounded?
No limits
0-100 scale
Best for
Confirming trend direction changes
Identifying overbought/oversold extremes
Speed
Slower — relies on EMA crossovers
Faster — responds to recent price changes
Divergence
More reliable, slower to form
Faster to form, more false positives
Weakness
Late entries in fast moves
Stays overbought/oversold in strong trends
CoinXSight module
Deep Alpha + Chart Pro
Deep Alpha + Chart Pro
Best practice: Use both. RSI identifies momentum state (are we stretched?), and MACD confirms trend direction (is the trend actually turning?). When RSI recovers from oversold AND MACD produces a bullish crossover, the probability of a successful trade increases significantly.
Common MACD Mistakes
Reacting to every crossover: On a 15-minute chart, MACD can produce 5-10 crossovers per day. Most of them lead nowhere. Stick to 4H and daily charts for reliable signals.
Ignoring the histogram: The crossover gets all the attention, but the histogram gives you 1-2 candles of advance warning. Shrinking histogram bars tell you momentum is fading before the crossover confirms it.
Using MACD in ranging markets: MACD thrives in trending markets. In a sideways range, it produces constant whipsaws — the MACD Line oscillates around the Signal Line with no follow-through. Check the EMA ribbon first: if EMAs are tangled and flat, the market is ranging and MACD signals lose reliability.
Setting arbitrary MACD targets: MACD values are relative to the asset's price and volatility. MACD of +5 means something completely different on BTC ($79K) vs. a meme coin at $0.003. Focus on the direction and crossovers, not the absolute number.
How to Use MACD on CoinXSight — Multi-Module Workflow
Most traders stare at the MACD line crossover and nothing else. That is like reading the headline and ignoring the article. The histogram is where the real edge lives — it gives you 1-2 candles of advance warning before the crossover confirms the move.
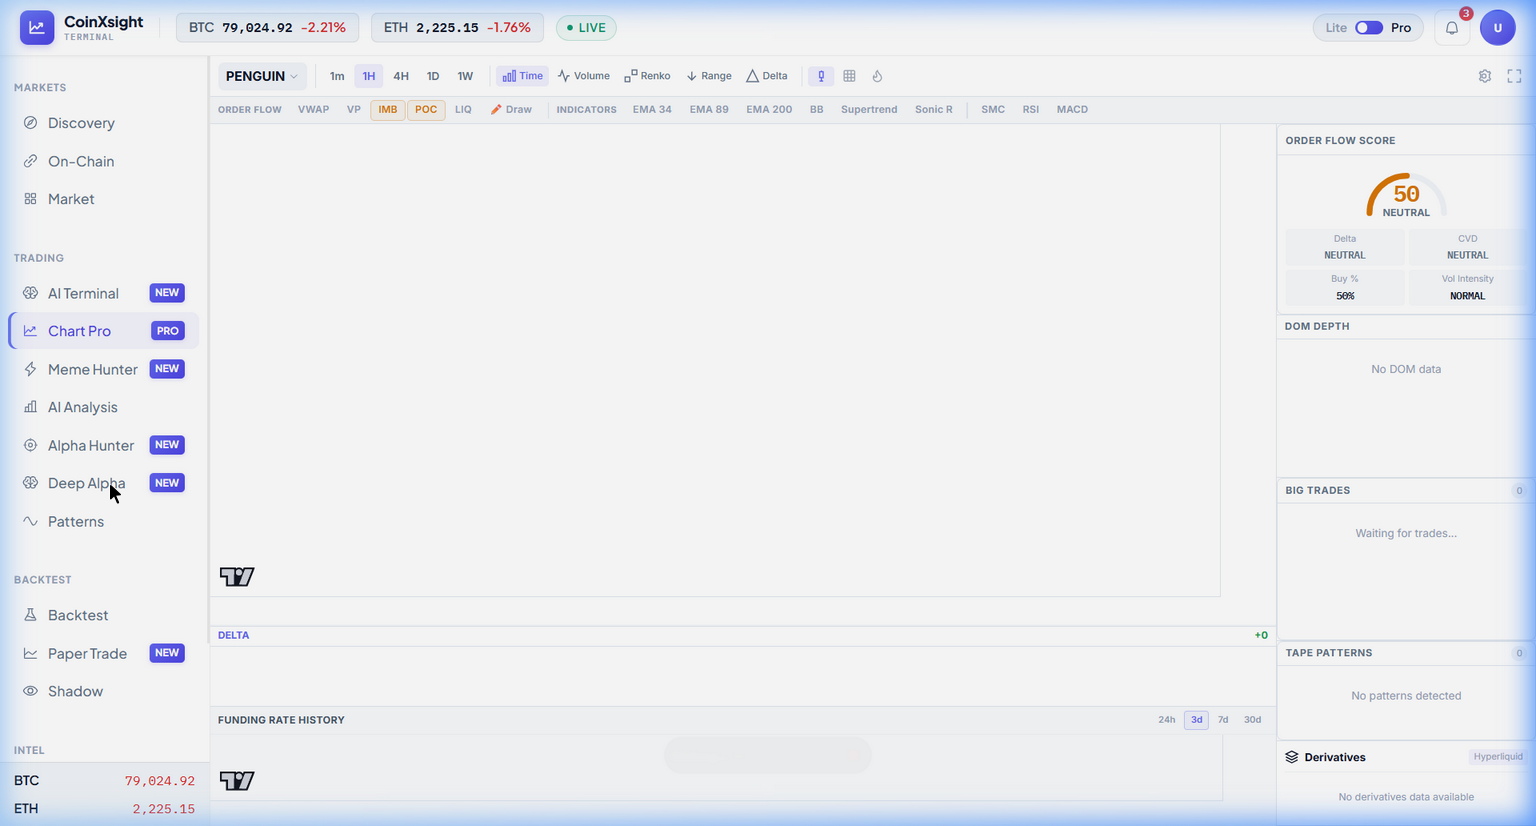
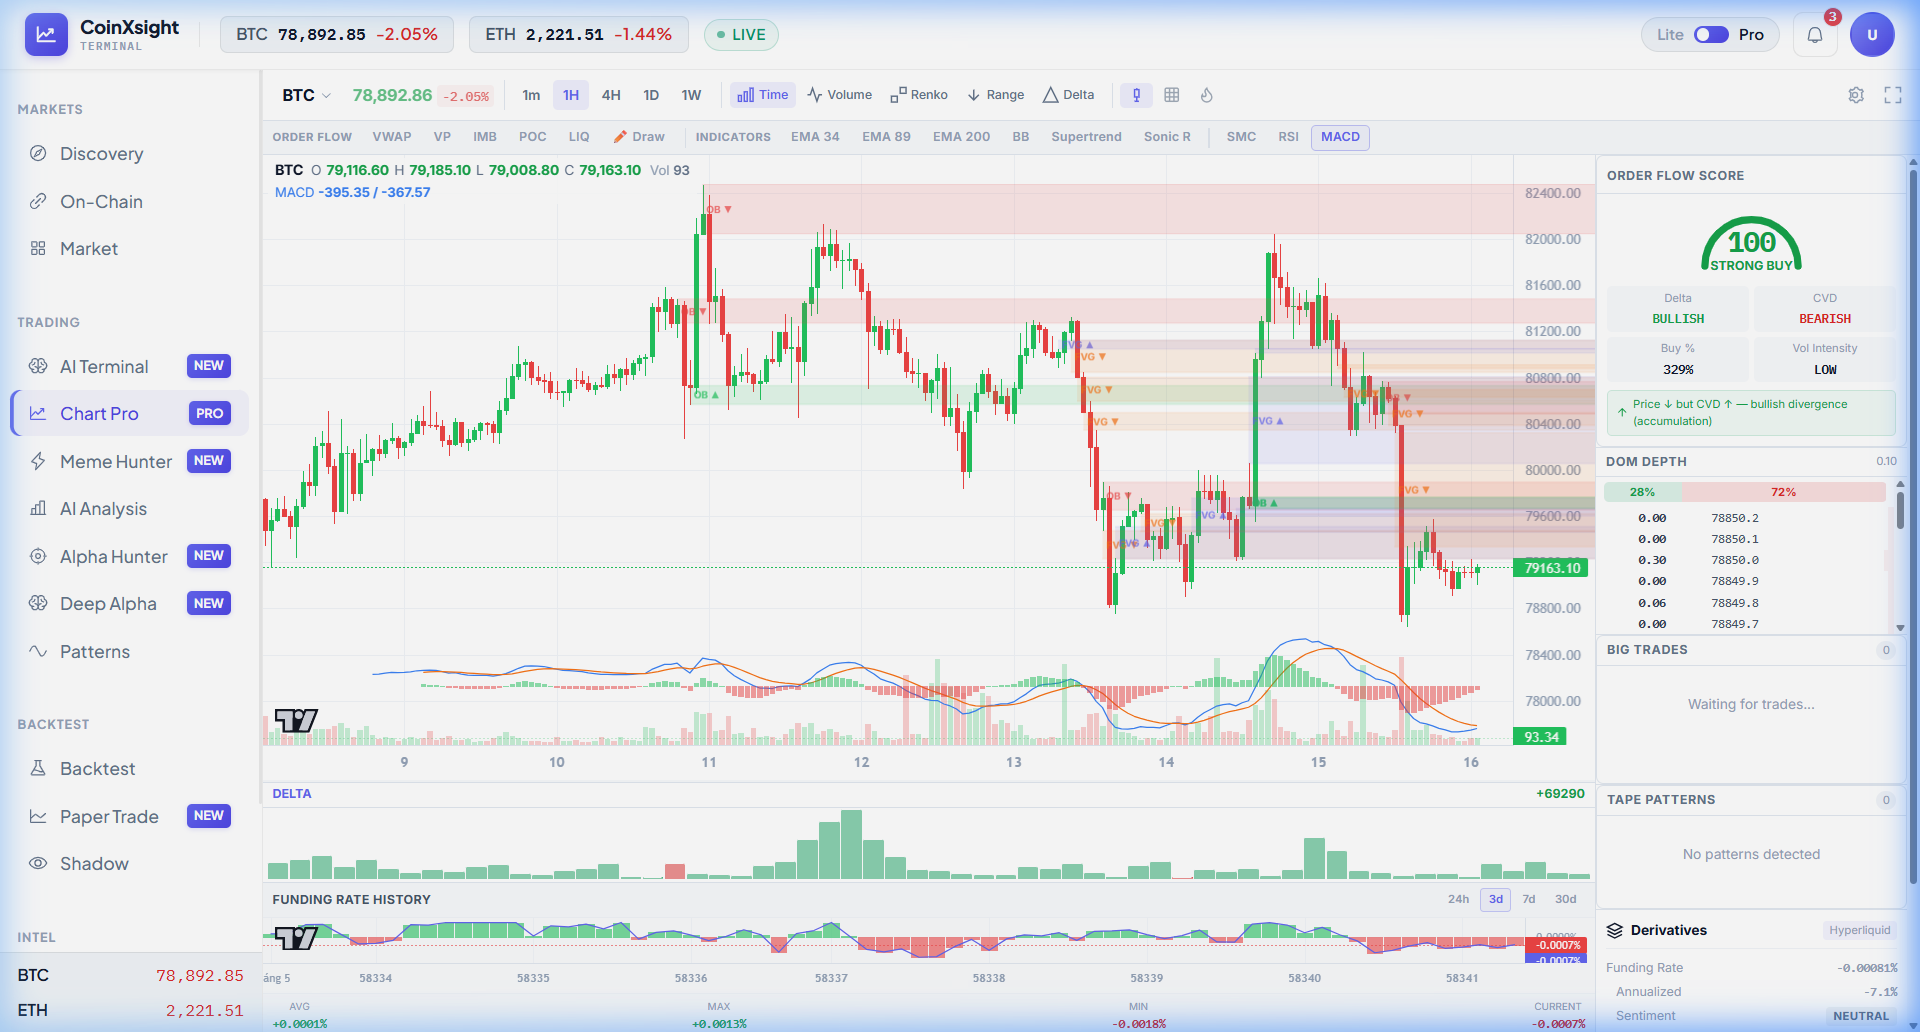
Open Chart Pro → click MACD from the indicator toolbar. In the screenshot below, BTC 1H shows the MACD panel beneath the candlestick chart:
The MACD Line (blue) is at -247.07, sitting well below zero — confirming bearish momentum on this timeframe.
The Signal Line (orange) is at -195.62, with the MACD Line below the Signal Line — a bearish crossover is active.
The histogram shows red bars, but they are compressing toward zero. This compression is the detail most traders miss — it tells you selling momentum is fading even though the trend is still bearish. When histogram bars shrink for 3+ consecutive candles, expect either a bullish crossover or at minimum a relief bounce.
What I specifically watch for: histogram divergence with price. If BTC makes a lower low but the histogram prints a shallower bar (less negative), that is bullish divergence forming. In the current chart, the histogram is not yet diverging — both price and histogram are moving together. That means the bearish trend still has momentum behind it.
Step 2: Cross-reference MACD with Confluence on Deep Alpha
MACD by itself is one input. Navigate to Deep Alpha → search BTC. The Confluence Score tells you whether the MACD bearish reading is supported by other dimensions. Currently: Confluence: PARTIAL, Trend: BEARISH, RSI: 38.9 (approaching oversold). The MACD bearish crossover is aligned with the bearish trend — they agree. But RSI at 38.9 is starting to flash a warning that the sell-off may be getting exhausted. This is the kind of nuance you get from the Confluence system — MACD says "still bearish," RSI says "getting stretched." I would not short here; I would wait for either RSI to fully bottom or MACD histogram to cross above zero before entering.
If MACD is showing bearish momentum fading (histogram compressing), check whether institutional flow supports a reversal. Navigate to On-Chain. Exchange Inflow is +$32.8M — still bearish distribution. Until this flips to net outflow, the MACD histogram compression is just a momentum pause, not a reversal setup. The combination I wait for: MACD histogram crossing above zero + exchange outflows beginning + RSI recovering above 50. That triple confirmation is the buy signal.
Whether you want to buy Bitcoin, buy Ethereum, or trade altcoins, this indicator helps you time entries on any crypto exchange with data-driven confidence.
Frequently Asked Questions
What MACD settings should I use for crypto?
The default 12/26/9 settings work well for most crypto assets on 4H and daily timeframes. Some day traders use faster settings (8/17/9) for quicker signals, but this produces more noise. CoinXSight uses the standard 12/26/9 across all tokens for consistency.
Is MACD better than RSI?
Neither is objectively better — they measure different aspects of momentum. RSI tells you how stretched the current move is. MACD tells you whether the trend is accelerating or decelerating. Using both together provides a more complete picture, which is why CoinXSight includes both in the Momentum Layer.
What does a MACD histogram compression mean?
When histogram bars progressively shrink toward zero, momentum is fading. This often precedes a trend pause or reversal. It is one of the earliest warning signals MACD provides — often appearing 1-3 candles before the actual MACD/Signal crossover.
Can MACD predict price targets?
No. MACD indicates direction and momentum strength, not price levels. For price targets, combine MACD signals with support/resistance levels (Chart Pro), Order Block zones (Deep Alpha SMC), or Fibonacci extensions.
How do I avoid false MACD crossovers?
Three filters: (1) Only trade crossovers that occur below zero for buys or above zero for sells — they carry more significance. (2) Confirm with RSI — if RSI agrees with the MACD direction, the signal is more reliable. (3) Check the Confluence Score — a crossover backed by a score of 6+ is far more trustworthy than one at 3/10.
JV
Julian Vance
TA // SYSTEMS
Lead Technical Systems Architect·Signals & Metrics Desk
Technical systems developer with a mathematical focus on momentum indicators, volatility metrics (ATR), volume profiles, and multi-timeframe filter models.
QUANTITATIVE SUITE // DEEP ALPHA ENGINEACTIVE
BTC/USDT // LIVE SCANNER
CONFLUENCE 77
LIVE SPOT PRICE$83,669.23MODERATE_BUY
TP2
$89,021.25
+7.04%
TP1
$85,510.14
+2.81%
ENTRY
$83,169.41
ZONE
SL
$81,999.04
-1.41%
Auto-detect Order Blocks, Fair Value Gaps and risk-adjusted DCA ladders in < 5s.
Master every cryptocurrency technical analysis indicator with this complete guide. Covers 27 indicators across trend, momentum, volume, volatility, and crypto-native…