RSI Indicator: How to Use It to Find Crypto Entry Points
A complete guide to the RSI indicator — read overbought and oversold zones, spot divergences, and combine RSI with MACD and EMA for higher-probability crypto trades.
JV
Julian VanceLead Technical Systems Architect·Mar 16, 2026 · 10 min read · Updated Oct 6
RSI (Relative Strength Index) is a momentum oscillator that measures the speed and magnitude of recent price changes on a scale from 0 to 100. Developed by J. Welles Wilder Jr. and published in his 1978 book New Concepts in Technical Trading Systems, RSI answers one question: has price risen too fast or dropped too far relative to its recent behavior?
In crypto markets — where 15% daily swings are routine — RSI helps traders distinguish between a healthy pullback and the start of a new trend. It is one of the four momentum indicators in CoinXSight's Confluence Scoring system. For a complete overview of all crypto indicators and how they work together, see our Cryptocurrency Technical Analysis Indicators guide.
How RSI Is Calculated
RSI uses a default period of 14 candles. The formula:
RS = Average Gain (14 periods) / Average Loss (14 periods)
RSI = 100 - (100 / (1 + RS))
What this means in practice: If a token gained an average of 3% on its up-days and lost an average of 1.5% on its down-days over the last 14 candles, RS = 3/1.5 = 2.0, giving RSI = 100 – (100/3) = 66.7 — approaching overbought but not yet there.
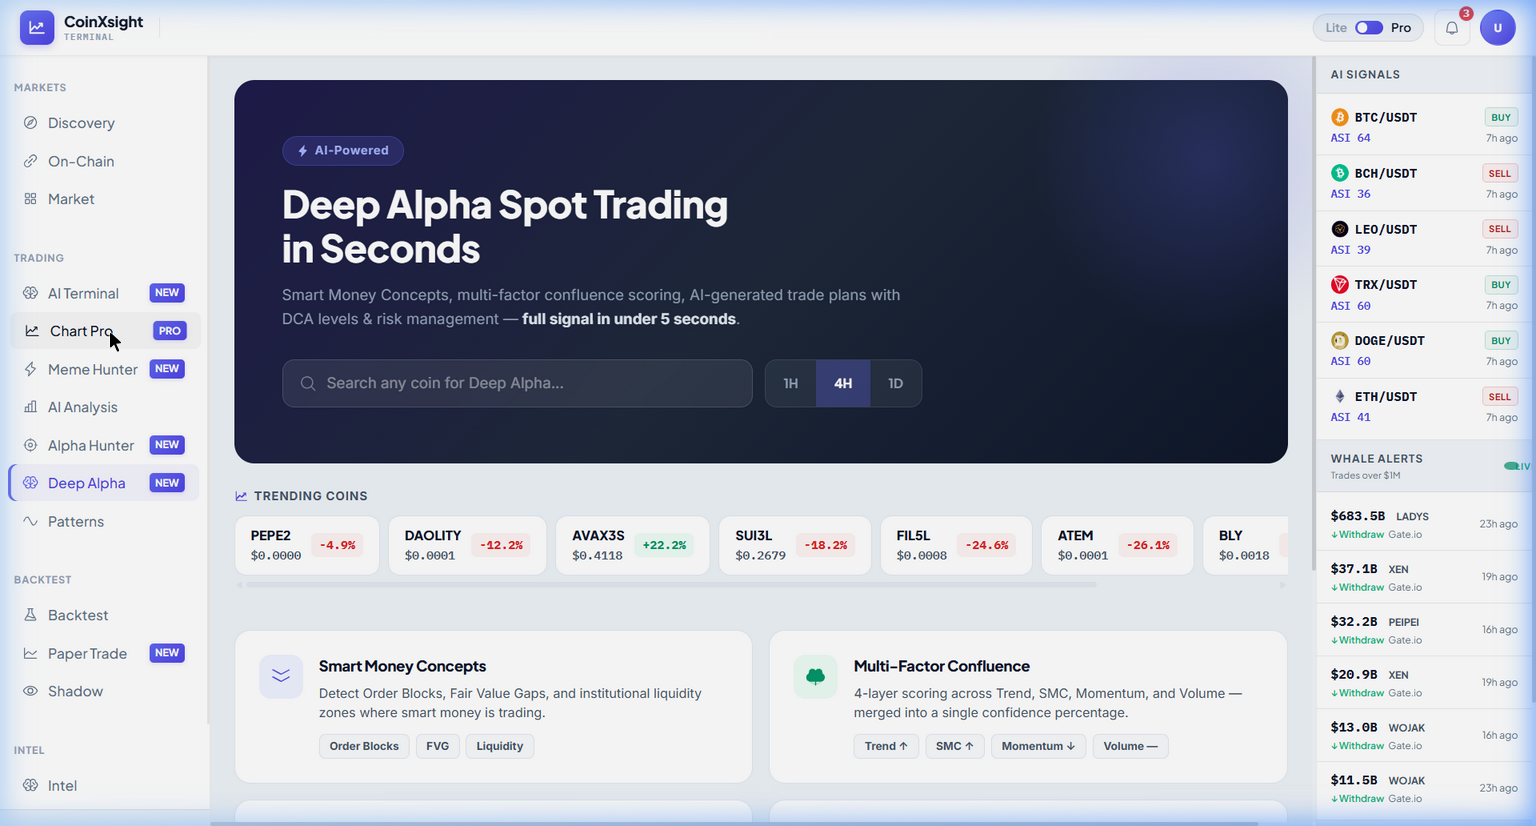
💡 On CoinXSight, RSI (period 14) is automatically computed by the platform's dedicated analysis engine and the results are available across multiple modules — Deep Alpha displays the numerical value and status, Chart Pro overlays the RSI line on the candlestick chart, Discovery uses it for signal triage, and Meme Hunter factors it into token scoring. No manual configuration required.
How to Read RSI — The 3 Key Zones
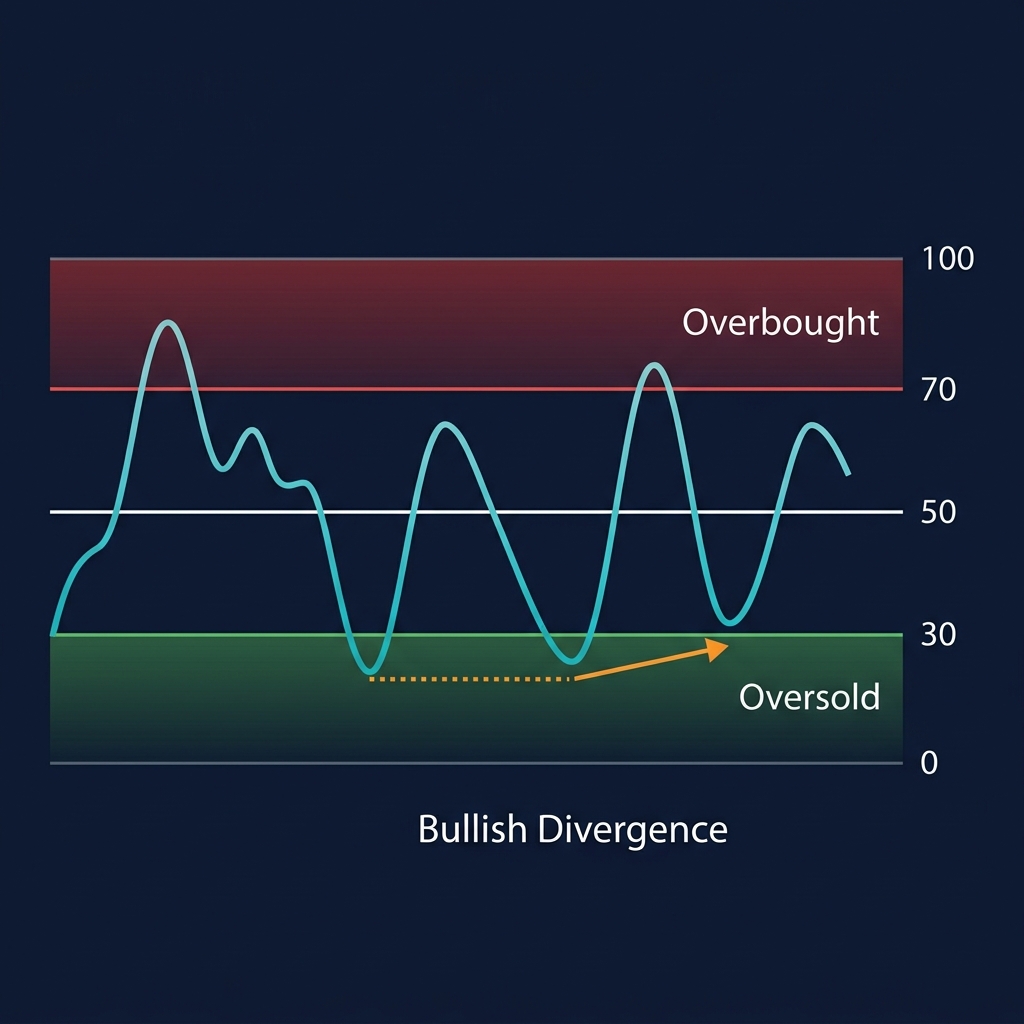
1. Overbought Zone — RSI > 70
When RSI climbs above 70, the token has gained significant value relative to recent history. This does not mean "sell immediately" — it means momentum is elevated and the risk of a pullback increases.
How to apply:
If holding: Consider setting a trailing stop or taking partial profit at your first target
If looking to buy: Wait. Entering above RSI 70 puts you at the tail end of a move
RSI > 80: Extreme overbought — pullback probability rises sharply, but in parabolic rallies, RSI can stay here for days
2. Oversold Zone — RSI < 30
RSI below 30 means selling pressure has been unusually intense. Price may be due for a bounce — but oversold does not mean "buy blindly."
How to apply:
Set alerts on CoinXSight when RSI hits 30 for tokens on your watchlist
Wait for RSI to cross back above 30 before entering — this confirms the reversal has started
RSI < 20: Extremely oversold — but during market-wide crashes (like the May 2022 LUNA collapse), RSI stayed below 20 for over a week
3. Neutral Zone — RSI 30–70
This is the normal operating range. An RSI around 50 indicates balance — neither buyers nor sellers have a clear edge.
Directional bias within the neutral zone:
RSI consistently above 50 → bulls are in control of the short-term trend
RSI consistently below 50 → bears have the upper hand
3 Advanced RSI Techniques Used by Professional Traders
Technique 1: RSI Divergence — The Most Powerful Signal
Divergence occurs when price and RSI move in opposite directions. It signals that the current trend is losing internal momentum, even though price hasn't reversed yet.
Type
Price Action
RSI Action
Meaning
Bullish Divergence
Lower low
Higher low
Selling pressure weakening → potential reversal up
Bearish Divergence
Higher high
Lower high
Buying momentum fading → potential reversal down
Real-world scenario — ETH, April 2026:
On April 18, 2026, ETH dropped to $2,840 — a lower low compared to its April 5 low of $2,920. But on CoinXSight's Deep Alpha panel, RSI printed 32 versus its earlier reading of 28. That higher RSI low while price made a lower low = textbook bullish divergence.
Within 72 hours, ETH rallied to $3,180 — a 12% move that traders watching RSI divergence caught near the bottom.
How to spot it on CoinXSight across modules:
Deep Alpha → search for your target token → check the RSI value and status in the Technical Indicators panel
Chart Pro → overlay RSI on the candlestick chart → visually compare the direction of RSI swing lows vs. price swing lows
If RSI is rising while price is falling → flag as bullish divergence → check the Confluence Score for confirmation
Technique 2: RSI + EMA Combination
RSI tells you momentum state. EMA tells you trend direction. Combining them filters out false signals:
Setup
RSI
EMA Condition
Signal Strength
Strong buy
Just crossed above 30
Price above EMA 34
★★★★★
Moderate buy
Between 40-50, rising
Price near EMA 89
★★★☆☆
Strong sell
Just crossed below 70
Price below EMA 34
★★★★★
Caution
Above 70
Price far above EMA 200
★★☆☆☆ — stretched
On CoinXSight, both RSI and EMA (34/89/200) are computed by the platform's analysis engine and surfaced across multiple modules — Deep Alpha displays the numerical readings, Chart Pro overlays both on the candlestick chart, and Discovery uses them for signal scoring.
Technique 3: RSI Within the Confluence Scoring System
On CoinXSight, RSI is never evaluated in isolation. It feeds into the Momentum Layer of the 4-layer Confluence Scoring system:
Trend Layer: EMA ribbon + Supertrend → establishes direction
SMC Layer: Order Blocks + Fair Value Gaps → identifies institutional zones
Volume Layer: Volume ratio + Bollinger Bands → validates strength
Example strong confluence: RSI crosses above 30 (oversold recovery) + price lands on a Bullish Order Block + EMA 89 provides support + volume spikes above average = Confluence Score 8–9/10 → a setup with significantly higher win probability than any single signal alone.
⚠️ Limitation: RSI divergence can take 3-10 candles to play out. On a 4H chart, that means 12–40 hours of waiting. Impatient traders who enter at the first sign of divergence without waiting for confirmation (RSI crossing back above 30, price breaking a micro-resistance) often get stopped out early.
Common RSI Mistakes
Selling the moment RSI crosses 70: In strong uptrends, RSI can stay overbought for weeks. Bitcoin maintained RSI above 70 for 23 consecutive daily candles during its Q4 2024 rally. Selling purely on overbought RSI during a momentum breakout leaves massive gains on the table.
Buying the moment RSI hits 30: Oversold does not mean "bottom." During the June 2022 crypto crash, BTC's daily RSI stayed below 30 for 9 consecutive days — anyone buying the first touch at 30 faced another 15% drawdown.
Using RSI alone: RSI measures one dimension — momentum speed. It says nothing about trend direction (use EMA), institutional positioning (use Order Blocks), or volume conviction. Always combine with at least one trend and one volume indicator.
Ignoring the timeframe: RSI 25 on a 1-hour chart is far less meaningful than RSI 25 on a daily chart. The daily signal carries weeks of accumulated selling pressure behind it. In crypto, daily RSI is generally the most reliable timeframe for swing trades.
How to Use RSI on CoinXSight — Multi-Module Workflow
The biggest trap I see traders fall into with RSI: they treat the number in isolation. RSI 35 during a bull market pullback is a buying opportunity. RSI 35 during a structural downtrend is the trend doing its job. Context is everything. Here is how I read RSI across CoinXSight's modules.
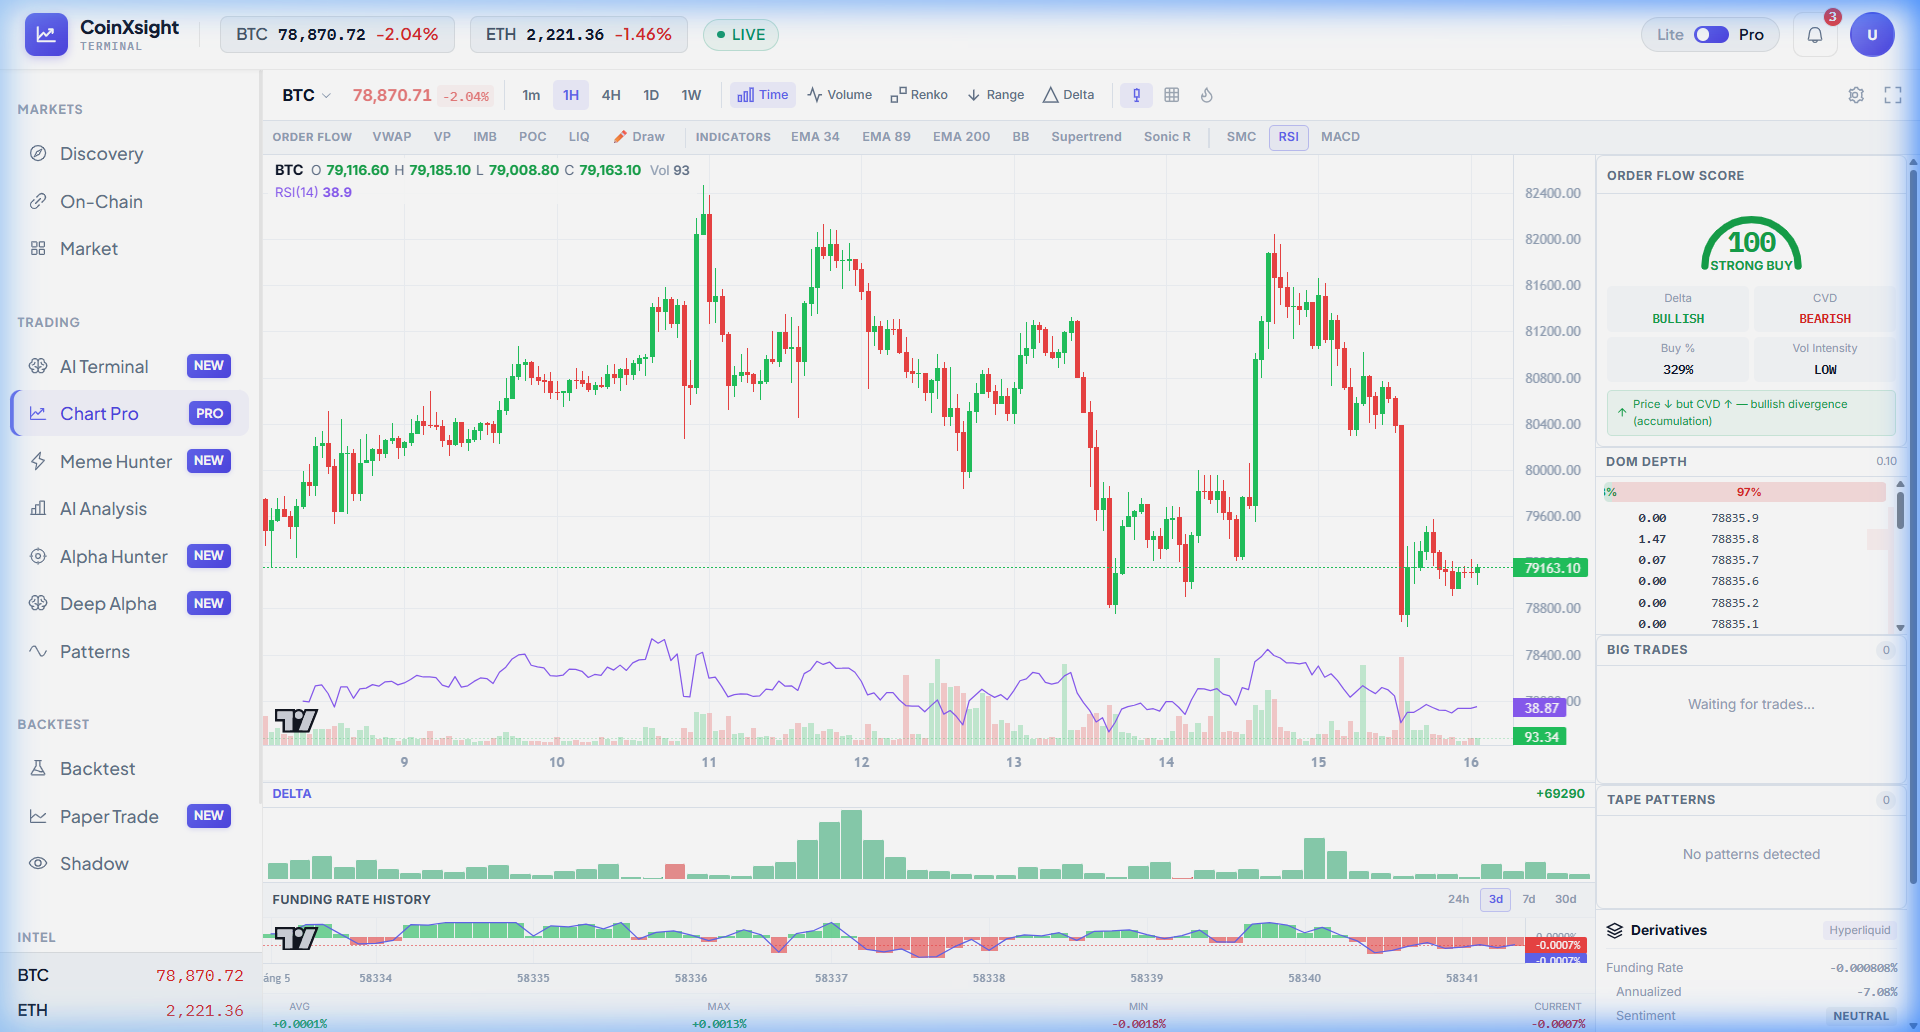
Open Chart Pro → toggle RSI from the indicator toolbar. The RSI panel appears below the candlestick chart. In the screenshot below, BTC 1H shows RSI(14) at 38.9 — not yet oversold (below 30), but entering the caution zone. The RSI line has been making lower highs since the $82,400 peak, while price has been grinding down — that is bearish momentum confirmation, not divergence. If RSI were making higher lows while price made lower lows, that would be bullish divergence worth acting on.
Notice the Order Flow Score on the right: 100 — STRONG BUY with Delta BULLISH. That creates an interesting conflict — RSI is weakening (momentum fading), but order flow is showing aggressive buying. In my experience, when RSI and order flow disagree, the order flow usually leads in the short term (next 2-4 candles), while RSI is right about the medium-term direction. Translation: there might be a short bounce, but the overall momentum is still tilted bearish.
Step 2: Check RSI context against Deep Alpha analysis
Navigate to Deep Alpha → search BTC. The analysis page shows the big picture: Trend: BEARISH, Confluence: PARTIAL. The AI-generated trade plan shows a SELL setup with Entry at $80,021 and TP1 at $76,886. The AI Signals sidebar shows BTC/USDT with ASI 70 and a BUY label — that ASI score tells me the mid-term accumulation signal is strengthening even as short-term RSI weakens. This is exactly the kind of RSI context that prevents premature entries: RSI at 38 in a bearish trend is not a buy signal yet. Wait for RSI to dip below 30 and then cross back above it.
Step 3: Cross-validate RSI signals with On-Chain flow
The most reliable RSI buy setups pair oversold RSI with whale accumulation. Switch to On-Chain → check the Exchange Flows panel. Currently, Exchange Inflow is +$32.8M with Exchange Outflow at $0 — capital flowing into exchanges, not out. That is distribution, not accumulation. Combined with RSI at 38.9 (not yet oversold), this confirms there is no reason to catch this falling knife. I would only consider buying if RSI drops below 30 AND On-Chain flips to net outflows simultaneously.
Whether you want to buy Bitcoin, buy Ethereum, or trade altcoins, this indicator helps you time entries on any crypto exchange with data-driven confidence.
Frequently Asked Questions
What RSI level should I buy at?
There is no magic number. RSI below 30 signals a potential oversold zone, but you should wait for RSI to cross back above 30 and confirm with supporting signals — rising volume, EMA support, or a bullish Order Block nearby. Blindly buying at RSI 30 without confirmation is a common losing habit.
Is RSI more reliable than MACD?
They measure different things. RSI tracks momentum speed (how fast price is moving). MACD tracks trend strength and direction (whether momentum is accelerating or decelerating). Neither is "better" — they are strongest when used together, which is why CoinXSight places both in the Momentum Layer.
What RSI period should I use?
Period 14 is the standard and works for most situations. Shorter periods (7–9) produce faster signals with more noise — useful for day traders. Longer periods (21–25) produce smoother, more reliable signals but react slower — better for swing traders.
What is the difference between RSI and StochRSI?
StochRSI applies the Stochastic formula to RSI values, producing a more sensitive oscillator that swings between 0 and 1. StochRSI reacts faster to price changes but generates more false signals. Both RSI and StochRSI are computed by CoinXSight's analysis engine and displayed across multiple modules including Deep Alpha, Chart Pro, and the Confluence scoring system.
Can RSI predict the future?
No indicator predicts the future. RSI measures the current state of momentum relative to recent history. When combined with trend analysis, volume data, and institutional flow in a multi-layer system, it helps you make higher-probability decisions — but every trade still carries risk.
JV
Julian Vance
TA // SYSTEMS
Lead Technical Systems Architect·Signals & Metrics Desk
Technical systems developer with a mathematical focus on momentum indicators, volatility metrics (ATR), volume profiles, and multi-timeframe filter models.
QUANTITATIVE SUITE // DEEP ALPHA ENGINEACTIVE
BTC/USDT // LIVE SCANNER
CONFLUENCE 77
LIVE SPOT PRICE$83,669.23MODERATE_BUY
TP2
$89,021.25
+7.04%
TP1
$85,510.14
+2.81%
ENTRY
$83,169.41
ZONE
SL
$81,999.04
-1.41%
Auto-detect Order Blocks, Fair Value Gaps and risk-adjusted DCA ladders in < 5s.
Master every cryptocurrency technical analysis indicator with this complete guide. Covers 27 indicators across trend, momentum, volume, volatility, and crypto-native…