Smart Money Concepts for Crypto: Order Blocks, FVG, and Liquidity Sweeps Explained
Master Smart Money Concepts (SMC) for crypto trading. Learn Order Blocks, Fair Value Gaps, Break of Structure, Change of Character, and liquidity engineering — the framework institutions use to move markets.
JV
Julian VanceLead Technical Systems Architect·May 22, 2026 · 17 min read · Updated Oct 6
Smart Money Concepts (SMC) is a price action framework that reveals HOW and WHY institutions move price. While traditional technical analysis tells you "price bounced off support," SMC explains the mechanics: institutions engineered that bounce by sweeping liquidity below support, filling their orders, and then pushing price up.
The core idea: retail traders are the liquidity source for institutional orders. Every stop-loss you set, every breakout you chase — smart money knows where those orders sit and uses them to enter and exit positions.
Before any SMC analysis, you must read market structure correctly.
Higher Highs and Higher Lows (Bullish)
Price Action:
    HH ←── New higher high
   /
  /
HL     HH ←── Previous high broken
 /    /
/    /
HL    HL

Trend: BULLISH — buy pullbacks to HL zones
Lower Highs and Lower Lows (Bearish)
Price Action:
LH    LH
  /    /

      /
    LH    LL ←── New lower low

            LL

Trend: BEARISH — sell rallies to LH zones
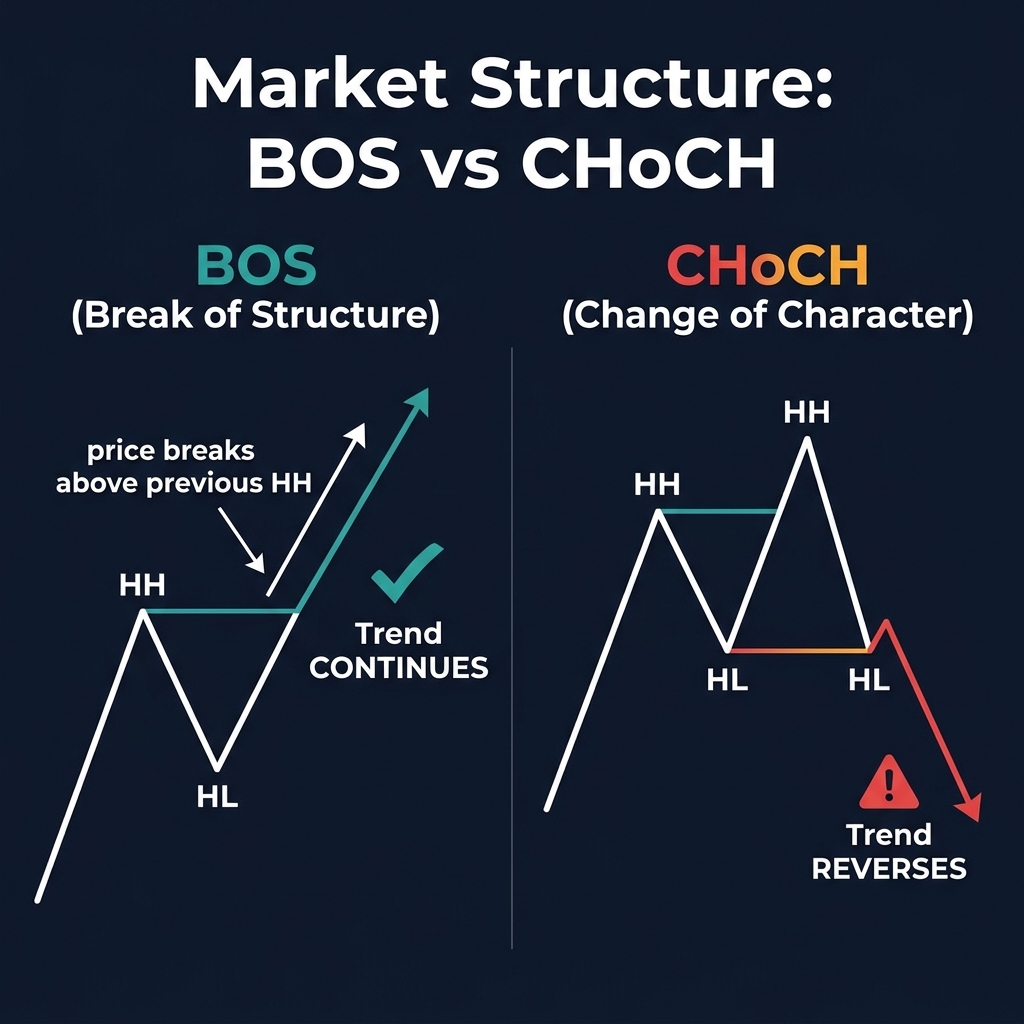
Break of Structure (BOS)
A BOS confirms the existing trend continues. In a bullish trend, BOS occurs when price breaks above the most recent swing high. In a bearish trend, BOS occurs when price breaks below the most recent swing low.
BOS rules:
Must break with a candle BODY close (not just a wick)
Higher timeframe BOS is more significant than lower timeframe
Volume should expand on BOS candles
Change of Character (CHoCH)
A CHoCH signals a potential trend reversal. It's the FIRST break against the current trend direction.
Current Trend
CHoCH Signal
What It Means
Bullish (HH/HL)
Price breaks below the most recent HL
Bearish shift — look for shorts
Bearish (LH/LL)
Price breaks above the most recent LH
Bullish shift — look for longs
CHoCH vs BOS — the critical difference:
BOS = trend continuation (same direction as current trend)
CHoCH = trend reversal (opposite direction)
This distinction is the single most important concept in SMC. Get this wrong and every trade will be against the trend.
Order Blocks: Where Institutions Enter
Modern crypto analytics platforms integrate these signals with additional data layers — combining trading indicators, on-chain metrics, and AI analysis for higher-probability entries.
An Order Block (OB) is the last candle of the opposing color before a strong impulsive move. It represents the zone where institutional orders were placed.
Bullish Order Block
The last RED (bearish) candle before a strong GREEN (bullish) impulse move up. This is where institutions were buying aggressively enough to reverse the down move.
Identification criteria:
Find a strong bullish impulse move (3+ candles with expanding bodies)
Look for the last bearish candle before that move
The range of that candle (high to low) is your Order Block zone
The candle should have broken structure (created a BOS or CHoCH)
Bearish Order Block
The last GREEN (bullish) candle before a strong RED (bearish) impulse move down. This is where institutions were selling aggressively.
Order Block Trading Rules
Rule
Details
Entry
Wait for price to return to the OB zone
Refinement
Use the body of the OB candle (not wicks) for tighter entries
Stop loss
Above/below the OB high/low + small buffer
Invalidation
If price closes through the OB with strong volume, the OB is broken
Best OBs
Ones that caused CHoCH or strong BOS with volume
Avoid
OBs already tested once (used/mitigated)
Key rule: Order Blocks are ONE-TIME-USE zones. Once price returns to an OB and reacts, that OB is "mitigated" — the orders have been filled. Don't expect it to work twice.
Fair Value Gaps (FVG): Institutional Imbalance
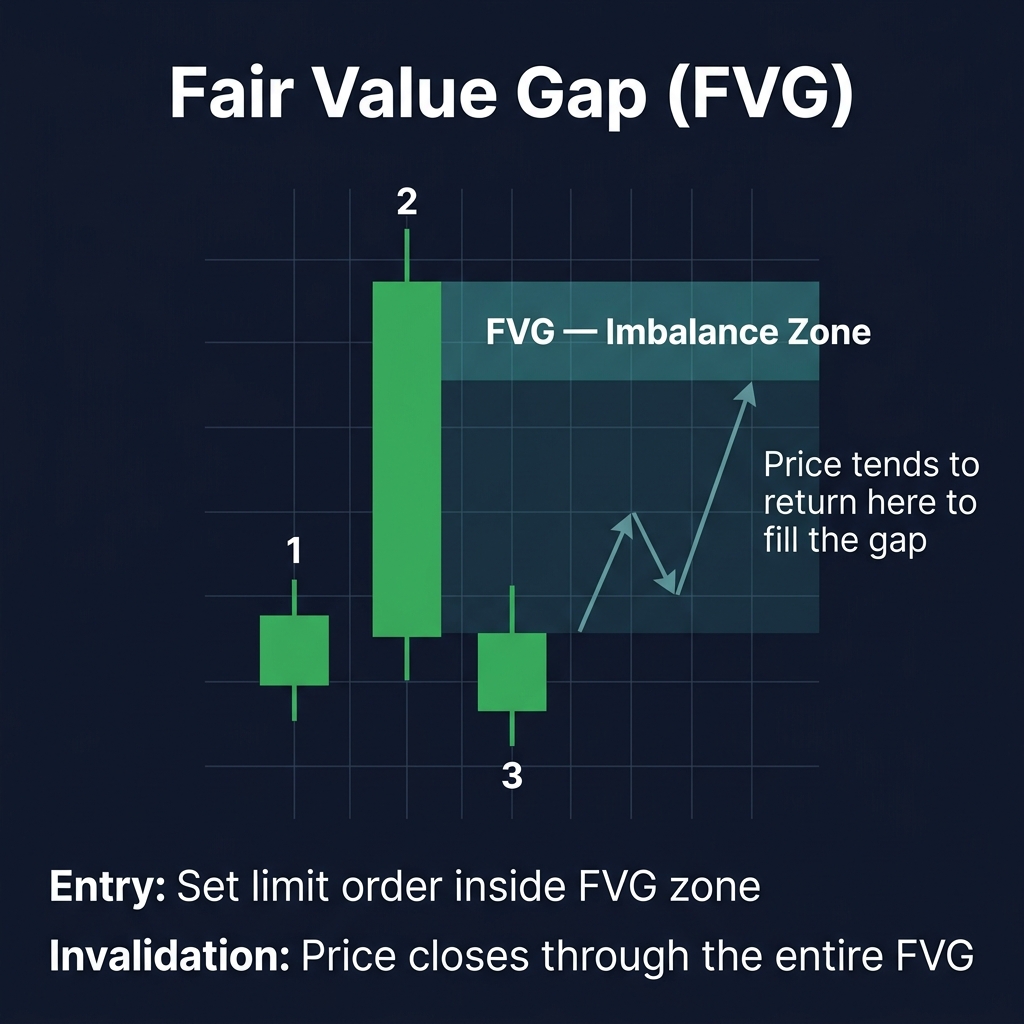
A Fair Value Gap (also called an imbalance) is a three-candle pattern where the middle candle's body is so large that it creates a gap between the first and third candle's wicks.
Bullish FVG
Candle 3:  ─┤ High
             │ (wick doesn't reach down to Candle 1's high)
             │
   GAP ──→   │ ← This gap is the FVG
             │
Candle 1:  ─┤ High
             │
Formation: Candle 1 high is BELOW Candle 3 low. The space between them is the FVG — price moved so fast that it didn't trade at these levels, creating an "unfair" gap that price tends to return to fill.
Bearish FVG
The inverse: Candle 1 low is ABOVE Candle 3 high. The gap below represents aggressive selling imbalance.
Why FVGs Matter
Institutional algorithms are programmed to seek "fair value." When price creates an imbalance by moving too fast in one direction, there's a high probability it will return to fill that gap before continuing.
FVG Trading Framework:
Scenario
Action
Bullish FVG in bullish trend
Wait for price to pull back INTO the FVG → Long entry
Bearish FVG in bearish trend
Wait for price to rally INTO the FVG → Short entry
FVG gets fully filled (closed through)
FVG is invalidated — no trade
FVG partially filled then rejects
Strongest signal — institutions defended the level
Multiple FVGs stacking
Use the first unfilled FVG closest to current price
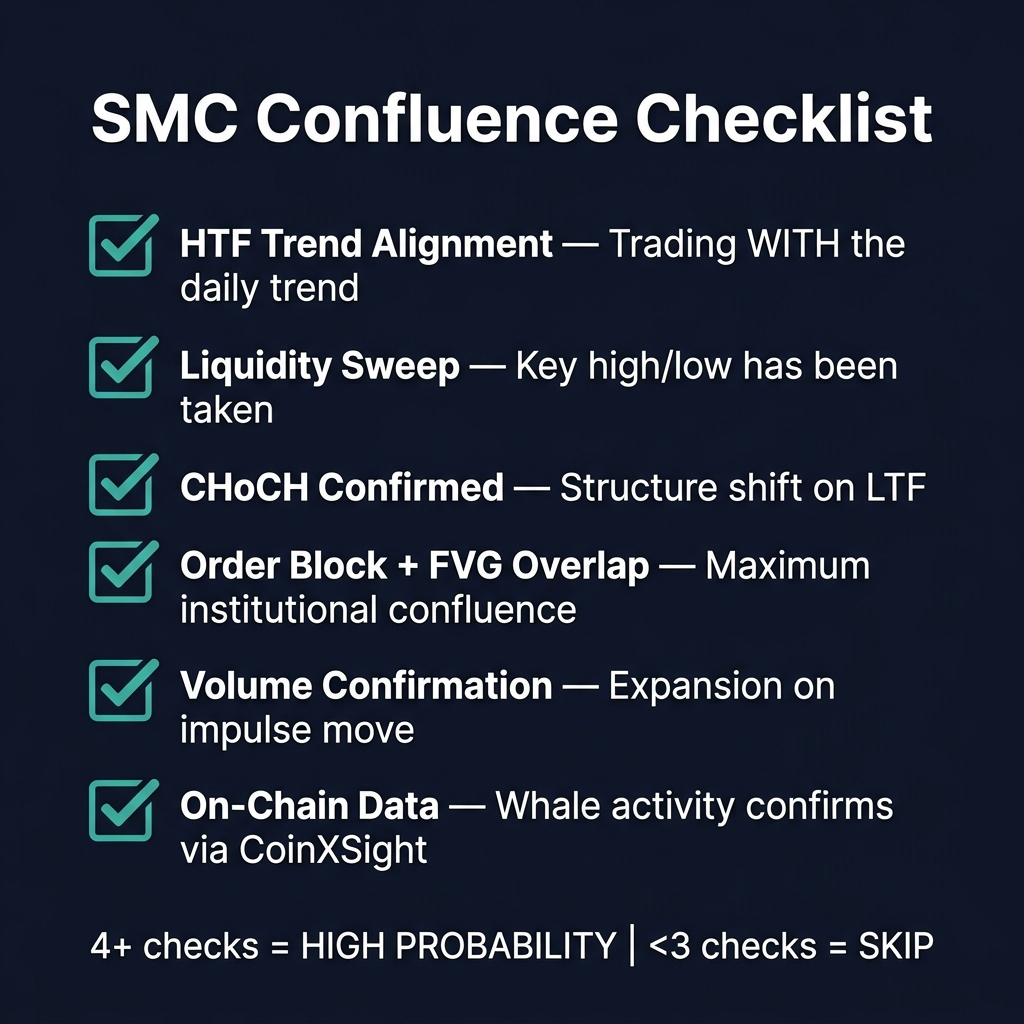
Pro tip: The most powerful setup is an FVG nested inside an Order Block. When both zones overlap, you have maximum institutional confluence.
Liquidity: The Fuel for Every Move
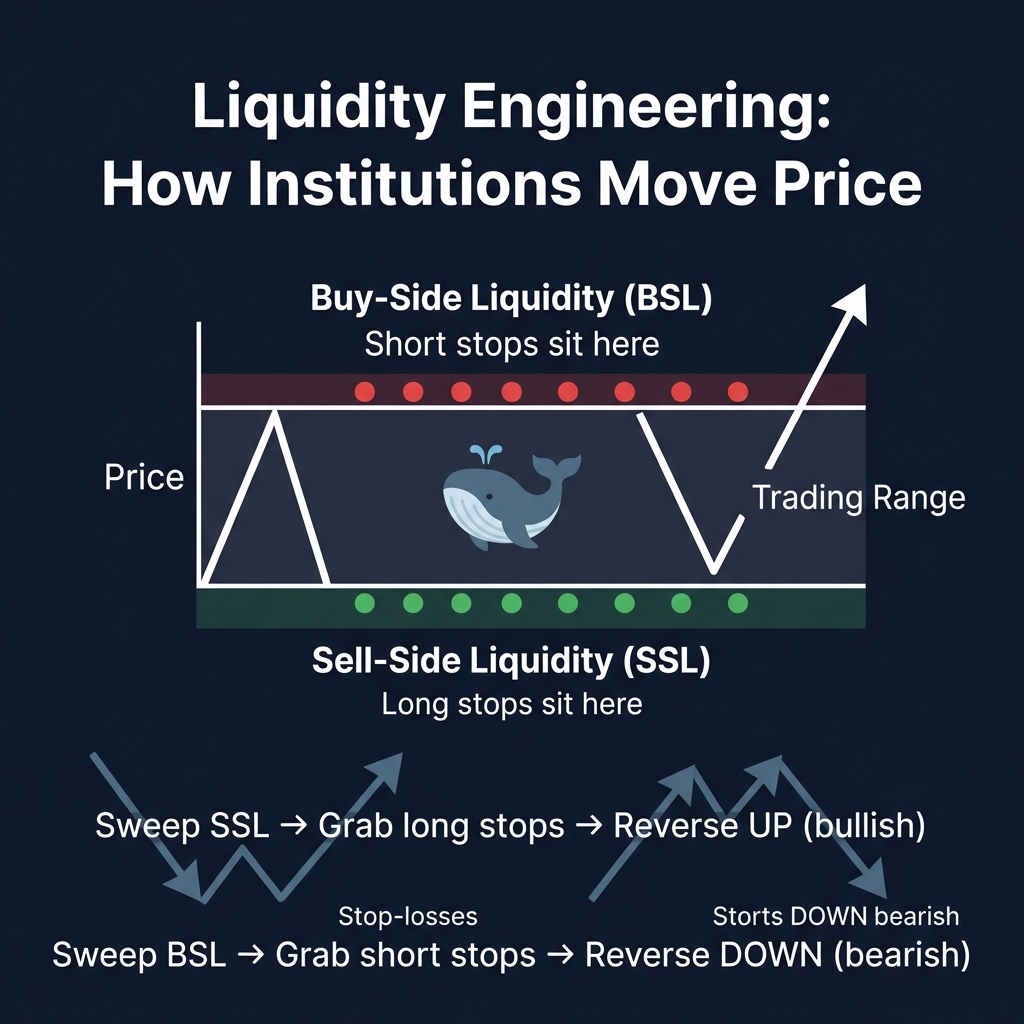
This is where SMC diverges most from traditional TA. In SMC, support and resistance levels are NOT barriers — they're liquidity pools that institutions target.
Buy-Side Liquidity (BSL)
Stop-loss orders from short sellers sit ABOVE swing highs. These are buy orders (stops are triggered as market buys). When institutions want to sell a large position, they push price UP into this buy-side liquidity to fill their sell orders against the retail buy stops.
Sell-Side Liquidity (SSL)
Stop-loss orders from long buyers sit BELOW swing lows. These are sell orders. When institutions want to buy, they push price DOWN into sell-side liquidity to fill their buy orders against the retail sell stops.
The Liquidity Sweep
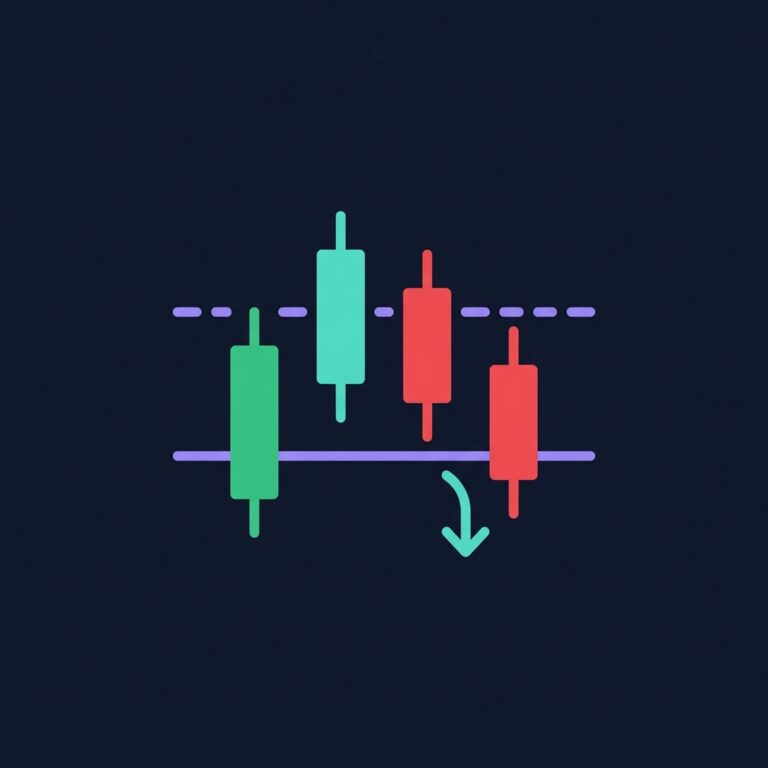
A liquidity sweep occurs when price pushes beyond a key level (grabbing the stops), then immediately reverses. This is the crypto version of the Wyckoff "spring" or "upthrust."
Price closes BACK inside the level on the same or next candle
Volume spikes on the sweep candle
Liquidity Concepts Map
Concept
Where Liquidity Sits
Who Gets Trapped
Institutional Goal
Equal highs
Above the double/triple top
Breakout buyers + short stops
Sell into buy-side liquidity
Equal lows
Below the double/triple bottom
Breakdown sellers + long stops
Buy from sell-side liquidity
Trendline liquidity
Below ascending trendline
Trend-following long stops
Accumulate at discount
Range highs/lows
Beyond range boundaries
Both sides alternately
Fill orders on each sweep
This reframes everything you know about support/resistance. When you see "equal lows" on a chart, traditional TA says "strong support." SMC says "that's a liquidity target — price will sweep those lows to grab stops before reversing."
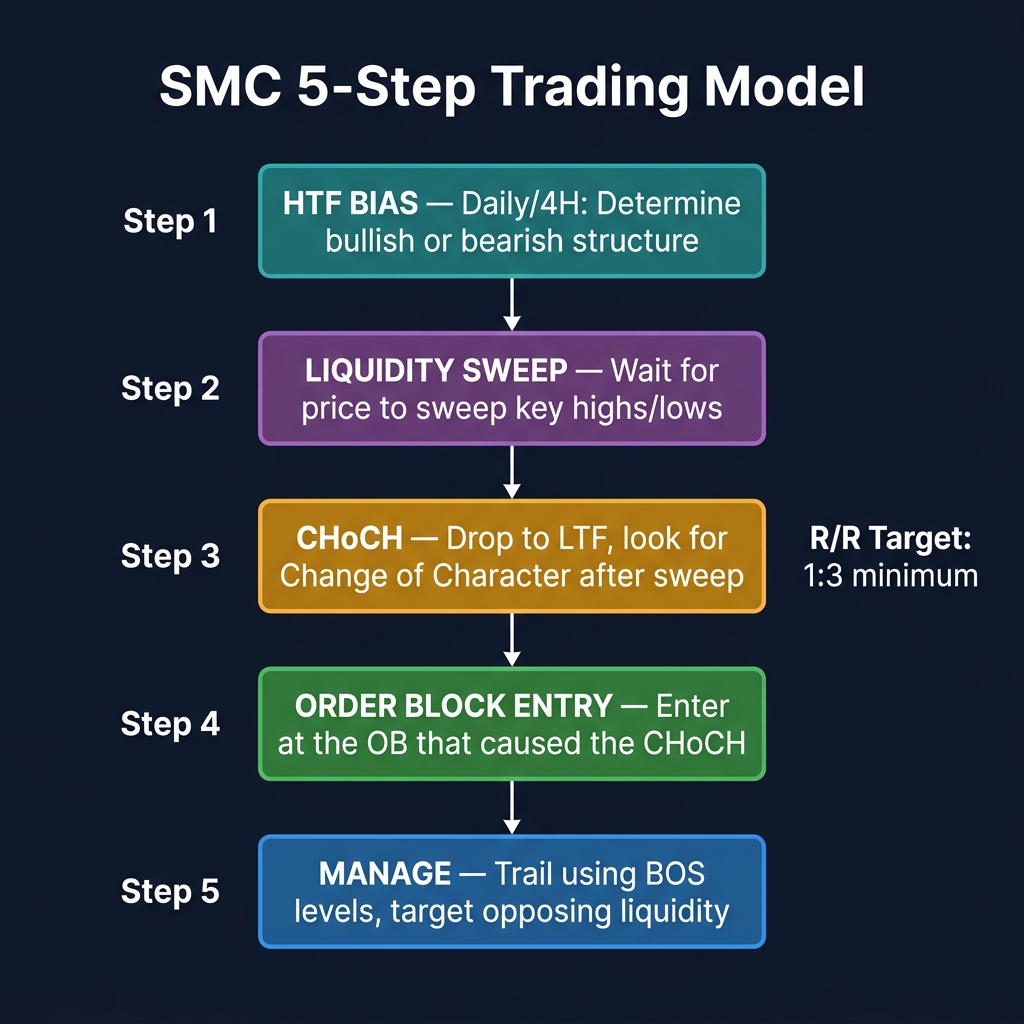
Putting It All Together: The SMC Trading Model
Step 1: Determine HTF Bias
Start on the Daily or 4H chart to determine the Higher Timeframe (HTF) direction:
Is the overall structure bullish (HH/HL) or bearish (LH/LL)?
Where is the nearest unmitigated Order Block?
Where are the major liquidity pools?
Step 2: Wait for Liquidity Sweep on HTF
On your trading timeframe (1H or 4H), wait for price to sweep a key liquidity level:
Sweep of equal lows → potential long setup
Sweep of equal highs → potential short setup
Sweep of a major swing point → highest probability
Step 3: Look for CHoCH on LTF
After the sweep, drop to a Lower Timeframe (15M or 5M) and look for a Change of Character:
After a sell-side sweep → look for bullish CHoCH (break above recent LH)
After a buy-side sweep → look for bearish CHoCH (break below recent HL)
Step 4: Enter at the Order Block
Once CHoCH is confirmed:
Identify the Order Block that caused the CHoCH
Set a limit order at the OB zone (body of the candle)
Stop loss: Beyond the OB + the sweep low/high
Target: The opposing liquidity pool
Step 5: Manage the Trade
Position management:
1. Move stop to break-even after 1:1 R/R reached
2. Take 50% profit at first opposing OB or FVG
3. Trail remaining position using BOS levels
4. Full exit at opposing liquidity pool or HTF OB
Example: BTC Long Setup
1. HTF BIAS (Daily): Bullish — HH/HL structure intact
2. LIQUIDITY SWEEP: Price sweeps below equal lows at $67,500
   - Long stops triggered (sell-side liquidity taken)
   - Volume spikes, then candle closes back above $67,500
3. CHoCH (15M): After sweep, 15M structure shifts bullish
   - Price breaks above most recent 15M lower high
4. ORDER BLOCK: Last bearish candle before 15M CHoCH
   - OB zone: $67,800 - $68,100
5. ENTRY: Limit long at $67,900 (middle of OB)
   - Stop: $67,300 (below sweep low) — Risk: 0.88%
   - Target 1: $69,500 (first unmitigated bearish OB) — 2.36%
   - Target 2: $71,200 (buy-side liquidity above equal highs) — 4.86%
   - R/R: 1:2.7 to T1, 1:5.5 to T2
SMC + CoinXSight Integration
Alpha Hunter = Liquidity Sweep Detector
Alpha Hunter detects abnormal volume spikes and price reversals — which are often liquidity sweeps in SMC terms. When Alpha Hunter flags a HIGH confidence reversal signal, check if it aligns with a known liquidity zone.
On-Chain Confirms the Sweep
When you identify a liquidity sweep on the chart:
Check CoinXSight's whale tracking: Are large wallets buying at the sweep low?
Exchange flows: Are coins flowing OFF exchanges (bullish) after the sweep?
Funding rates: Has funding rate gone extremely negative (over-leveraged shorts = fuel for reversal)?
ASI Score Validates the Setup
After identifying an SMC entry, check the ASI Score:
ASI rising during your setup = quantitative confirmation
ASI falling = caution, your SMC read might be wrong
ASI diverging from price = strongest signal
Common SMC Mistakes
1. Trading Against HTF Structure
The #1 mistake: finding a beautiful Order Block on the 15M chart that's against the Daily trend. Always align with the Higher Timeframe bias.
Rule: If Daily is bullish, ONLY take longs. If Daily is bearish, ONLY take shorts. Exceptions require extreme conviction and tighter stops.
2. Every Candle Is NOT an Order Block
A valid Order Block must:
Precede a STRONG impulsive move (not a weak 2-candle bounce)
Create a structural break (BOS or CHoCH)
Have context (near liquidity, near HTF levels)
If you're marking 10 Order Blocks on one chart, you're marking too many. The best charts have 2-3 relevant OBs.
3. Ignoring Mitigation
Order Blocks are one-time-use. If price has already returned to an OB and reacted, that OB is mitigated. Don't expect a second reaction from the same zone.
4. No Confluence
Never trade an Order Block alone. Combine with:
FVG overlap (OB + FVG = highest probability)
Liquidity sweep just occurred
HTF trend alignment
On-chain confirmation via CoinXSight
Volume expansion on the impulse move
5. Wrong Timeframe for Your Style
Trading Style
Entry TF
Structure TF
Bias TF
Scalping
1M-5M
15M
1H-4H
Day trading
5M-15M
1H
4H-Daily
Swing trading
15M-1H
4H
Daily-Weekly
Position trading
1H-4H
Daily
Weekly-Monthly
Smart Money Concepts isn't a crystal ball — it's a lens that reveals the mechanics behind price movement. When you understand that every swing high is a liquidity target, every "support break" is a potential spring, and every impulsive move creates a footprint (Order Block) where institutions entered, the chart starts telling a story that most traders will never read.
Lead Technical Systems Architect·Signals & Metrics Desk
Technical systems developer with a mathematical focus on momentum indicators, volatility metrics (ATR), volume profiles, and multi-timeframe filter models.
QUANTITATIVE SUITE // DEEP ALPHA ENGINEACTIVE
BTC/USDT // LIVE SCANNER
CONFLUENCE 35
LIVE SPOT PRICE$83,025.02NO_TRADE
TP2
$88,788.31
+6.95%
TP1
$85,327.13
+2.78%
ENTRY
$83,019.67
ZONE
SL
$81,865.94
-1.39%
Auto-detect Order Blocks, Fair Value Gaps and risk-adjusted DCA ladders in < 5s.