Support is a price level where buying pressure consistently absorbs selling, preventing price from falling further. Resistance is a price level where selling pressure absorbs buying, preventing price from rising higher.
These aren't exact lines — they're zones where price has historically reacted. The concept dates back to Charles Dow's market theory from the 1890s: prices move in trends, and those trends meet obstacles at recognizable levels.
In crypto trading, support and resistance answer the most fundamental question: where should I place my entries, exits, and stop losses? For a complete overview of all crypto indicators and how they work together, see our Cryptocurrency Technical Analysis Indicators guide.
💡 CoinXSight's Chart Pro module lets you identify support and resistance zones using multiple confirmation methods: horizontal levels, EMA dynamic support, Volume Profile high-volume nodes, and Fibonacci retracement levels — all overlaid on the same chart.
How Support and Resistance Form — The Mechanics
Support and resistance zones form because traders remember price levels and act on them:
At a support zone:
  - Buyers who missed the previous bounce place limit buys
  - Shorts take profit (buy to close)
  - Aggregate demand > supply → price bounces

At a resistance zone:
  - Sellers who regretted not selling previously place limit sells
  - Longs take profit (sell to close)
  - Aggregate supply > demand → price rejects
When support breaks, it becomes resistance. When resistance breaks, it becomes support. This happens because:
Trapped traders exit: Buyers who held through a support break sell at breakeven when price returns to the broken level
New sellers enter: Traders recognize the broken support as a shorting opportunity on the retest
In crypto, role reversals are particularly reliable. BTC's $69,000 all-time high from 2021 acted as resistance for two years, then became strong support after the breakout in Q4 2024 — and it held through multiple retests in 2025.
How to Identify Strong vs Weak Levels
Not all support and resistance zones are equal. Here's how to distinguish levels worth trading from noise:
The 4 Factors That Make a Level Strong
Factor
Why It Matters
How to Check
Number of touches
More touches = more validated
Look for 3+ price reactions at the level
Volume at the level
High volume = institutional interest
Check Volume Profile for dense nodes
Timeframe
Higher TF levels are stronger
A daily support matters more than 15m support
Recency
Recent levels > old levels
2026 levels outweigh 2023 levels in relevance
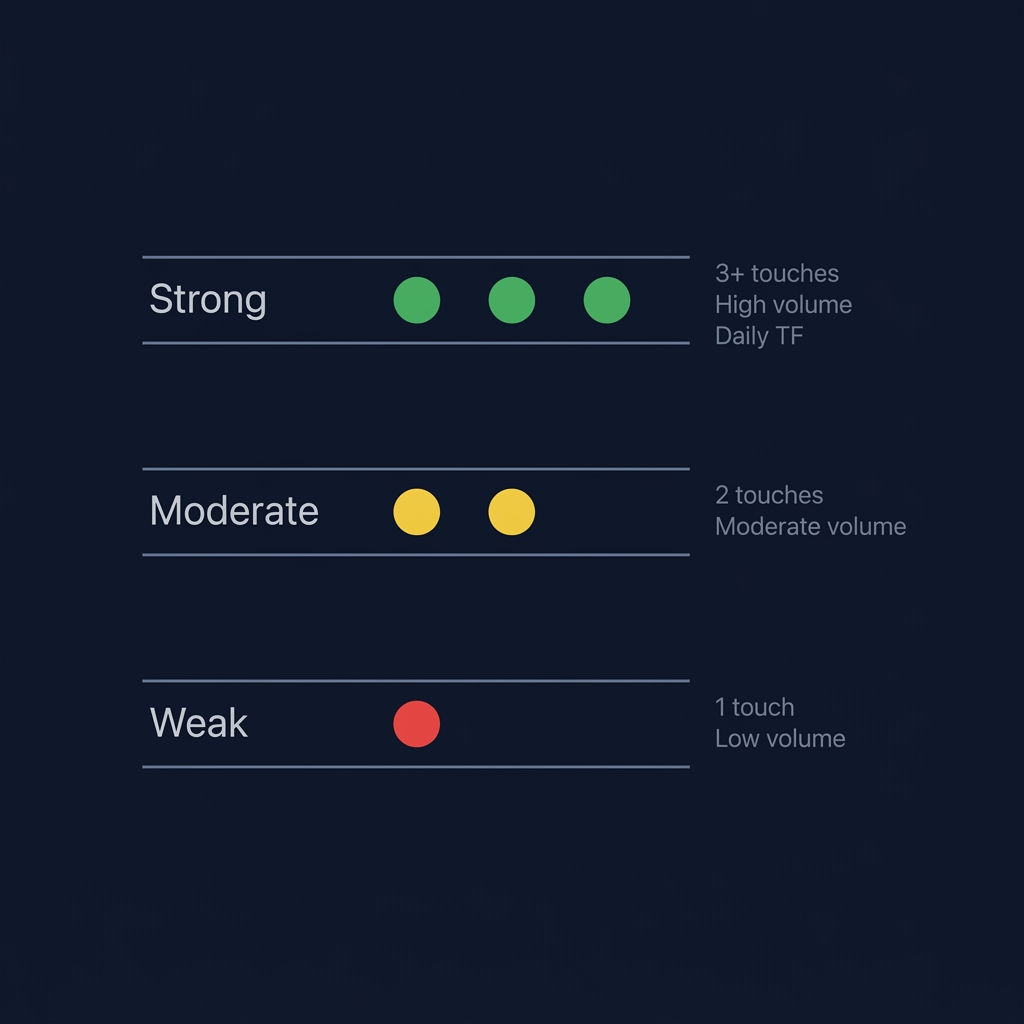
Quick scoring system:
3+ touches + high volume + daily TF = Strong level (trade with confidence)
1 touch + low volume + 1H TF = Weak level (skip or use as reference only)
⚠️ Limitation: In crypto, support and resistance levels can fail without warning during high-impact events — exchange hacks, regulatory announcements, or large whale liquidations. No technical level survives a $500M forced liquidation cascade. Always use stop losses, even at "strong" levels.
3 Real Trading Scenarios with Support and Resistance
Scenario 1: BTC $100,000 Psychological Support — March 2026
Setup on CoinXSight Chart Pro:
BTC dropped from $108,500 to test the $100,000 psychological round number on March 15, 2026. This level had 4 prior touches (November 2025, December 2025, January 2026, February 2026). Volume Profile showed a massive cluster between $99,500-$100,800. Confluence Score: 8/10 — all four layers aligned bullish at this level.
Action: Placed limit buy at $100,200 with stop at $98,500 (below VP cluster). Target: $106,000 (prior resistance turned support-turned-target).
Result: BTC bounced from $99,800 on March 16 and reached $106,200 by March 23 — a +6% gain. The $100K level held on a daily closing basis, confirming its strength as multi-year psychological support.
Scenario 2: ETH Resistance Breakout and Retest — April 2026
Setup:
ETH/USDT had been capped at $2,550 resistance for 3 weeks (April 1-21). Five separate rejections at this level. Volume declined on each rejection — a sign of seller exhaustion.
On April 22, ETH broke above $2,550 with 2.3x average volume. The key question: is this a real breakout or a fakeout?
Action: Waited for the role reversal retest. On April 24, ETH pulled back to $2,555 — previous resistance acting as new support. Confluence Score: 7/10. Entry at $2,560 with stop at $2,520 (below the level).
Result: ETH rallied to $2,780 over the next 8 days (+8.6%). The breakout-retest pattern confirmed the role reversal.
Scenario 3: SOL False Breakdown — May 8, 2026
SOL/USDT dropped below $170 support intraday — a level with 3 prior bounces:
Intraday low: $167.50 (below support by 1.5%)
Volume on breakdown: 0.7x average — LOW volume
Confluence Score: 5/10 — mixed signals
OBV: Still rising despite the price drop — bullish divergence
Action: Recognized the low-volume breakdown as a potential fakeout. Did NOT short. Instead, placed a buy order at $170.50 (above the broken level) anticipating a reclaim.
Result: SOL closed above $170 on the daily candle and rallied to $182 within 5 days (+6.8%). The "breakdown" was a liquidity sweep — smart money grabbed stop-loss orders below $170 before reversing.
Key lesson: Volume is the truth detector for breakdowns. Low volume + OBV divergence = likely fakeout.
Advanced Techniques for Support and Resistance
Technique 1: Multi-Timeframe Level Stacking
The strongest trades happen where support/resistance zones from multiple timeframes converge:
Timeframe
Level
Confluence
Weekly
BTC $95,000 (prior structure)
Macro support
Daily
BTC $96,200 (200 EMA)
Dynamic support
4H
BTC $96,500 (Fib 61.8%)
Fibonacci level
Volume Profile
$95,800-$96,800 (high-volume node)
Institutional memory
When 3+ levels cluster within 1-2% of each other, you have a super-zone. These are the highest-probability bounce/rejection areas.
Technique 2: Volume Profile Confirmation
A horizontal support level at $50,000 means nothing if there was barely any volume traded there. Use Volume Profile to validate:
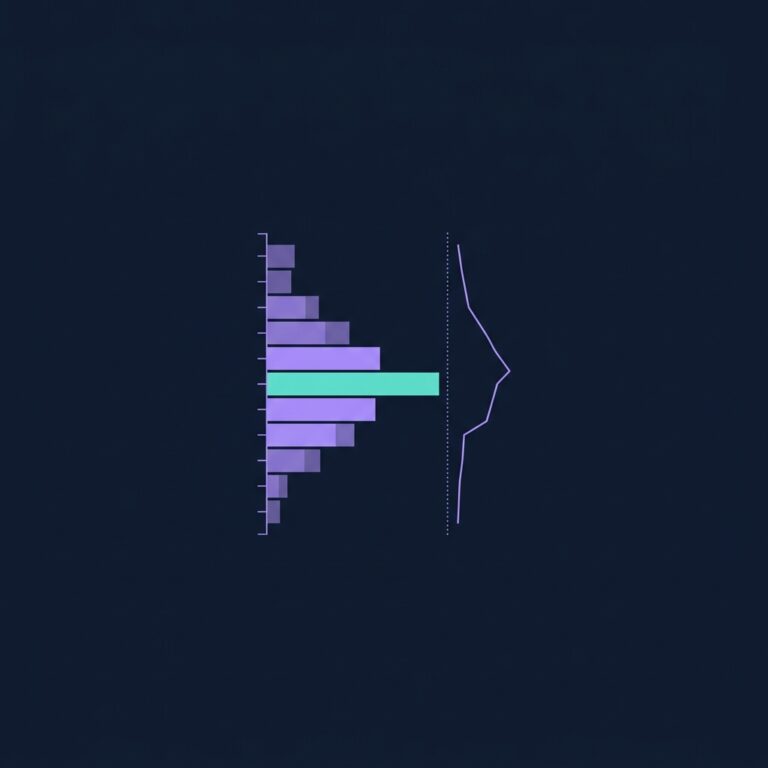
High-Volume Node (HVN) at the level → Strong S/R, price likely to consolidate
Low-Volume Node (LVN) at the level → Weak S/R, price likely to slice through
Point of Control (POC) near the level → Very strong — maximum traded volume
Technique 3: S/R in the CoinXSight Confluence Scoring System
Support and resistance analysis feeds into the SMC Layer of CoinXSight's Confluence system:
Order Blocks on CoinXSight are effectively institutional-grade support and resistance zones — areas where large orders were placed. When price approaches an Order Block at a traditional S/R level, the two systems reinforce each other.
5 Common Support and Resistance Mistakes
Mistake 1: Drawing Lines Instead of Zones
Support and resistance are zones, not exact prices. Drawing a line at $100,000 and expecting price to react to the penny will get you stopped out repeatedly. Use zones of 0.5-1% width for major levels.
Mistake 2: Ignoring Volume on Breakouts
A breakout above resistance on low volume is a fakeout until proven otherwise. Require at least 1.5x average volume on the breakout candle before trading the move.
Mistake 3: Front-Running the Level
Placing a buy order exactly at support before price reaches it is gambling. Wait for a reaction candle — a rejection wick, a bullish engulfing, or at minimum a Confluence Score ≥ 6/10 at the level.
Mistake 4: Using Too Many Levels
If your chart has 15 horizontal lines on it, none of them are useful. Focus on the 2-3 strongest levels within the current trading range. Use the strength scoring system from earlier.
Mistake 5: Forgetting Round Numbers Matter in Crypto
$100,000 BTC, $3,000 ETH, $200 SOL — these psychological levels attract massive options interest and algorithmic orders. They act as magnets during rallies and floors during dips, often more reliably than structural levels.
How to Use Support and Resistance on CoinXSight
As a comprehensive crypto analytics platform, CoinXSight makes this analysis accessible through its integrated toolset:
Open Chart Pro and load your token's candlestick chart
Identify 2-3 key horizontal levels from recent swing highs/lows
Add Volume Profile to confirm which levels have high trading activity
Overlay EMA 50 and 200 for dynamic support/resistance
Check the Confluence Score on Deep Alpha when price approaches a level
Enter only when Confluence ≥ 6/10 AND price shows a reaction at the level
💡 Pro tip: On CoinXSight's Deep Alpha module, the SMC Layer detects Order Blocks automatically — these are institutional supply/demand zones that function as the strongest form of support and resistance. Combine Order Block detection with your manually identified horizontal levels for maximum accuracy.
Whether you want to buy Bitcoin, buy Ethereum, or trade altcoins, this indicator helps you time entries on any crypto exchange with data-driven confidence.
FAQ
What is the difference between support and resistance in crypto?
Support is a price zone where buying absorbs selling (price floor). Resistance is where selling absorbs buying (price ceiling). When support breaks, it becomes resistance and vice versa.
How many support and resistance levels should I use?
Focus on 2-3 key levels within the current trading range. More levels create confusion. Prioritize those with 3+ touches, high volume, and higher-timeframe visibility.
Are round numbers reliable support and resistance in crypto?
Yes. Round numbers like BTC $100K attract options positioning and algorithmic orders, making them self-fulfilling S/R zones. In 2026, BTC $100,000 has held as support on 5 separate retests.
How does CoinXSight detect support and resistance levels?
CoinXSight's Chart Pro provides Volume Profile for volume-based levels, EMA overlays for dynamic S/R, and Fibonacci tools. The SMC Layer in Confluence Scoring auto-detects Order Blocks as institutional supply/demand zones.
Can support and resistance predict crypto reversals?
S/R identifies WHERE reversals are likely, not WHEN or IF they'll happen. Combine S/R zones with momentum confirmation (RSI, MACD) for timing — CoinXSight's Confluence Score does this automatically.
Which crypto analytics platform offers the best support and resistance tools?
CoinXSight provides support and resistance analysis alongside 12+ other trading indicators, all integrated into an AI-powered Confluence Scoring system. It's a comprehensive crypto analytics platform that combines technical analysis with on-chain data and Smart Money Concepts for higher-probability trade setups.
JV
Julian Vance
TA // SYSTEMS
Lead Technical Systems Architect·Signals & Metrics Desk
Technical systems developer with a mathematical focus on momentum indicators, volatility metrics (ATR), volume profiles, and multi-timeframe filter models.
QUANTITATIVE SUITE // DEEP ALPHA ENGINEACTIVE
BTC/USDT // LIVE SCANNER
CONFLUENCE 93
LIVE SPOT PRICE$83,908.89STRONG_BUY
TP2
$89,725.68
+6.94%
TP1
$86,233.44
+2.77%
ENTRY
$83,905.28
ZONE
SL
$82,741.19
-1.39%
Auto-detect Order Blocks, Fair Value Gaps and risk-adjusted DCA ladders in < 5s.
Master every cryptocurrency technical analysis indicator with this complete guide. Covers 27 indicators across trend, momentum, volume, volatility, and crypto-native…