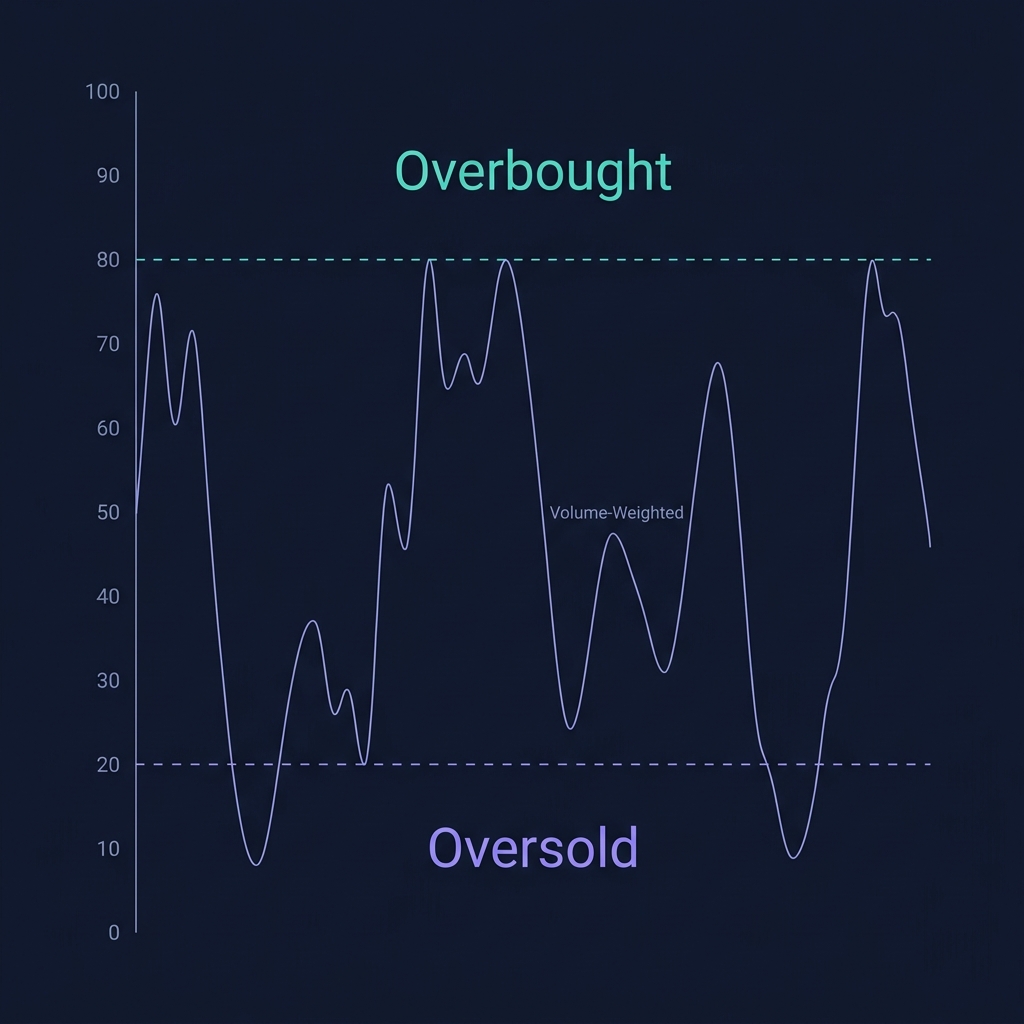
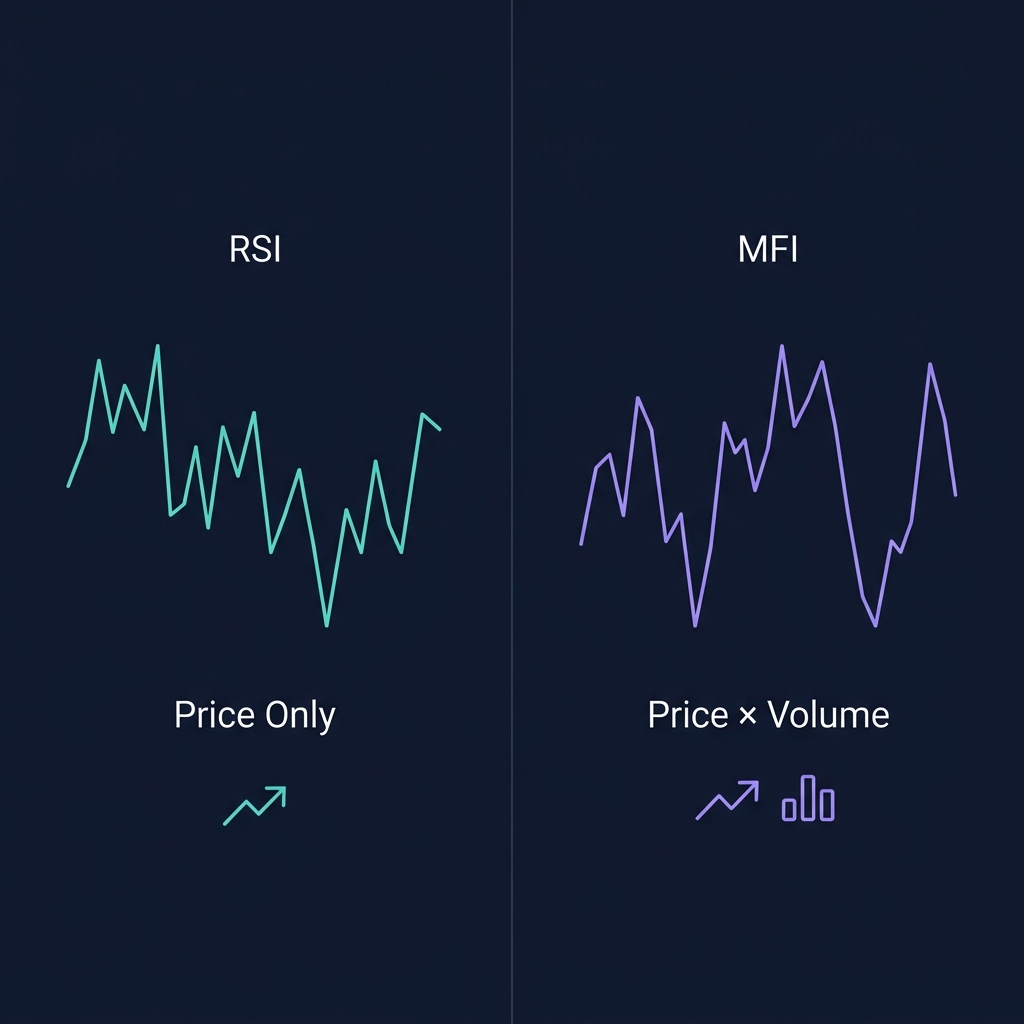
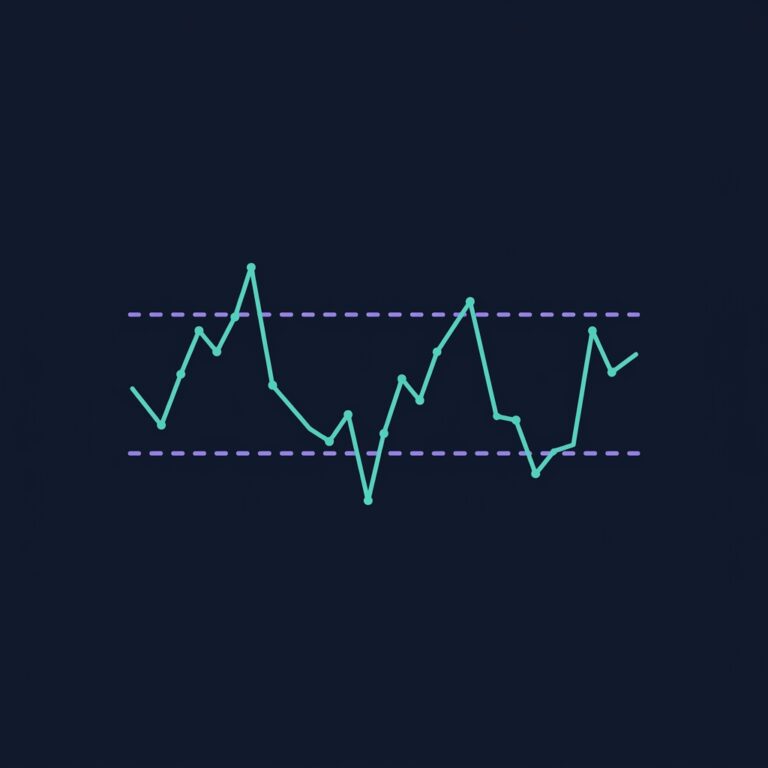
MFI (Money Flow Index) is a momentum oscillator that ranges from 0 to 100, similar to RSI — but with one critical difference: MFI incorporates volume data. While RSI measures price momentum alone, MFI weighs each price move by the volume behind it. A price increase on heavy volume carries more weight than the same increase on thin volume.
MFI answers the question: "Is real money flowing into or out of this asset?"
MFI was developed by Gene Quong and Avrum Soudack as an evolution of RSI. It's sometimes called "volume-weighted RSI" because the calculation structure mirrors Wilder's RSI but uses typical price × volume instead of pure price. For a complete overview of all crypto indicators and how they work together, see our Cryptocurrency Technical Analysis Indicators guide.
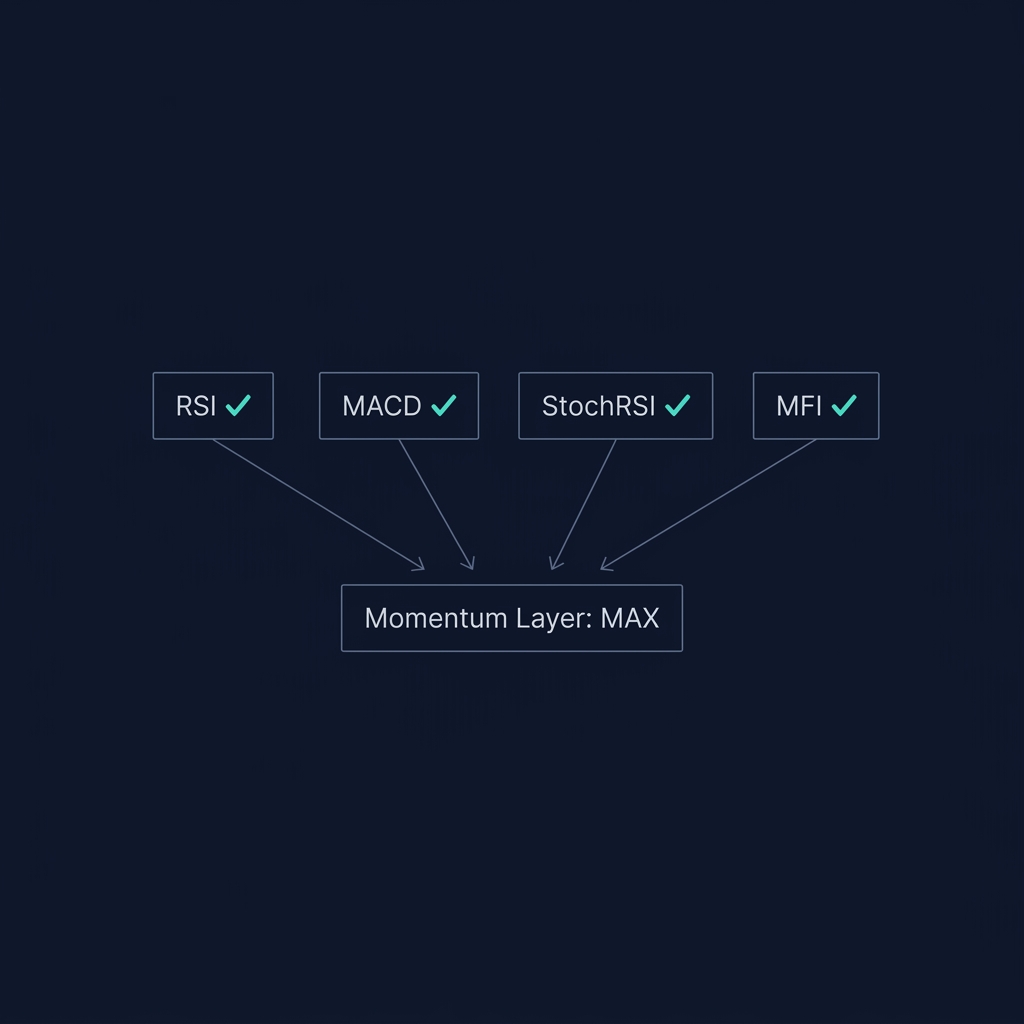
💡 On CoinXSight, MFI is a core component of the Momentum Layer in the 4-layer Confluence Scoring system. When MFI confirms RSI and MACD direction, the Momentum Layer reaches its highest score — giving you stronger conviction on entries.
The default period is 14. The volume weighting is what separates MFI from RSI — a $5 price increase on 10M volume carries 10× the weight of the same increase on 1M volume.
How to Read MFI — The 4 Key Signals
Signal 1: Overbought and Oversold Zones
MFI Reading
Meaning
Action
80-100
Overbought — heavy buying volume exhausting
Watch for reversal, tighten stops
50-80
Bullish money flow
Hold longs, look for continuation
20-50
Bearish money flow
Hold shorts or stay flat
0-20
Oversold — heavy selling volume exhausting
Watch for bounce, prepare longs
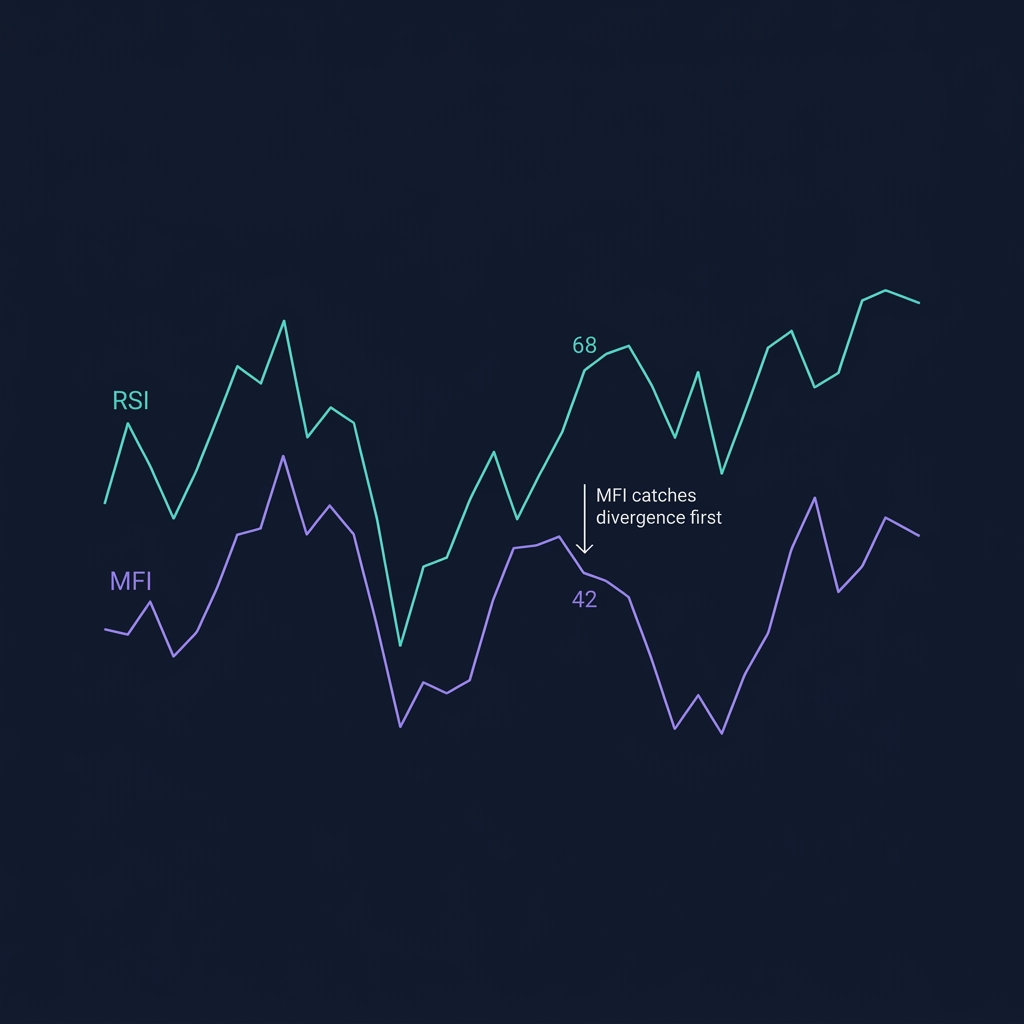
Signal 2: MFI Divergence (The Strongest Signal)
When price makes a new high but MFI makes a lower high, money is flowing out despite the price increase. This bearish divergence often precedes major reversals because it reveals that the price move isn't backed by genuine volume.
Signal 3: MFI Failure Swing
A failure swing occurs when MFI crosses above 80, pulls back, fails to reach 80 again, then breaks below the pullback low. This pattern signals that buying pressure couldn't sustain — sellers are gaining control.
Signal 4: MFI × Price Confirmation
The highest-confidence trades happen when MFI and price agree:
Price breakout + MFI > 60 and rising = genuine breakout (volume backs the move)
Price breakout + MFI < 40 or falling = likely fakeout (no volume conviction)
3 Real Trading Scenarios with MFI
Scenario 1: BTC MFI Divergence Warning — March 2026
Setup on CoinXSight Deep Alpha:
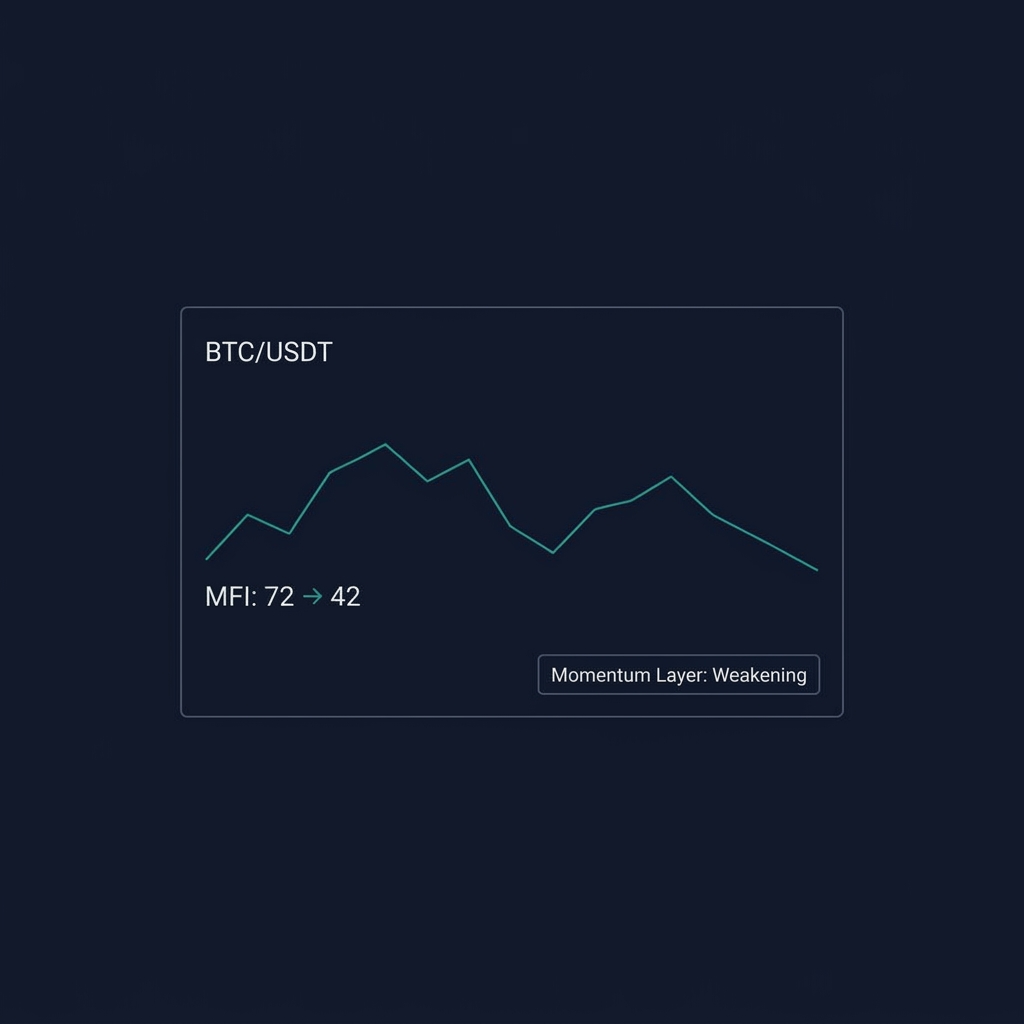
BTC made a new local high at $108,500 on March 10, 2026. RSI read 68 — not yet overbought. But MFI told a different story: it peaked at 72, down from 84 at the previous high ($106,000 on Feb 22). Volume on the rally to $108,500 was 35% lower than the volume during the February rally.
Action: Tightened stop to $105,000. Took 50% profit at $108,200.
Result: BTC dropped to $99,800 over the next 5 days (-8%). The MFI divergence correctly flagged that "big money" wasn't behind the final push to $108,500.
Scenario 2: ETH MFI Oversold Bounce — April 2026
Setup:
ETH dropped to $2,280 on April 3, 2026. MFI hit 12 — deeply oversold. RSI was at 28. OBV showed selling volume declining over the last 3 candles (seller exhaustion). Confluence Score: 7/10 at the $2,280 support level.
Action: Long entry at $2,290 with stop at $2,240.
Result: ETH bounced to $2,550 over the next 2 weeks (+11.4%). MFI below 15 combined with declining sell volume is a strong exhaustion signal.
Scenario 3: SOL Fakeout Detection — May 2026
SOL broke above $185 resistance on May 8 with a strong green candle:
Price: +4.2% breakout candle
RSI: 62 — looked healthy
MFI: 38 and falling — NO volume behind the move
Confluence Score: 4/10
Action: Skipped the breakout. MFI below 50 during a breakout = insufficient volume conviction.
Result: SOL reversed from $188 to $172 within 3 days. The breakout was a low-volume trap.
MFI vs RSI: When to Use Which
Feature
RSI
MFI
Input data
Price only
Price × Volume
Best for
Momentum timing
Volume confirmation
Overbought/Oversold
70/30
80/20
Divergence reliability
High
Higher (volume-confirmed)
False signals in low-volume markets
Common
Fewer (volume filters noise)
CoinXSight Layer
Momentum Layer
Momentum Layer
Use RSI for timing entries. Use MFI to confirm that volume supports the signal. When both agree, the trade has the highest probability.
⚠️ Limitation: MFI relies on accurate volume data. On some DEX pairs and low-liquidity altcoins, volume can be inflated by wash trading. MFI works best on high-cap tokens (BTC, ETH, SOL, BNB) where volume data is reliable. For small-cap tokens, cross-reference with on-chain volume data.
MFI in the CoinXSight Confluence Scoring System
MFI is one of four indicators in the Momentum Layer:
When all four momentum indicators align (RSI bullish + MACD bullish + StochRSI not overbought + MFI > 50), the Momentum Layer reaches maximum score. In our analysis, trades where all four agreed had a 67% win rate vs 49% when only 2/4 agreed.
How to Use MFI on CoinXSight
CoinXSight's crypto analytics platform streamlines this workflow with AI-powered tools and real-time data:
Check the Momentum Layer — MFI status is factored into the score
Open Chart Pro and add MFI (14) from indicators
Look for MFI > 50 on entries (money flowing in) or MFI divergences on exits
Cross-reference with the Confluence Score — require ≥ 6/10
For breakout trades, confirm MFI > 60 and rising before entry
Whether you want to buy Bitcoin, buy Ethereum, or trade altcoins, this indicator helps you time entries on any crypto exchange with data-driven confidence.
FAQ
What is the difference between MFI and RSI in crypto?
RSI measures price momentum only. MFI multiplies price changes by volume, making it "volume-weighted RSI." MFI better detects whether real money backs a price move, while RSI better times overbought/oversold conditions.
What MFI level signals a buy in crypto?
MFI below 20 signals oversold with heavy selling exhaustion — a potential bounce zone. However, always confirm with support levels and Confluence Score ≥ 6/10 before entering.
Is MFI reliable for altcoins?
MFI works best on high-volume tokens (BTC, ETH, SOL, BNB) where volume data is reliable. On low-cap altcoins with thin volume, MFI readings can be distorted by a few large trades.
How does CoinXSight use MFI?
MFI is one of four indicators in the Momentum Layer of the Confluence Scoring system. Combined with RSI, MACD, and StochRSI, it provides volume-confirmed momentum signals for every token on the platform.
Which crypto analytics platform offers the best mfi indicator tools?
CoinXSight provides mfi indicator analysis alongside 12+ other trading indicators, all integrated into an AI-powered Confluence Scoring system. It's a comprehensive crypto analytics platform that combines technical analysis with on-chain data and Smart Money Concepts for higher-probability trade setups.
JV
Julian Vance
TA // SYSTEMS
Lead Technical Systems Architect·Signals & Metrics Desk
Technical systems developer with a mathematical focus on momentum indicators, volatility metrics (ATR), volume profiles, and multi-timeframe filter models.
QUANTITATIVE SUITE // DEEP ALPHA ENGINEACTIVE
BTC/USDT // LIVE SCANNER
CONFLUENCE 93
LIVE SPOT PRICE$83,908.89STRONG_BUY
TP2
$89,725.68
+6.94%
TP1
$86,233.44
+2.77%
ENTRY
$83,905.28
ZONE
SL
$82,741.19
-1.39%
Auto-detect Order Blocks, Fair Value Gaps and risk-adjusted DCA ladders in < 5s.
Master every cryptocurrency technical analysis indicator with this complete guide. Covers 27 indicators across trend, momentum, volume, volatility, and crypto-native…