Crypto Technical Analysis for Beginners: The Complete Guide to Reading Charts, Indicators & Making Your First Trade
Learn crypto technical analysis from zero — how to read candlestick charts, identify trends, use RSI, MACD, EMA, spot chart patterns, and build a 7-step analysis process. Free illustrated guide for 2026.
MC
Marcus ChenSenior Quantitative Strategist·Jun 2, 2026 · 22 min read · Updated Oct 6
What Is Crypto Technical Analysis — and Why Should You Learn It?
Technical analysis (TA) is a method of predicting where a cryptocurrency's price might go next by studying its past price movements, trading volume, and chart patterns. It does not care about a project's team, roadmap, or technology — it only cares about what the chart says about supply, demand, and trader behavior.
The approach rests on three core principles first established by Charles Dow over a century ago:
Principle
What It Means
Price discounts everything
All publicly known information — news, partnerships, regulations — is already reflected in the current price
Price moves in trends
Once a direction begins, it tends to continue until a clear reversal signal appears
History tends to repeat
Traders react to similar chart setups in predictable, recurring patterns
Why does this matter for crypto specifically? Crypto markets run 24 hours a day, 7 days a week, across thousands of exchanges. A token can pump 50% on Monday and crash 30% by Wednesday. Without a structured framework to interpret price action, every buy or sell decision becomes a coin flip.
Technical analysis gives you a system to answer four questions before every trade:
Trend — Is this asset going up, down, or sideways right now?
Entry — At what price level should I buy (or sell)?
Exit — Where do I take profit or cut my loss?
Risk — How much can I afford to lose if I'm wrong?
If you already understand these basics and want a deeper framework with AI-powered strategies, see our advanced 2026 TA guide. This article is for people starting from zero.
Glossary: Quick Abbreviations Guide
Before diving in, here is a quick reference table of abbreviations used throughout this guide and the wider trading community:
Abbreviation
Full Term
Plain English Meaning
HH / HL
Higher High / Higher Low
Peaks and pullbacks are ascending (Bullish trend)
LH / LL
Lower High / Lower Low
Peaks and pullbacks are descending (Bearish trend)
BOS
Break of Structure
When price breaks past a previous high/low to continue the trend
CHoCH
Change of Character
First sign of a trend reversing (breaking structure in the opposite direction)
S / R
Support / Resistance
Price floors (buyers step in) and ceilings (sellers defend)
R:R
Risk-Reward Ratio
The ratio of potential gain to potential loss in a trade setup
Part 1: Reading Your First Crypto Chart
Types of Charts
Most crypto platforms offer three chart styles:
Chart Type
Visual
Best For
Line chart
A simple line connecting closing prices
Quick glance at overall direction
Bar chart
Vertical bars showing open, high, low, close
Traders who want detail without visual clutter
Candlestick chart
Color-coded bodies with wicks
The standard for crypto trading — most information in the most intuitive format
For the rest of this guide, we use candlestick charts exclusively. If you learn to read candlesticks, you can read any chart.
Anatomy of a Candlestick
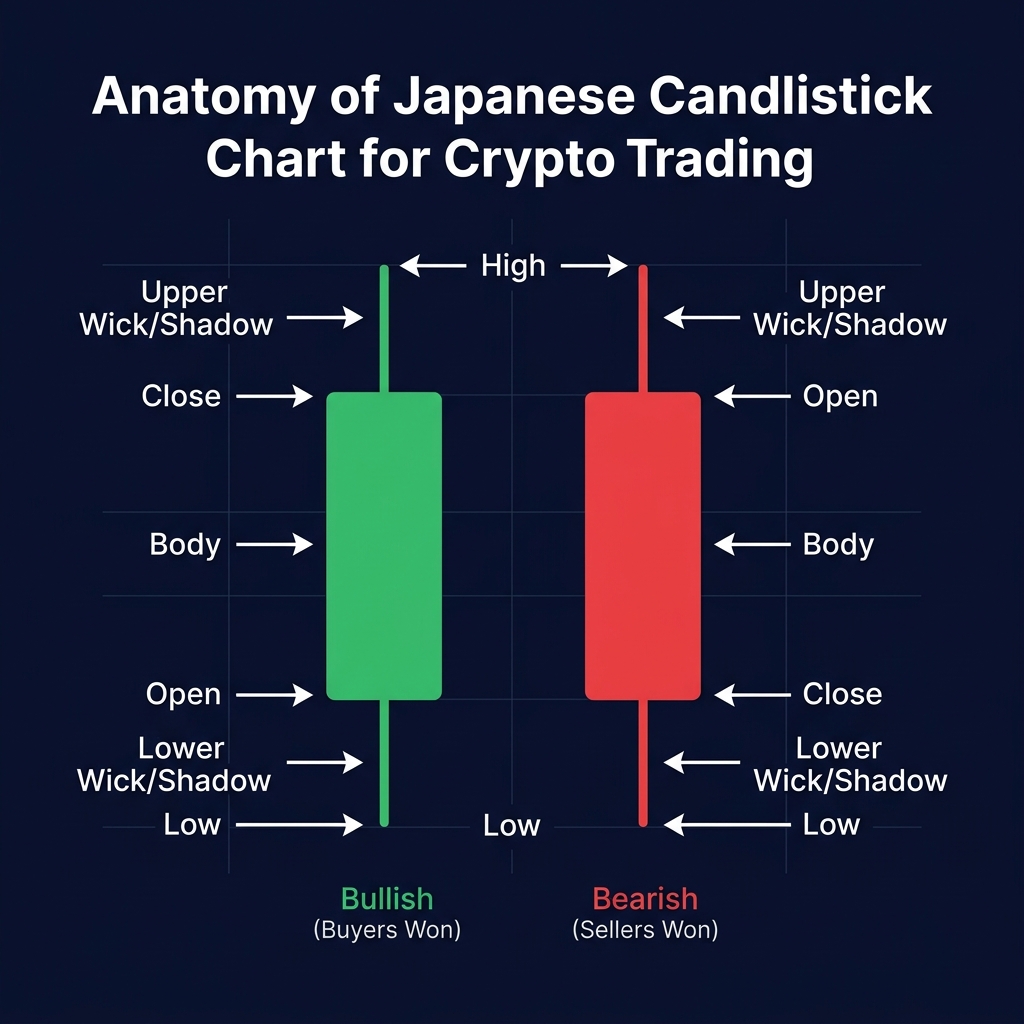
Each candlestick represents one time period (1 minute, 1 hour, 1 day — you choose) and packs four data points into a single visual element:
Part
What It Shows
Body
The thick colored section. Represents the range between the opening price and closing price
Upper wick (shadow)
The thin line above the body. Shows the highest price reached during this period
Lower wick (shadow)
The thin line below the body. Shows the lowest price reached during this period
Green candle
Close is higher than open — buyers controlled this period
Red candle
Close is lower than open — sellers controlled this period
What the wicks tell you: Long wicks signal rejection. A long upper wick means price tried to go higher but was pushed back down — sellers defended that level. A long lower wick means price tried to go lower but bounced — buyers stepped in. These rejection signals are often more important than the body itself.
The timeframe determines how much time each candle represents. Your choice should match your trading style:
Timeframe
Each Candle =
Best For
Signal Quality
1 minute
1 minute
Scalping (very advanced)
Low — extremely noisy
15 minutes
15 minutes
Day trading
Moderate
1 hour
1 hour
Short-term swing trades
Moderate-High
4 hours
4 hours
Swing trading (recommended for beginners)
High
1 day
1 day
Position trading / investing
Very High
1 week
1 week
Long-term investing
Highest
Beginner recommendation: Start with the 4-hour (4H) and daily (1D) charts. Lower timeframes (1m, 5m, 15m) generate too many false signals and pressure you into impulsive decisions. Higher timeframes give you more time to think and produce more reliable patterns.
For multi-timeframe strategies, our Multi-Timeframe Analysis guide explains how to combine two timeframes for higher-probability entries.
Part 2: The 6 Essential Concepts
These six concepts form the foundation of every technical analysis strategy. Master them before moving to anything else.
1. Trends — The Single Most Important Concept
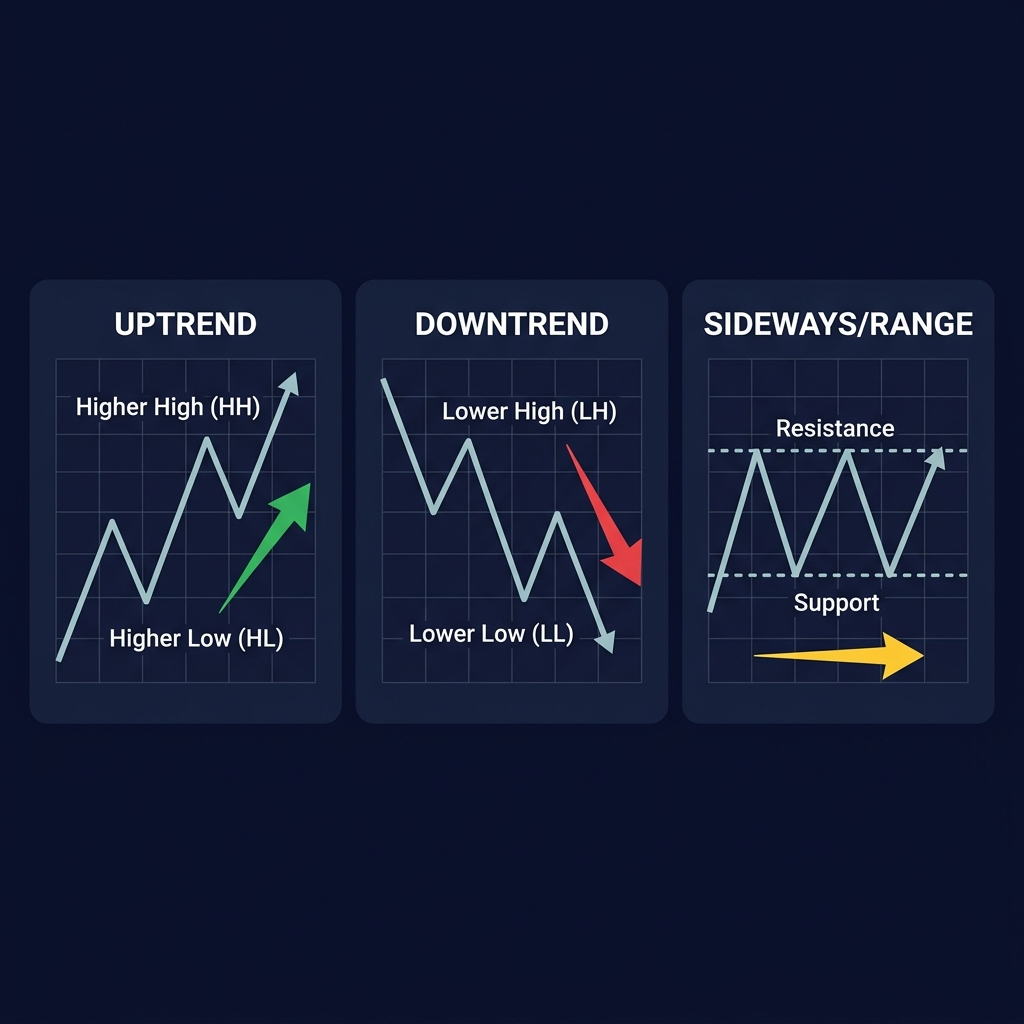
Before looking at any indicator, answer one question: is price making higher highs and higher lows, or lower highs and lower lows?
Trend
Structure
What to Do
Uptrend
Higher Highs (HH) + Higher Lows (HL)
Look for buying opportunities on pullbacks
Downtrend
Lower Highs (LH) + Lower Lows (LL)
Avoid buying, or look for short setups
Sideways (Range)
Price bouncing between horizontal levels
Trade the range boundaries, or wait for a breakout
The golden rule of trading: trade WITH the trend, not against it. Trying to catch the exact bottom of a downtrend or the exact top of an uptrend is how most beginners lose money. Wait for the trend to confirm, then join it.
Two key terms to know:
Break of Structure (BOS) — price breaks a previous swing high (in an uptrend) or swing low (in a downtrend), confirming the trend continues
Change of Character (CHoCH) — price breaks structure in the OPPOSITE direction for the first time, warning that the trend may be reversing
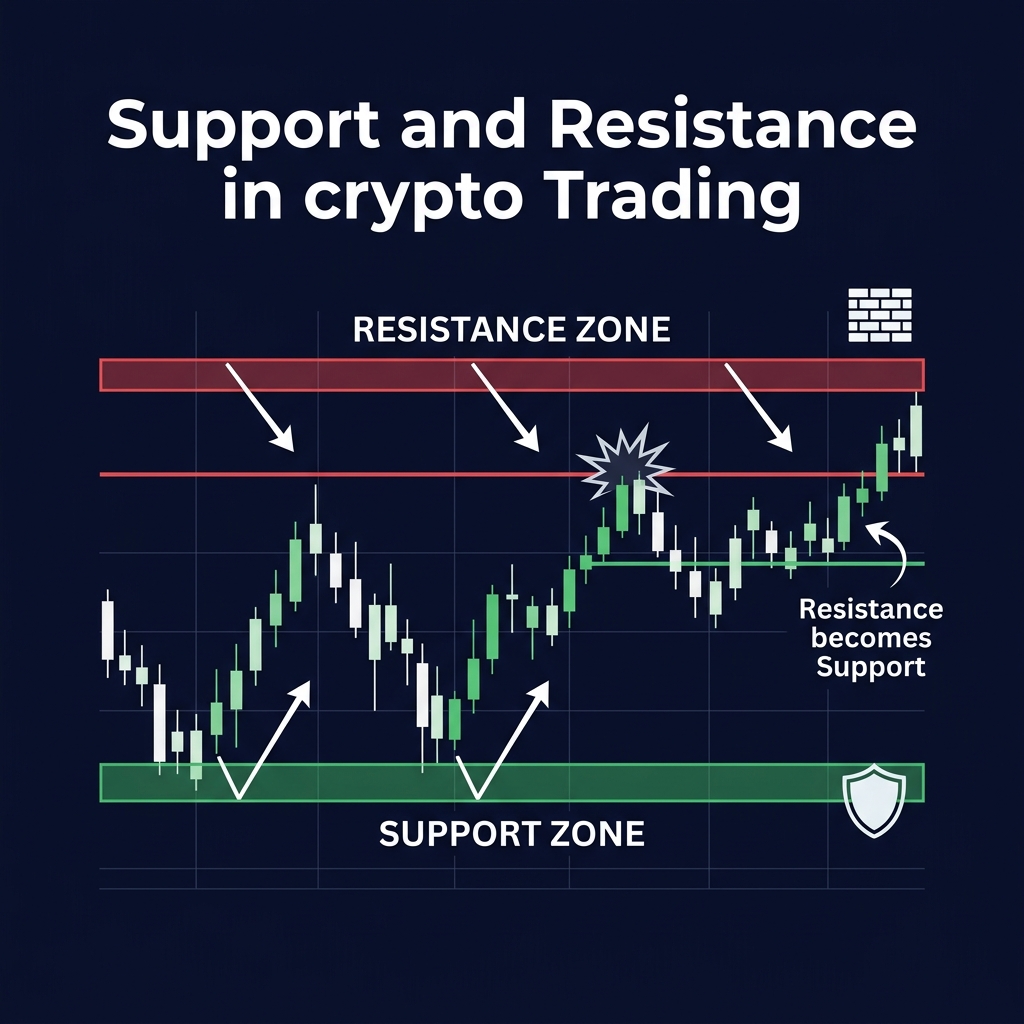
Support and resistance are price levels where the market repeatedly changes direction:
Concept
Definition
How to Find It
Support
A price zone where buying pressure consistently prevents further decline
Look for levels where price has bounced UP at least 2-3 times
Resistance
A price zone where selling pressure consistently prevents further advance
Look for levels where price has been rejected DOWN at least 2-3 times
The flip rule: When price breaks above resistance, that old resistance often becomes new support — and vice versa. This "flip" mechanism is the foundation of breakout and pullback trading strategies.
Why "zones" not "lines": In practice, support and resistance are not exact prices — they are zones (ranges). Price rarely bounces from the exact same dollar amount twice. Think of them as areas of interest where many orders cluster.
Our Support and Resistance guide covers advanced techniques including volume-based S/R identification and institutional order flow zones.
3. Volume — The Conviction Meter
Volume measures how many units of a cryptocurrency changed hands during a time period. It answers one critical question: how much conviction is behind this price move?
Price + Volume Combo
What It Means
Reliability
Price rising + Volume rising
Strong uptrend — genuine buying interest
High ✅
Price rising + Volume falling
Rally losing steam — buyers disappearing
Warning ⚠️
Price dropping + Volume spiking
Panic selling / capitulation — watch for reversal
Potential bottom 🔄
Price dropping + Volume falling
Weak sell-off — may continue drifting
Low conviction
Breakout + 2x average volume
Genuine breakout — likely to hold
Very High ✅✅
Breakout + below average volume
Likely fake breakout — expect reversal
Unreliable ❌
The breakout rule: Never trust a breakout that isn't confirmed by volume. If price breaks above a resistance level but volume is below its 20-period average, there's a high probability that breakout will fail and price will reverse back below resistance.
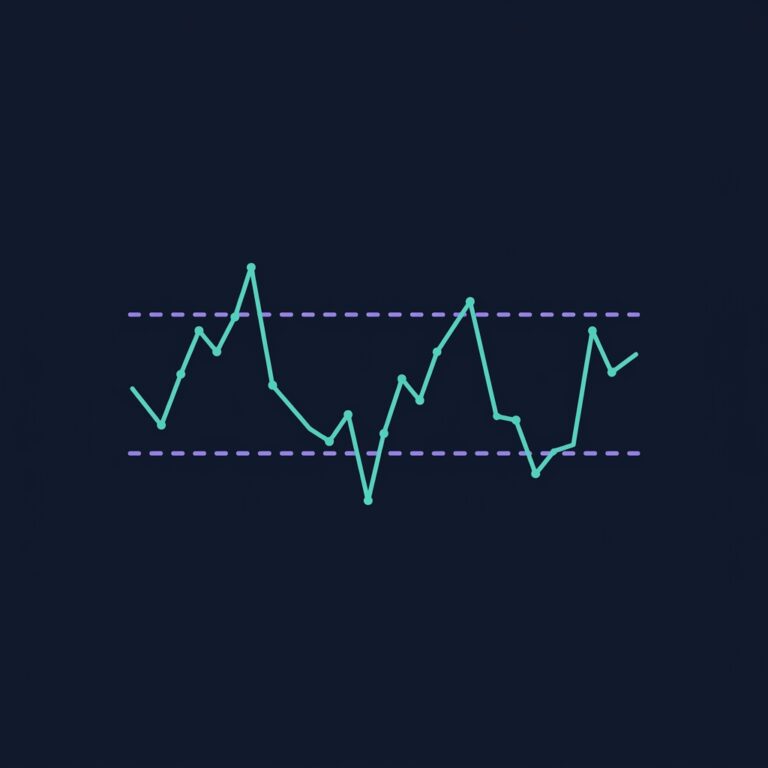
4. RSI (Relative Strength Index) — Your Momentum Check
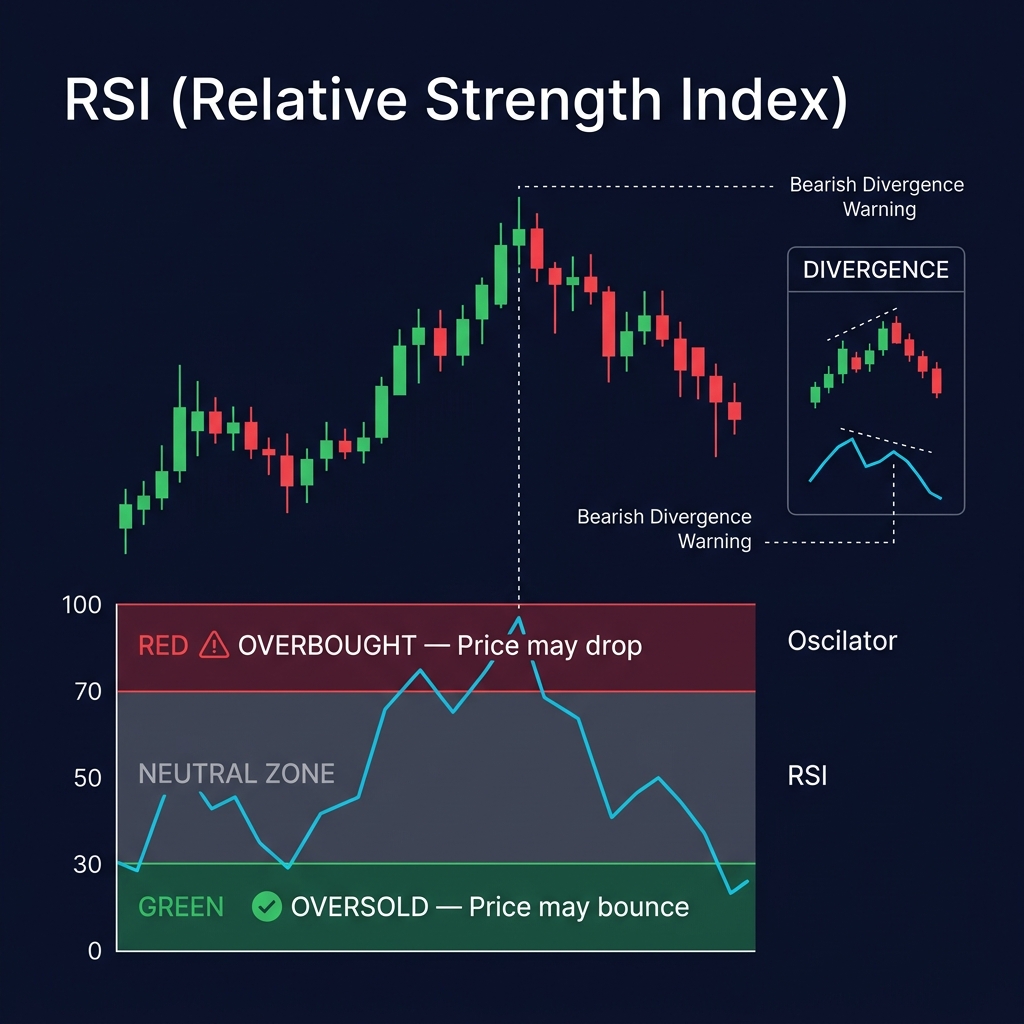
RSI is a momentum oscillator that measures the speed and magnitude of recent price changes on a scale from 0 to 100. It was developed by J. Welles Wilder Jr. in 1978 and remains one of the most widely used indicators in crypto.
RSI Zone
Reading
Interpretation
Overbought
Above 70
Price may have risen too fast — a pullback could follow
Neutral
Between 30 and 70
No extreme momentum — no signal
Oversold
Below 30
Price may have dropped too far — a bounce could follow
Critical caveat: In strong trends, RSI can stay overbought or oversold for weeks. Bitcoin's RSI remained above 70 for over three weeks during its November 2024 rally from $68K to $99K. Using RSI=70 as an automatic sell signal during a powerful uptrend would have cost you massive profits.
The real power of RSI: Divergence
Overbought and oversold levels are useful but basic. The advanced (and more reliable) use of RSI is divergence detection:
Bullish divergence: Price makes a new LOW, but RSI makes a HIGHER low → selling momentum is weakening even as price drops → potential reversal UP
Bearish divergence: Price makes a new HIGH, but RSI makes a LOWER high → buying momentum is fading even as price rises → potential reversal DOWN
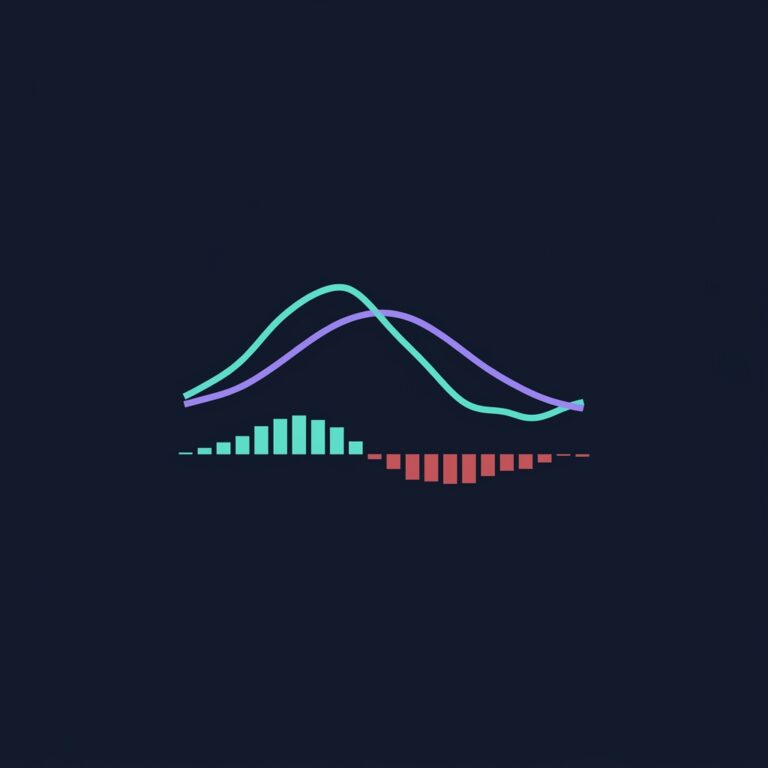
MACD tracks both trend direction and momentum strength by comparing two exponential moving averages. Created by Gerald Appel, it consists of three components:
MACD Line = EMA(12) - EMA(26)
Signal Line = EMA(9) of MACD Line
Histogram = MACD Line - Signal Line
How to read MACD:
Signal
What Happened
Meaning
MACD Line crosses ABOVE Signal Line
Bullish crossover
Upward momentum is building — potential buy signal
MACD Line crosses BELOW Signal Line
Bearish crossover
Downward momentum is building — potential sell signal
Histogram bars growing taller
Momentum accelerating
The current move is getting stronger
Histogram bars shrinking
Momentum fading
The current move may be losing steam
MACD above zero line
Price is above the longer-term average
Generally bullish conditions
MACD below zero line
Price is below the longer-term average
Generally bearish conditions
MACD + RSI together: These two indicators complement each other well. RSI tells you "how extreme is the current momentum?" while MACD tells you "is momentum accelerating or decelerating, and in which direction?" When both agree — for example, RSI showing bullish divergence AND MACD making a bullish crossover — the signal is significantly more reliable.
6. Moving Averages (EMA & SMA) — The Trend Compass
A moving average smooths out price noise by averaging prices over a set number of periods. It shows you the underlying trend direction when individual candles are too chaotic to interpret.
Type
Calculation
Responsiveness
SMA (Simple Moving Average)
Average of the last N closing prices, all weighted equally
Slower — less reactive to recent moves
EMA (Exponential Moving Average)
Weighted average giving more importance to recent prices
Faster — reacts more quickly to price changes
The three EMAs that matter:
EMA
Period
What It Shows
Short-term
20 or 34
Current momentum direction
Medium-term
50 or 89
Swing trend — intermediate direction
Long-term
200
The macro trend — the "big picture"
How to use moving averages:
Trend filter: If price is above the 200 EMA, the macro trend is bullish. If below, it's bearish. This single filter prevents you from buying in a bear market.
Dynamic support/resistance: In an uptrend, price often pulls back to the 50 EMA and bounces. The EMA acts as a "moving floor" under price.
Golden Cross / Death Cross:
Golden Cross = 50 EMA crosses ABOVE 200 EMA → long-term bullish signal
Death Cross = 50 EMA crosses BELOW 200 EMA → long-term bearish signal
EMA ribbon alignment: When short, medium, and long-term EMAs are fanned out in order (20 > 50 > 200 and all rising), the trend is strongly bullish. When they compress and tangle, the market is indecisive.
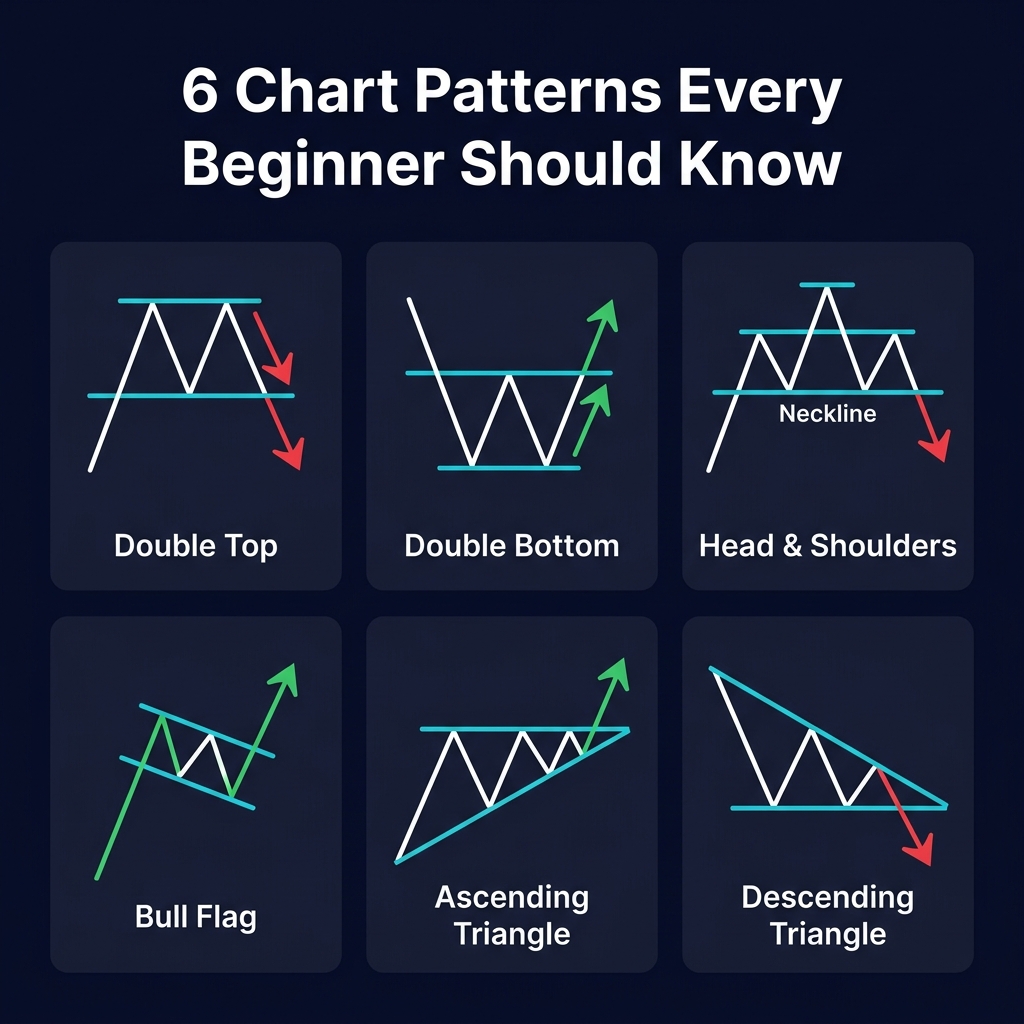
Chart patterns are recurring shapes that form on price charts. They represent predictable shifts in the balance between buyers and sellers.
Reversal Patterns (Signal a Trend Change)
Pattern
Shape
Signal
How to Confirm
Double Top
"M" shape — two peaks at roughly the same level
Bearish reversal (uptrend ending)
Price breaks below the neckline (the valley between the two peaks) on high volume
Double Bottom
"W" shape — two troughs at roughly the same level
Bullish reversal (downtrend ending)
Price breaks above the neckline on high volume
Head & Shoulders
Three peaks — middle peak (head) highest, two lower peaks (shoulders)
Bearish reversal
Price breaks below the neckline connecting the two troughs
Inverse Head & Shoulders
Mirror of above — three troughs, middle deepest
Bullish reversal
Price breaks above the neckline
Continuation Patterns (Signal the Trend Will Resume)
Pattern
Shape
Signal
How to Confirm
Bull Flag
Sharp move up (flagpole) → small downward channel (flag)
Bullish continuation
Price breaks above the upper boundary of the flag on increasing volume
Bear Flag
Sharp move down → small upward channel
Bearish continuation
Price breaks below the lower boundary
Ascending Triangle
Flat top resistance + rising bottom trendline
Usually bullish
Breakout above flat resistance with 2x average volume
Descending Triangle
Flat bottom support + falling top trendline
Usually bearish
Breakdown below flat support
Symmetrical Triangle
Converging trendlines (lower highs + higher lows)
Either direction
Watch which side breaks first — trade the breakout direction
Pattern win rates in 2026: Not all patterns are equal. In today's institutional-driven crypto market, continuation patterns like bull flags tend to have higher success rates (65-75%) than reversal patterns (55-65%) because institutional algorithms trade trend-following strategies that reinforce existing momentum.
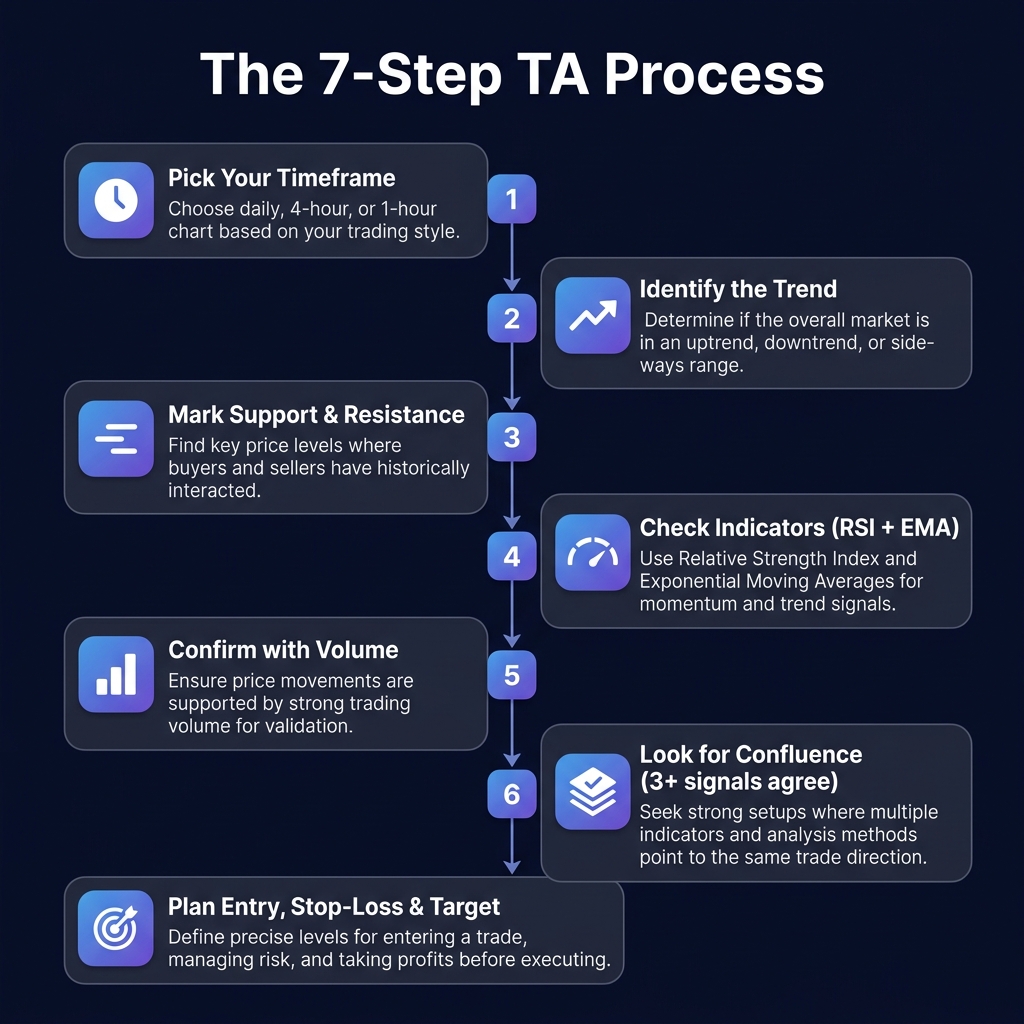
Part 4: How to Do Technical Analysis — A 7-Step Process
Now that you understand the individual tools, here's how to combine them into a repeatable analysis workflow:
Step 1: Pick Your Timeframe
Choose a higher timeframe for direction (Daily or 4H) and a lower timeframe for entry precision (4H or 1H). Don't start your analysis on a 5-minute chart — you'll see noise instead of signals.
Step 2: Identify the Trend
Zoom out. Look at the bigger picture first.
Is price making Higher Highs and Higher Lows? → Uptrend → look for buys
Is price making Lower Highs and Lower Lows? → Downtrend → look for sells or stay out
Is price bouncing between flat levels? → Range → trade the boundaries or wait
Step 3: Mark Support & Resistance
Draw horizontal zones at levels where price has reversed at least 2-3 times. Mark the most obvious ones — if you have to squint to see a level, it's probably not important enough.
Step 4: Check Your Indicators
Apply your core indicator set. For beginners, three is enough:
EMA 50 & 200 — Where is price relative to the trend? Above both = bullish. Below both = bearish.
RSI (14) — Is momentum extreme? Any divergence forming?
Volume — Is there conviction behind recent moves?
Step 5: Confirm with Volume
Whatever signal you see — breakout, divergence, pattern completion — check if volume confirms it. High volume = trustworthy signal. Low volume = approach with skepticism.
Step 6: Look for Confluence
Confluence means multiple independent signals agreeing on the same direction. This is the most important step.
Number of Signals Agreeing
Confidence Level
Action
1 signal
Low
Do not trade on a single signal alone
2 signals
Moderate
Possible trade with tight risk management
3+ signals
High
This is where you want to trade
Example of strong confluence:
Price pulls back to the 50 EMA in an uptrend (signal 1) + RSI reaches oversold at 28 with bullish divergence (signal 2) + volume is declining on the pullback, suggesting sellers are exhausted (signal 3) + price is sitting on a previous support zone (signal 4).
That's 4 independent signals all pointing to a potential bounce. This is a high-probability setup.
Step 7: Plan Your Trade BEFORE Entering
Before you click "Buy" or "Sell," define three things:
Element
What to Define
Example
Entry price
The exact price at which you will enter
$2,450 (at the 50 EMA bounce)
Stop-loss
The price at which you will exit if you're wrong
$2,380 (below the support zone)
Take-profit
The price at which you will take your profit
$2,660 (at the next resistance zone)
Risk-Reward Ratio
How much you stand to gain vs. lose
$210 profit / $70 risk = 3:1 R:R ✅
Never enter a trade without a stop-loss. This is not optional. Our Risk Management Guide covers position sizing and the 1-2% rule in detail.
Part 5: What Changed in 2026
Technical analysis principles haven't changed, but the crypto market has. Here's what's different:
The Institutional Effect
Bitcoin and Ethereum ETFs have brought institutional money into crypto. This affects TA in several ways:
Support and resistance levels are more reliable. Institutional algorithms trade around key levels, creating self-reinforcing zones that are harder to break.
Fake-outs are more sophisticated. Large players deliberately trigger retail stop-losses before entering at better prices — a practice called liquidity hunting.
Volume patterns are more meaningful. Institutional volume spikes are genuine and easier to distinguish from wash trading.
AI-Assisted Analysis
In 2023, traders manually drew trendlines and checked RSI one coin at a time. In 2026, AI tools can scan thousands of assets simultaneously, detect patterns in milliseconds, and combine data sources that no human could process alone.
This doesn't mean you don't need to understand TA — AI tools are only as useful as the trader interpreting their output. Think of AI as a powerful scanner that helps you find setups faster, not a replacement for understanding what those setups mean. For more on this intersection, see AI Pattern Recognition in Crypto.
On-Chain Data as a Third Dimension
Traditional technical analysis uses two data sources: price and volume. In crypto, there's a third: on-chain data — the actual movement of coins between wallets and exchanges.
Every trade needs a stop-loss defined BEFORE you enter
5
Trading every signal
FOMO — fear of missing "the one"
Only trade setups with 3+ confluent signals
6
Wrong timeframe
1-minute charts feel more "active"
Start on 4H and Daily. Lower timeframes need fast decisions
7
No trade journal
"I'll remember" — you won't
Record every trade: entry reason, exit reason, result, emotion
8
Risking too much
Wanting to "make it back" quickly
Never risk more than 1-2% of total capital per trade (details)
9
Copying others blindly
Twitter influencer said "buy"
Verify every signal yourself. Use their ideas as starting points, not final answers
10
Skipping practice
Wanting to trade real money immediately
Paper trade for at least 2-4 weeks before risking capital (paper trading guide)
Part 7: Your First-Week Practice Plan
Before risking real money, follow this 7-day learning sequence:
Day
Focus
Activity
Day 1
Candlestick reading
Open any crypto chart. Identify 20 candles: which are bullish, bearish? Where are long wicks showing rejection?
Day 2
Trend identification
Look at BTC, ETH, and 3 altcoins on the daily chart. Is each one in an uptrend, downtrend, or range? Write it down
Day 3
Support & resistance
Mark 3 support and 3 resistance zones on BTC's daily chart. Watch how price behaves when it reaches them
Day 4
RSI practice
Add RSI (14) to your chart. Find one example of overbought, one oversold, and try to spot one divergence
Day 5
EMA practice
Add EMA 50 and EMA 200. Where is price relative to them? Are they fanning out or compressing?
Day 6
Pattern spotting
Scroll through 10 altcoin charts. Can you identify any of the 6 patterns from Part 3?
Day 7
Full 7-step analysis
Pick one coin. Run through all 7 steps. Write down your entry, stop-loss, and target. Don't place the trade — just practice the process
After Week 1: Continue paper trading for 2-3 more weeks. Track every "virtual trade" in a spreadsheet. After 20+ paper trades, review your win rate and average risk-reward. If your win rate is above 40% and your average R:R is above 2:1, you have a foundation to start trading with small real amounts.
Part 8: Where to Go Next
Once you're comfortable with the 6 core concepts and 7-step process, here's a recommended learning path:
Does technical analysis actually work for cryptocurrency?
Yes, but it's a probability tool, not a crystal ball. Technical analysis increases your odds of timing good entries and exits, but no indicator or pattern is right 100% of the time. The key is combining multiple signals (confluence), managing your risk so losers are small, and being consistent over many trades. Studies and experienced traders consistently show that disciplined TA practitioners outperform random entry/exit over time — especially when combined with proper risk management.
What are the best technical indicators for crypto beginners?
Start with three: RSI (momentum), EMA 50/200 (trend direction), and Volume (conviction). These three cover different analytical dimensions without overlapping. Once you're comfortable, add MACD as your fourth. Avoid using more than 4 indicators simultaneously — it creates information overload and conflicting signals. For a complete comparison of all indicators, see our indicator guides.
How long does it take to learn crypto technical analysis?
Basic competence (reading charts, identifying trends, using 2-3 indicators): 2-4 weeks of daily practice. Consistent profitability: 6-12 months of active trading with a journal and disciplined risk management. There is no shortcut — you need screen time and pattern recognition that only comes from experience.
Which timeframe should beginners use?
The 4-hour (4H) and daily (1D) timeframes. They produce fewer false signals, give you time to think before acting, and are more forgiving of mistakes. Avoid 1-minute and 5-minute charts until you have at least 6 months of experience.
Can I use the same technical analysis for Bitcoin and altcoins?
The same principles apply, but with important differences. Bitcoin respects support/resistance more reliably because of institutional participation. Large-cap altcoins (ETH, SOL) are more volatile but still follow TA patterns reasonably well. Small-cap altcoins and meme coins often have unreliable TA because they're driven by narrative, social media hype, and low liquidity rather than technical patterns. Adjust your expectations and position sizes accordingly.
Is technical analysis better than fundamental analysis?
They serve different purposes. Fundamental analysis helps you decide WHAT to trade (which projects have real value). Technical analysis helps you decide WHEN to trade (the best entry and exit timing). Most professional crypto traders use both: fundamentals to build a watchlist, technicals to time entries and exits. For a detailed comparison, see our beginner's introduction to TA vs FA.
What is confluence and why does it matter?
Confluence means multiple independent signals pointing in the same direction at the same time. For example: RSI showing oversold + price at a strong support zone + volume declining on the drop = three signals all suggesting a potential bounce. The more signals that agree, the higher the probability of the trade working. Never trade on a single indicator alone.
How do I know if a breakout is real or fake?
Check volume. A genuine breakout above resistance should have at least 2x the 20-period average volume. If price breaks a key level but volume is below average, it's likely a fake-out — a trap designed to lure traders in before reversing. Also check the timeframe: breakouts on higher timeframes (4H, Daily) are more reliable than breakouts on lower timeframes (15m, 1H).
Do I need to pay for technical analysis tools?
Not necessarily. Many platforms offer free charting with basic indicators. TradingView's free tier includes candlestick charts, RSI, MACD, EMA, and basic drawing tools — which is enough to learn. As you progress, paid tools can save time by scanning hundreds of coins simultaneously and providing AI-assisted analysis, but they are not required to get started.
What is the 1-2% rule in crypto trading?
The 1-2% rule means you should never risk more than 1-2% of your total trading capital on any single trade. If your portfolio is $10,000, your maximum loss per trade should be $100-$200. This rule ensures that even a string of 10 losing trades in a row only costs you 10-20% of your capital — painful but survivable. Without this rule, a few bad trades can destroy your entire account. Our position sizing guide covers the math in detail.
Technical analysis isn't about predicting the future with certainty — it's about tilting the odds in your favor through structured, repeatable analysis. Learn the 6 core concepts. Follow the 7-step process. Manage your risk on every trade. The market rewards patience and discipline, not gut feelings and FOMO.
[!WARNING]
Financial Disclaimer: Trading cryptocurrencies involves substantial risk and may not be suitable for every investor. The high volatility of crypto assets can result in significant financial losses. The information provided in this guide is for educational purposes only and does not constitute financial, investment, or trading advice. Always conduct your own research, practice proper risk management, and consult with a licensed financial advisor before making any investment decisions.
About the Author
Sarah Mitchell is a Technical Analysis Specialist at CoinXSight, focusing on combining traditional chart patterns with modern on-chain metrics and machine learning algorithms. With over seven years of active trading experience, she specializes in swing trading strategies and trend-following frameworks. Connect with her on LinkedIn or follow her latest market updates on Twitter/X.