Order Flow Trading: How to Read Real-Time Buy/Sell Pressure in Crypto
Master order flow analysis for crypto trading — learn to read Delta, CVD, DOM depth, and tape patterns. A practical guide using CoinXSight's Chart Pro Order Flow panel with live examples.
JV
Julian VanceLead Technical Systems Architect·May 17, 2026 · 12 min read · Updated Oct 6
Every candle on a price chart is a summary — it tells you the open, high, low, and close of a time period. But it hides the most important information: who was more aggressive, buyers or sellers?
A green candle that closed +1% could have been:
Scenario A: Steady buying pressure throughout the hour, with buyers lifting offers progressively. This is genuine demand.
Scenario B: A single large market buy that spiked price, followed by steady selling that was absorbed. This is a liquidity grab that may reverse.
Traditional charts show both scenarios identically. Order flow analysis reveals the difference.
Order flow examines the actual transactions occurring in real-time:
Are market orders predominantly buying or selling? (Delta)
Is buying pressure accumulating over time? (CVD — Cumulative Volume Delta)
Where are large limit orders sitting? (DOM — Depth of Market)
What patterns are forming in the transaction tape? (Tape Reading)
This is the domain of institutional traders and professional scalpers. CoinXSight's Chart Pro brings these tools to retail traders for the first time. For a complete overview of all crypto indicators and how they work together, see our Cryptocurrency Technical Analysis Indicators guide.
The 5 Core Order Flow Metrics
1. Delta (Directional Pressure)
What it measures: The difference between market buy volume and market sell volume within each candle.
Why Delta matters more than regular volume: Regular volume counts all trades equally. A $10M candle could be $5M buying + $5M selling (neutral) or $8M buying + $2M selling (strongly bullish). The total volume is the same, but the Delta tells you the truth.
How to read Delta on CoinXSight:
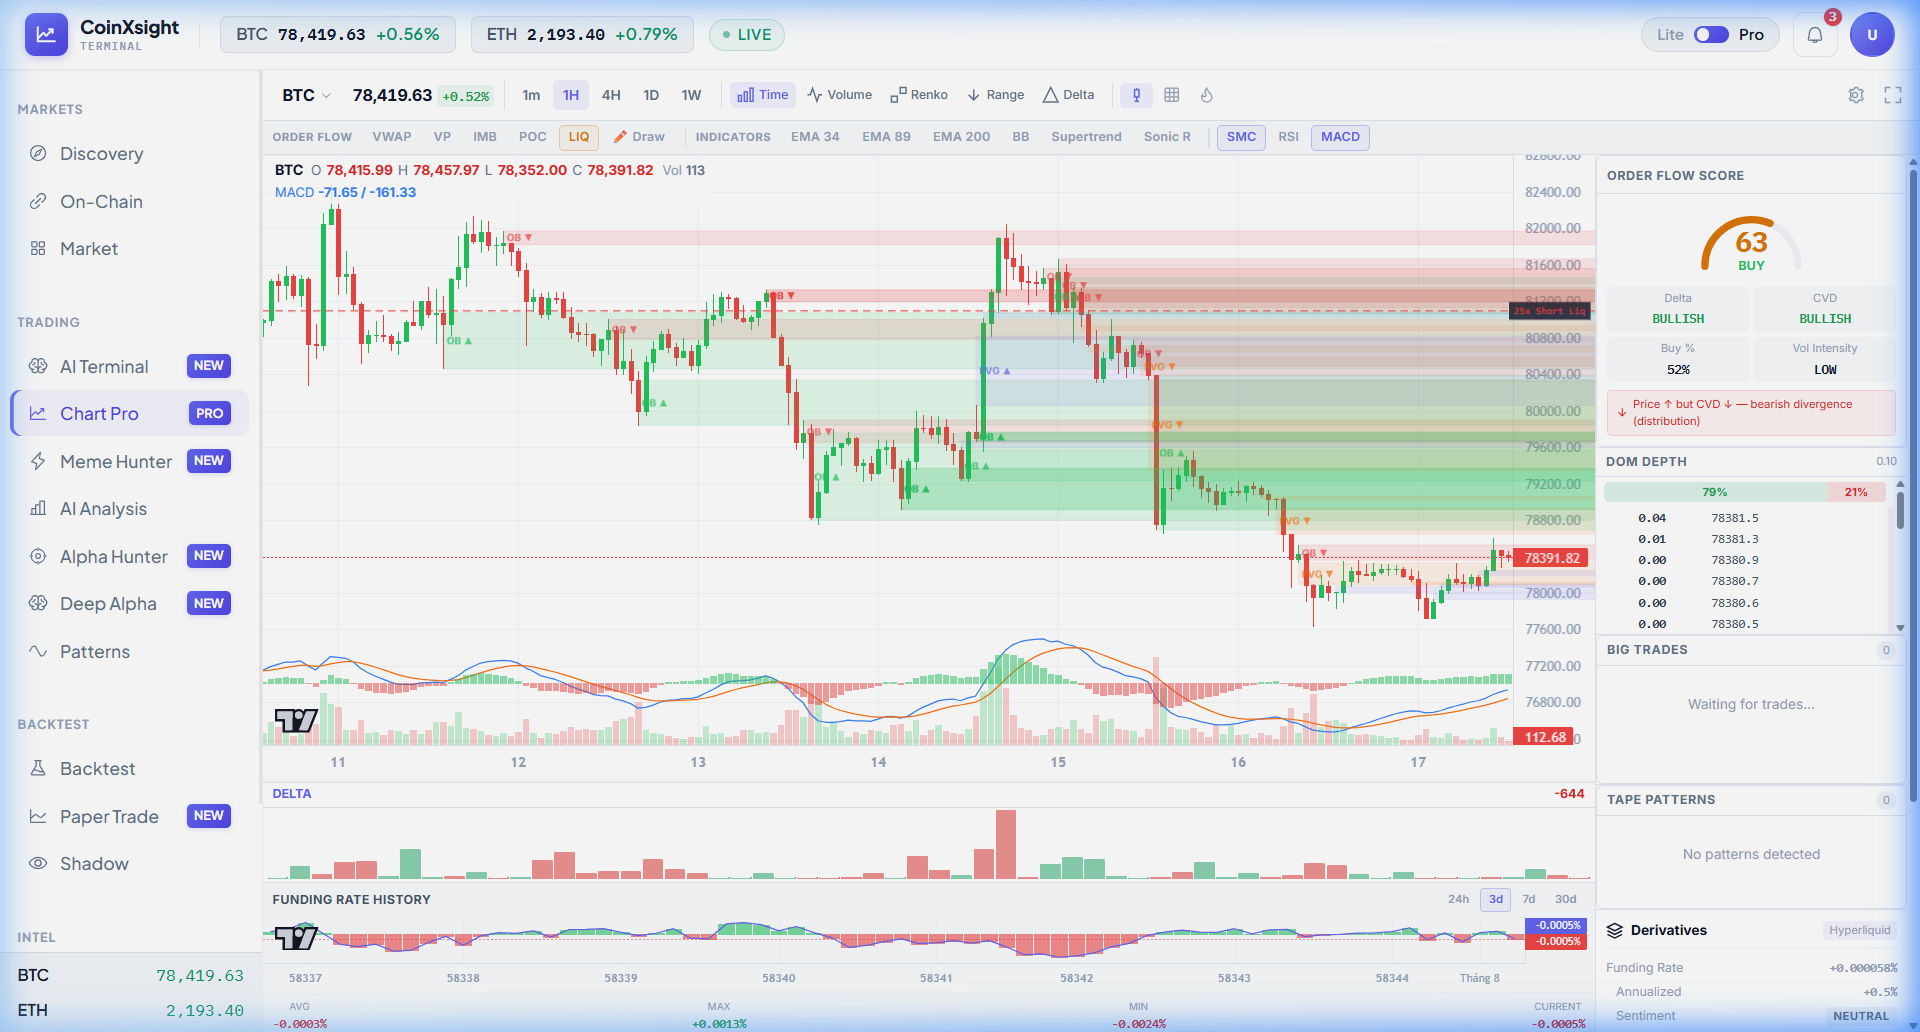
In the Chart Pro Order Flow panel (right sidebar), Delta shows as Bullish — meaning more market buy orders than market sells in the current session. Combined with CVD also reading Bullish, this tells us buying pressure is both present (Delta) and accumulating (CVD).
2. CVD (Cumulative Volume Delta)
What it measures: The running total of Delta over time. While Delta shows the pressure of individual candles, CVD shows the trend of pressure over hours or days.
CVD = Sum of all Deltas over the measured period

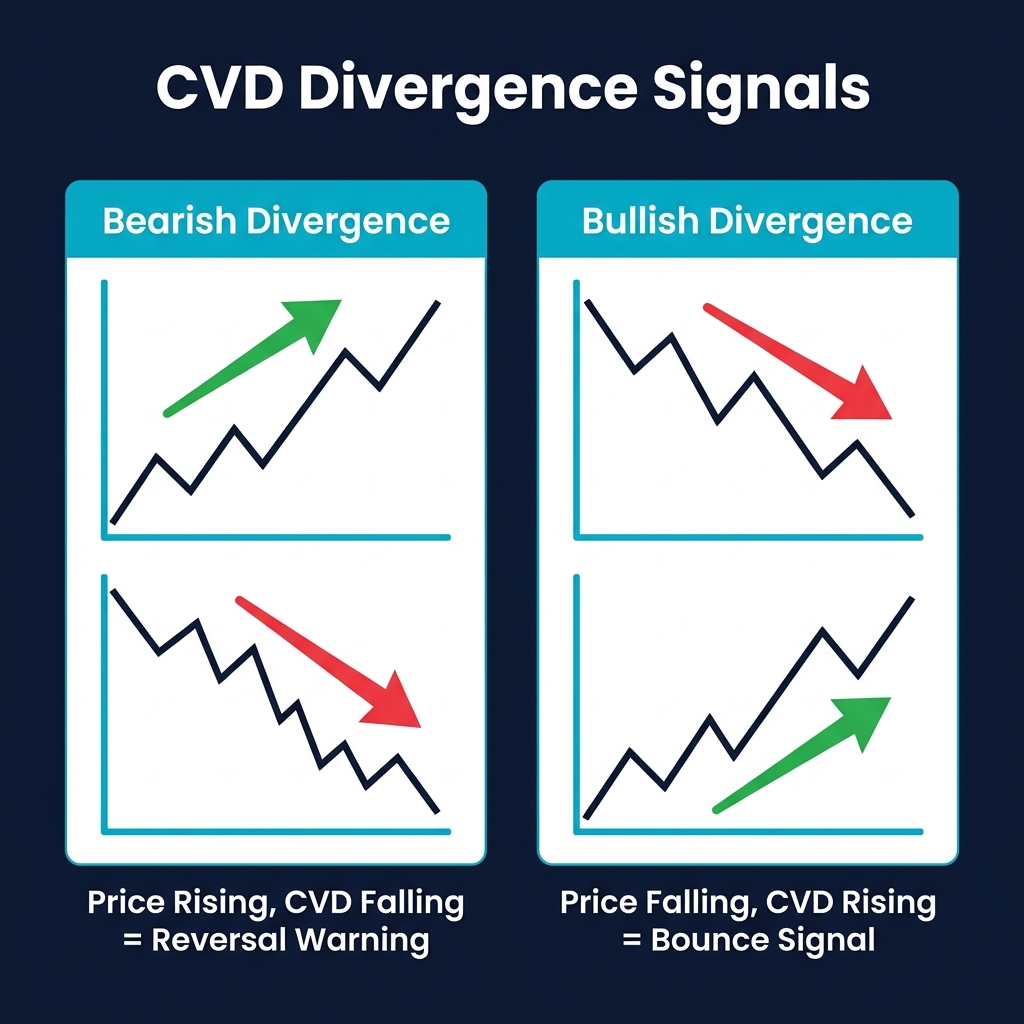
Rising CVD → Buying pressure accumulating → Supports price moves up
Falling CVD → Selling pressure accumulating → Supports price moves down
CVD divergence is one of the most reliable short-term reversal signals. It reveals when price movement is running out of fuel — the move continues by inertia while the actual order flow has already shifted direction.
3. Buy/Sell Ratio
What it measures: The percentage split between buying and selling volume. The current reading shows 52% Buy / 48% Sell — a slight buyer advantage.
At 52/48, the current BTC reading shows marginal buyer advantage — enough to support a slow upward drift but not enough for a breakout. This aligns with the Low Volume Intensity reading — buyers are present but not aggressive.
4. DOM (Depth of Market)
What it measures: The live order book — where large limit buy and sell orders are sitting at various price levels.
Why DOM matters for trading:
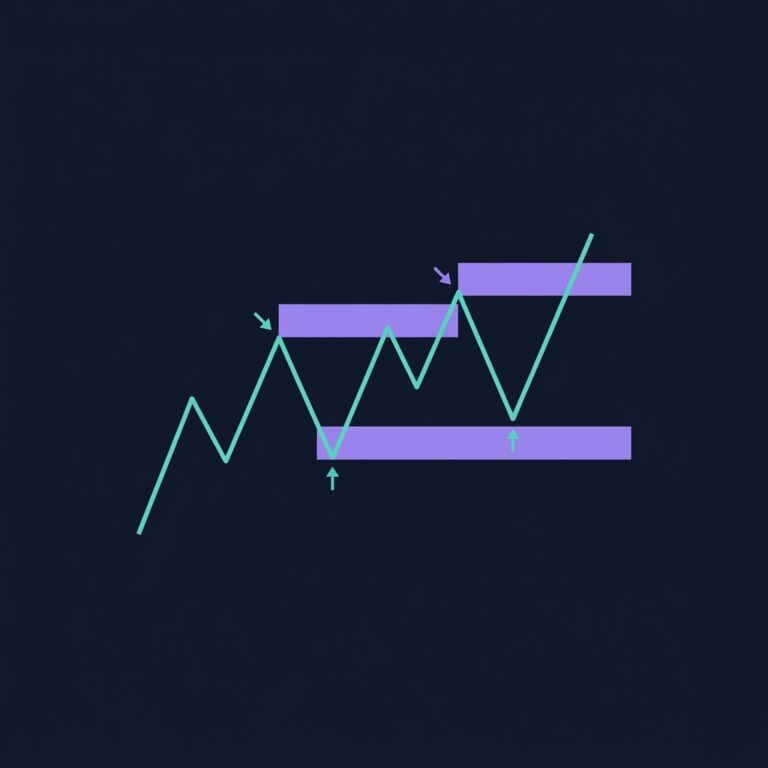
Large bid walls (big limit buy orders) act as support — price tends to bounce off levels where significant buying interest exists
Large ask walls (big limit sell orders) act as resistance — price tends to stall at levels where significant selling interest exists
Wall removal (a large order being pulled before it's filled) signals that the wall was fake — a manipulation tactic to create false support/resistance
DOM on CoinXSight's Chart Pro:
The Order Flow panel shows DOM depth levels, indicating where significant order clusters exist above and below the current price. Watch for:
Asymmetric depth (much more bids than asks = bullish floor)
Thick resistance zones (large ask clusters that need significant buying pressure to break)
Rapid depth changes (walls appearing or disappearing near current price — potential manipulation)
5. Tape Patterns
What it measures: Real-time patterns in the transaction flow — sequences of trades that indicate institutional activity.
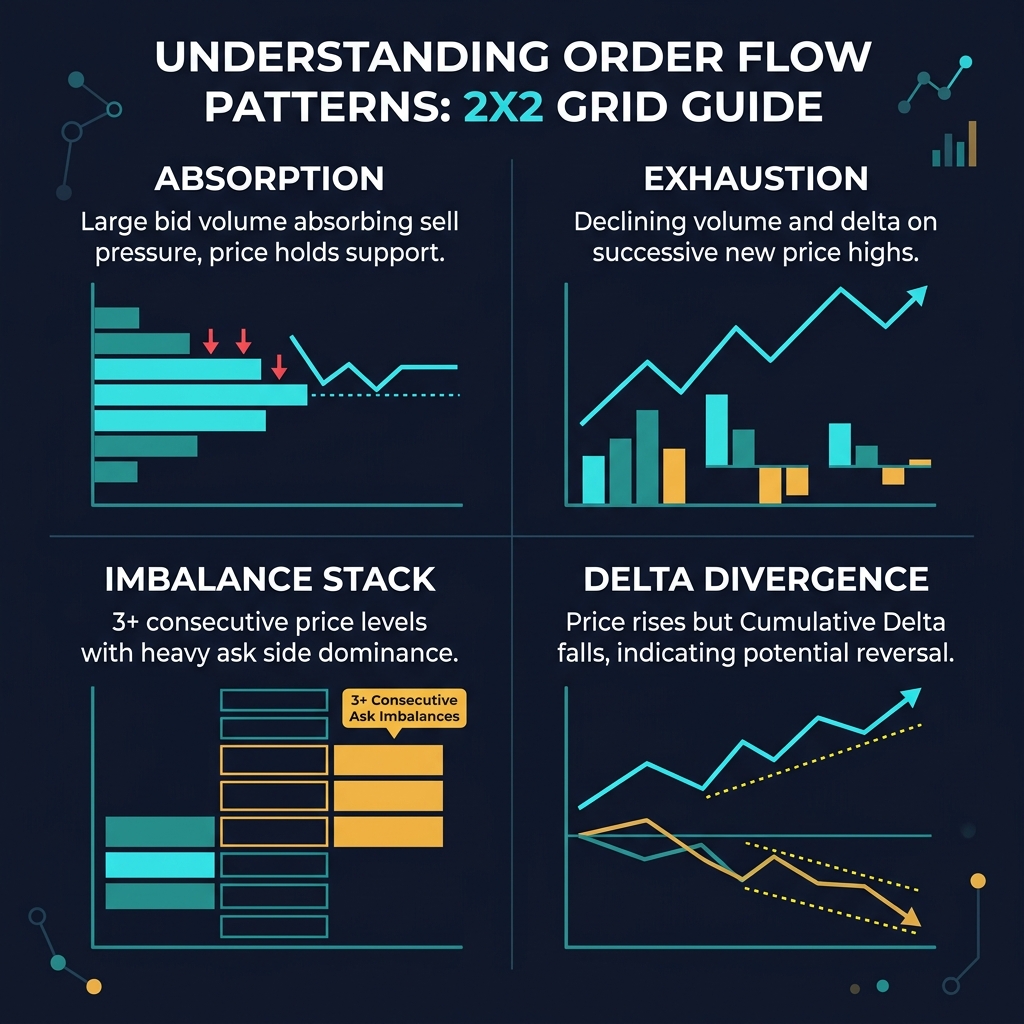
Key tape patterns:
Pattern
Description
Interpretation
Iceberg orders
Large total volume executed through many small identical-size orders
Institutional accumulation — trying to buy without moving price
Sweep
A rapid sequence of market orders that eats through multiple price levels
Aggressive directional move — often precedes a continuation
Absorption
Large limit orders absorb heavy selling without price dropping
Strong buyer is accumulating — very bullish
Exhaustion
Declining trade size and frequency at a price extreme
The move is running out of participants — reversal zone
CoinXSight's Chart Pro detects and flags these tape patterns in the Order Flow panel, saving you from manually monitoring the raw trade feed.
Order Flow Trading Strategies
This is where crypto technical analysis becomes practical — a quality crypto analytics platform will display these signals in real time, helping you act on setups as they form.
Strategy 1: Delta Divergence Reversal
This strategy catches turning points by detecting when order flow diverges from price action.
Setup:
Price makes a new swing high (or low)
Delta on the same candle is weaker than the Delta on the previous swing high (or low)
CVD confirms the divergence — it's declining while price is rising
Entry:
For shorts: Enter when price fails to hold the new high and the next candle closes bearish
For longs: Enter when price fails to make a new low and the next candle closes bullish
Stop-loss: Above the swing high (shorts) or below the swing low (longs)
Why it works: Absorption at support means a large buyer (institution/whale) is willing to take the other side of all the selling. When the sellers exhaust, only buyers remain → price accelerates upward.
Strategy 3: Volume Intensity Breakout
This strategy combines Volume Intensity with traditional breakout patterns.
Setup:
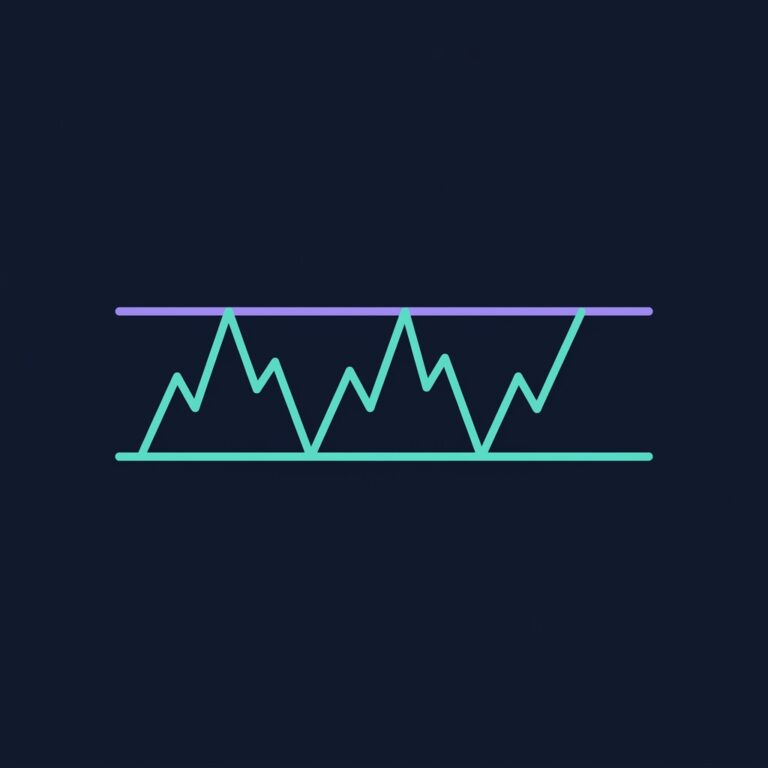
Price consolidates in a tight range (identified by Bollinger Bands squeeze)
Volume Intensity reads "Low" for 3+ consecutive candles — the calm before the storm
Delta shows a slight directional bias (55%+ in one direction)
Entry:
Enter when Volume Intensity shifts from "Low" to "High" AND price breaks out of the consolidation range
Confirm with Delta in the breakout direction
Stop-loss: Opposite side of the consolidation range
Target: Measured move (range height projected from breakout point)
Why it works: Low Volume Intensity during consolidation means energy is building. When it releases (Intensity jumps to High), the move tends to be sharp and directional.
Order Flow + CoinXSight's Other Modules: The Integration
Order flow alone is a powerful tool, but its true value emerges when combined with CoinXSight's multi-module ecosystem:
The Confirmation Stack
Step 1: Alpha Hunter signal detected → ASI ≥ 55, pattern confirmed
   ↓
Step 2: Deep Alpha validation → Confluence Score ≥ 60, all layers above 15
   ↓
Step 3: On-Chain check → Whale flow not contradicting (not net selling)
   ↓
Step 4: Chart Pro Order Flow → Final entry timing
   - Delta in trade direction ✅
   - CVD supporting (no divergence) ✅
   - Buy/Sell ratio ≥ 55% in trade direction ✅
   - Volume Intensity appropriate for strategy ✅
   ↓
EXECUTE with confidence
Each layer filters out progressively more risk:
Alpha Hunter reduces 500+ tokens to 15-20 candidates
Deep Alpha reduces 15-20 to 3-5 qualified setups
On-Chain reduces 3-5 to 2-3 with institutional confirmation
Order Flow provides the precise entry timing for the 1-2 best setups
When to Let Order Flow Override Other Signals
Scenario: Alpha Hunter shows a BUY signal with ASI 72 for SOL. Deep Alpha confirms with Confluence 7/10. On-chain shows neutral whale activity. Everything looks great.
But Chart Pro's Order Flow panel shows:
Delta: Bearish (more selling than buying)
CVD: Falling for the past 3 hours
Buy/Sell: 44% Buy / 56% Sell
Tape: Multiple large sell orders hitting the tape
Decision: Delay entry. The Order Flow is telling you that the short-term execution environment is hostile to long entries. The AI signal may be correct on a multi-hour or multi-day basis, but entering NOW would likely result in adverse price action before the trade works.
Wait for: Order Flow to confirm — Delta turning bullish, CVD stabilizing, Buy/Sell ratio reaching 50/50 or better. Then enter.
Common Order Flow Mistakes
1. Reading Too Much into Low-Volume Flow
During quiet market hours (weekends, Asian-only sessions for BTC), order flow signals are unreliable. A "bullish" Delta reading based on $500K of volume is meaningless — it takes a single $100K trade to flip the reading. Only trust Order Flow during high-volume periods (US session, major exchange overlap hours).
2. Ignoring the Timeframe
Order flow on a 1-minute chart shows noise. Order flow on a 4H chart shows trend. Match your Order Flow timeframe to your trading style:
Scalping: 5M-15M Order Flow
Day trading: 1H Order Flow
Swing trading: 4H Order Flow (use for entry timing, not primary analysis)
3. DOM Spoofing
Large orders on the DOM are frequently fake. Market makers and algos place large limit orders to create the appearance of support or resistance, then pull them milliseconds before execution. Never trade solely based on DOM walls — they can disappear instantly.
4. Confusing Delta Direction with Price Direction
Positive Delta on a red candle is actually BULLISH — it means buyers were more aggressive but sellers still dominated through limit order absorption. This is a common absorption pattern that often precedes a bounce.
5. Overcomplicating Entries
Order flow should simplify your entries, not complicate them. If you find yourself staring at 6 different flow metrics and can't make a decision, step back and ask the simple question: "Is buying or selling more aggressive right now?" If the answer is clear, trade in that direction. If it's ambiguous, wait.
Whether you want to buy Bitcoin, buy Ethereum, or trade altcoins, this indicator helps you time entries on any crypto exchange with data-driven confidence.
Frequently Asked Questions
Do I need to pay for order flow data?
CoinXSight's Chart Pro includes Order Flow analysis in the platform — no additional data feed required. The system aggregates real-time exchange data (Binance, OKX) and calculates Delta, CVD, and flow metrics automatically.
Can order flow analysis work on decentralized exchanges (DEXs)?
Partially. DEXs don't have traditional order books (except limit order protocols like Serum), so DOM analysis doesn't apply. However, swap volume data and on-chain transaction flow can provide similar directional insights. CoinXSight's On-Chain module tracks DEX volumes as part of the broader flow analysis.
Is order flow more important than technical analysis?
They're complementary. Technical analysis (RSI, EMA, MACD) tells you what has happened. Order flow tells you what is happening right now. Use technicals for setup identification and order flow for entry timing.
What timeframe is best for order flow analysis?
For most traders, the 1H timeframe provides the optimal balance between signal quality and noise filtering. Professional scalpers use 5M-15M, but this requires constant screen time and fast execution. For swing traders, 4H flow provides useful context for entry timing.
How does Order Flow Score relate to the ASI Score?
They measure different things. ASI Score evaluates overall directional probability over 1-7 days using multiple data sources (technical, on-chain, sentiment, volume). Order Flow Score evaluates real-time transaction imbalance over minutes to hours. ASI is your strategic compass; Order Flow is your tactical rifle scope.
Can large players manipulate order flow?
Yes — through spoofing (placing and canceling large orders), wash trading (trading with yourself to inflate volume), and iceberg orders (hiding true order size). This is why Order Flow should never be your only signal — always validate with CoinXSight's AI Analysis and on-chain data.
Summary
Order flow analysis gives you X-ray vision into what's actually happening behind every price candle. By understanding Delta (directional pressure), CVD (accumulated pressure), Buy/Sell ratio (dominance), DOM (pending orders), and Tape Patterns (institutional footprints), you can time entries with precision that candlestick analysis alone cannot achieve.
CoinXSight's Chart Pro Order Flow panel integrates these metrics into a single dashboard with an Order Flow Score that simplifies the analysis to a single actionable number. Combined with the platform's Alpha Hunter signals, Deep Alpha confluence scoring, and on-chain intelligence, Order Flow becomes the final confirmation layer in a complete, multi-dimensional trading system.
Key takeaways:
Delta divergence (flow disagrees with price) is the strongest reversal signal
CVD trend matters more than individual candle Delta
Low Volume Intensity → High Intensity transition signals breakout potential
Always match Order Flow timeframe to your trading style
Use Order Flow for entry TIMING, not trade DIRECTION (direction comes from AI Analysis and Confluence)
Lead Technical Systems Architect·Signals & Metrics Desk
Technical systems developer with a mathematical focus on momentum indicators, volatility metrics (ATR), volume profiles, and multi-timeframe filter models.
QUANTITATIVE SUITE // DEEP ALPHA ENGINEACTIVE
BTC/USDT // LIVE SCANNER
CONFLUENCE 93
LIVE SPOT PRICE$83,908.89STRONG_BUY
TP2
$89,725.68
+6.94%
TP1
$86,233.44
+2.77%
ENTRY
$83,905.28
ZONE
SL
$82,741.19
-1.39%
Auto-detect Order Blocks, Fair Value Gaps and risk-adjusted DCA ladders in < 5s.