Bollinger Bands: How to Trade Volatility Squeezes and Breakouts in Crypto
Learn Bollinger Bands for crypto trading. Understand squeezes, breakouts, band walks, and how CoinXSight uses Bollinger Bands in its Volume Layer scoring.
JV
Julian VanceLead Technical Systems Architect·May 16, 2026 · 9 min read · Updated Oct 6
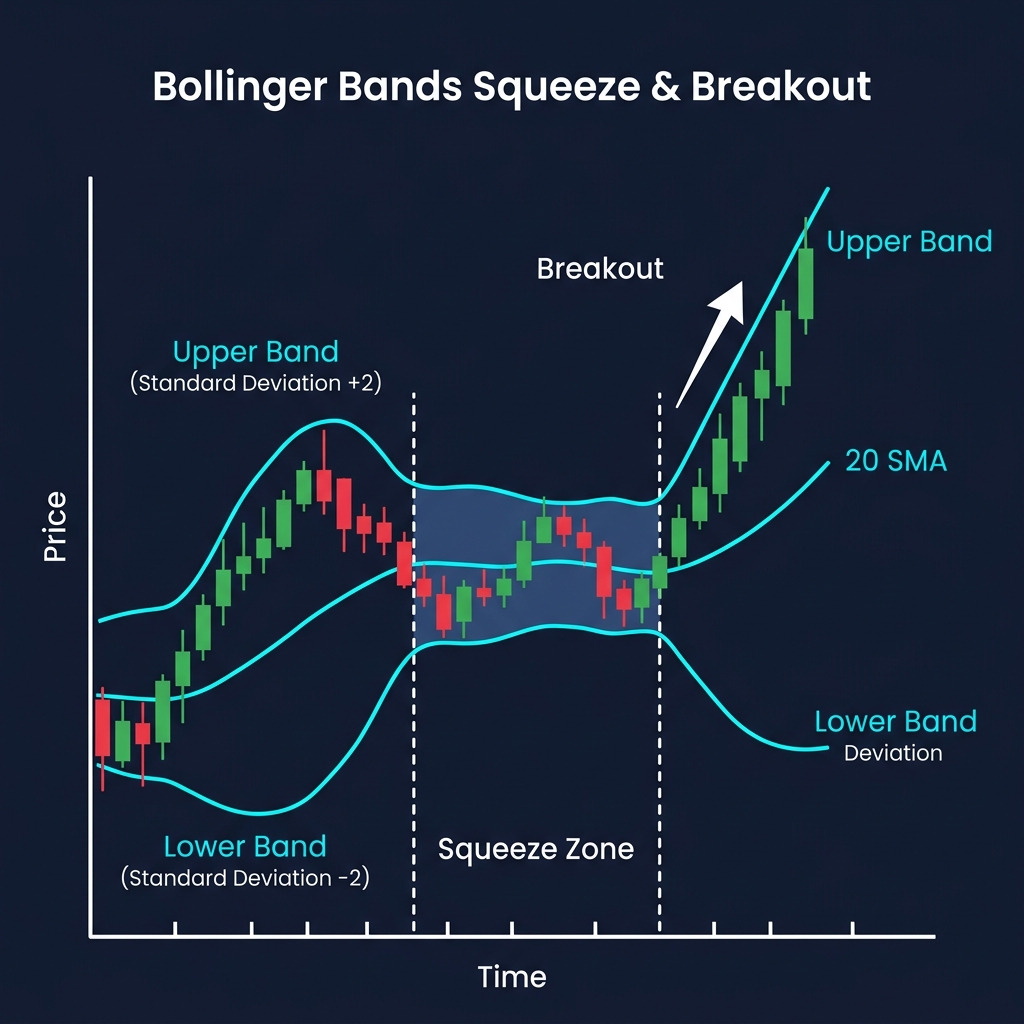
Bollinger Bands are a volatility indicator created by John Bollinger in the 1980s. They consist of three lines: a middle band (20-period Simple Moving Average) and two outer bands set 2 standard deviations above and below the middle. The bands automatically widen when volatility increases and contract when volatility decreases.
Bollinger Bands answer a fundamental question: Is the current price relatively high or low compared to recent volatility? When price touches the upper band, the asset is stretched high relative to its norm. When price touches the lower band, it is stretched low. Neither condition alone is a buy or sell signal — context determines the meaning. For a complete overview of all crypto indicators and how they work together, see our Cryptocurrency Technical Analysis Indicators guide.
💡 On CoinXSight, Bollinger Bands are automatically computed by the platform's analysis engine and surfaced across multiple modules. Deep Alpha shows the band width and price position relative to the bands. Chart Pro overlays the bands visually on the candlestick chart. Bollinger Band data feeds into the Volume Layer of the Confluence Scoring system.
How Bollinger Bands Are Calculated
The three components use standard statistical measures:
Middle Band = SMA(20)
Upper Band  = SMA(20) + (2 × Standard Deviation of 20 periods)
Lower Band  = SMA(20) - (2 × Standard Deviation of 20 periods)
What this means in practice: If BTC's 20-period SMA is $78,000 and the standard deviation is $2,000, then:
Upper Band = $78,000 + $4,000 = $82,000
Lower Band = $78,000 – $4,000 = $74,000
Band Width = $8,000 (the range of "normal" volatility)
Statistically, approximately 95% of price action falls within 2 standard deviations. When price moves outside the bands, it represents a statistically unusual event — either extreme momentum or an imminent reversal.
How to Read Bollinger Bands — 4 Key Patterns
Pattern 1: The Squeeze — Breakout Loading
A squeeze occurs when the bands contract to their narrowest width in 20+ candles. This signals that volatility has compressed to an extreme and a large move is imminent — the direction is unknown, but the explosion is coming.
How to identify a squeeze:
Bandwidth (Upper – Lower) drops to the lowest level in the last 50+ candles
Price consolidates in a tight range, with small candle bodies
Volume typically decreases during the squeeze
What happens after a squeeze: The wider the squeeze duration, the more powerful the subsequent breakout. A 15-day squeeze on the daily chart often produces a 10-20% move when it finally resolves.
Pattern 2: Band Walk — Trend Confirmation
A band walk occurs when price repeatedly touches or rides along one band during a strong trend. This is NOT a reversal signal — it confirms trend strength.
Upper band walk: Price stays near or above the upper band → strong bullish trend, do not short
Lower band walk: Price stays near or below the lower band → strong bearish trend, do not buy
Critical mistake to avoid: Many traders see price touching the upper band and immediately sell, assuming it must reverse. In a strong trend, price can "walk" the band for weeks. Bitcoin walked the upper daily Bollinger Band for 19 consecutive days during its Q4 2024 rally — anyone who sold the first touch missed a 35% continuation.
Pattern 3: Mean Reversion — Bounce Off the Bands
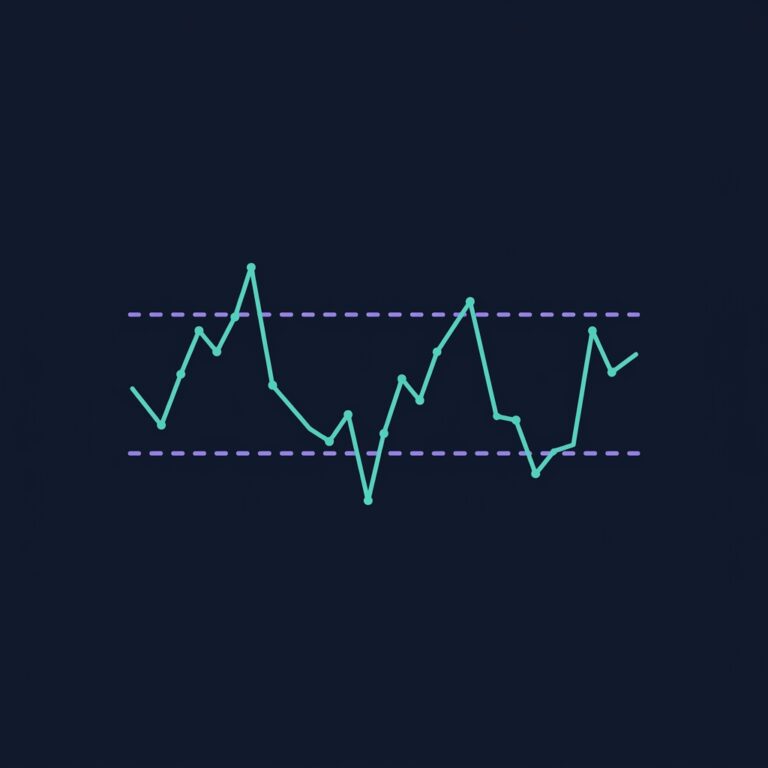
In a ranging market (no clear trend), price tends to bounce between the bands like a pinball:
Price touches the lower band → bounces back toward the middle band
Price touches the upper band → pulls back toward the middle band
When mean reversion works: Only in sideways, range-bound markets. Check the EMA ribbon first — if EMAs are flat and tangled, mean reversion is viable. If EMAs are stacking in one direction, the trend dominates and band touches are continuation signals, not reversals.
Pattern 4: W-Bottom and M-Top — Reversal Patterns
John Bollinger specifically identified these patterns:
W-Bottom (Bullish reversal):
Price touches or breaks below the lower band → first low
Price bounces to the middle band
Price pulls back to near the first low, but this time stays inside the band → second low is higher
Price breaks above the middle band → reversal confirmed
M-Top (Bearish reversal):
The mirror image — two touches of the upper band with the second touch failing to exceed the band, followed by a break below the middle band.
Real-World Scenario: SOL Bollinger Squeeze on CoinXSight
As a comprehensive crypto analytics platform, CoinXSight makes this analysis accessible through its integrated toolset:
Scenario — SOL, March 2026, daily chart:
On March 8, 2026, SOL's daily Bollinger Bandwidth contracted to 4.2% — the tightest squeeze in 45 days. CoinXSight's platform showed:
Deep Alpha indicators:
EMA 34/89 stacking bullish, price above EMA 200
RSI: 52 (neutral — coiled, not stretched)
MACD: Histogram bars shrinking toward zero line → compression
Whale wallets accumulated 180,000 SOL over the previous week
Exchange outflows exceeded inflows by $12M — accumulation pattern
On March 12, SOL broke the upper Bollinger Band at $168 with 2.8x average volume. The Confluence Score jumped to 8/10 as all layers aligned. SOL rallied from $168 to $198 over the next 8 days — an 18% move triggered by a classic squeeze breakout with multi-module confirmation.
⚠️ Limitation: Bollinger squeezes predict that a big move is coming but not the direction. Approximately 50% of squeezes break upward and 50% break downward before trend and momentum context is applied. CoinXSight's Confluence Score helps filter direction by checking EMA alignment, RSI, and whale flow before the breakout resolves.
Bollinger Bands + RSI — The Double Filter
Combining Bollinger Bands with RSI creates a powerful filter for false signals:
Scenario
Bollinger Signal
RSI Signal
Combined Interpretation
Strong buy
Price at lower band in uptrend
RSI 30-35 (oversold)
High-probability bounce — enter long
Strong sell
Price at upper band in downtrend
RSI 70+ (overbought)
High-probability rejection — exit or short
Trap (don't trade)
Price at lower band in downtrend
RSI 30 and falling
Band walk — not a bounce setup
Continuation
Price at upper band in uptrend
RSI 60-70 (strong, not extreme)
Trend continuation — hold, don't sell
On CoinXSight, both Bollinger Bands and RSI feed into the Confluence Scoring system — the Volume Layer captures Bollinger Band position while the Momentum Layer captures RSI, ensuring you never evaluate either in isolation.
Common Bollinger Band Mistakes
Treating band touches as automatic buy/sell signals: Upper band = sell and lower band = buy only works in ranging markets. In trending markets, band touches confirm the trend. Always check the trend first (EMA ribbon).
Ignoring the squeeze: The squeeze is the most actionable Bollinger Band pattern, but it requires patience — you wait for the contraction, then wait for the directional breakout, then enter. Most traders skip the waiting and enter prematurely.
Using Bollinger Bands on 1-minute charts: On very short timeframes, the bands expand and contract so rapidly that the patterns become noise. Daily and 4H charts produce the most reliable squeeze and band walk patterns for crypto.
Forgetting the 5% rule: Even with 2-standard-deviation bands, 5% of price action falls outside the bands by pure statistics. An occasional move beyond the bands is expected and normal — it is not always a signal.
How to Use Bollinger Bands on CoinXSight — Multi-Module Workflow
One thing I have learned from trading BB squeezes for years: the squeeze itself is free information — everyone can see it. The edge comes from knowing which direction the squeeze resolves. That is where combining BB with the rest of CoinXSight's modules becomes critical.
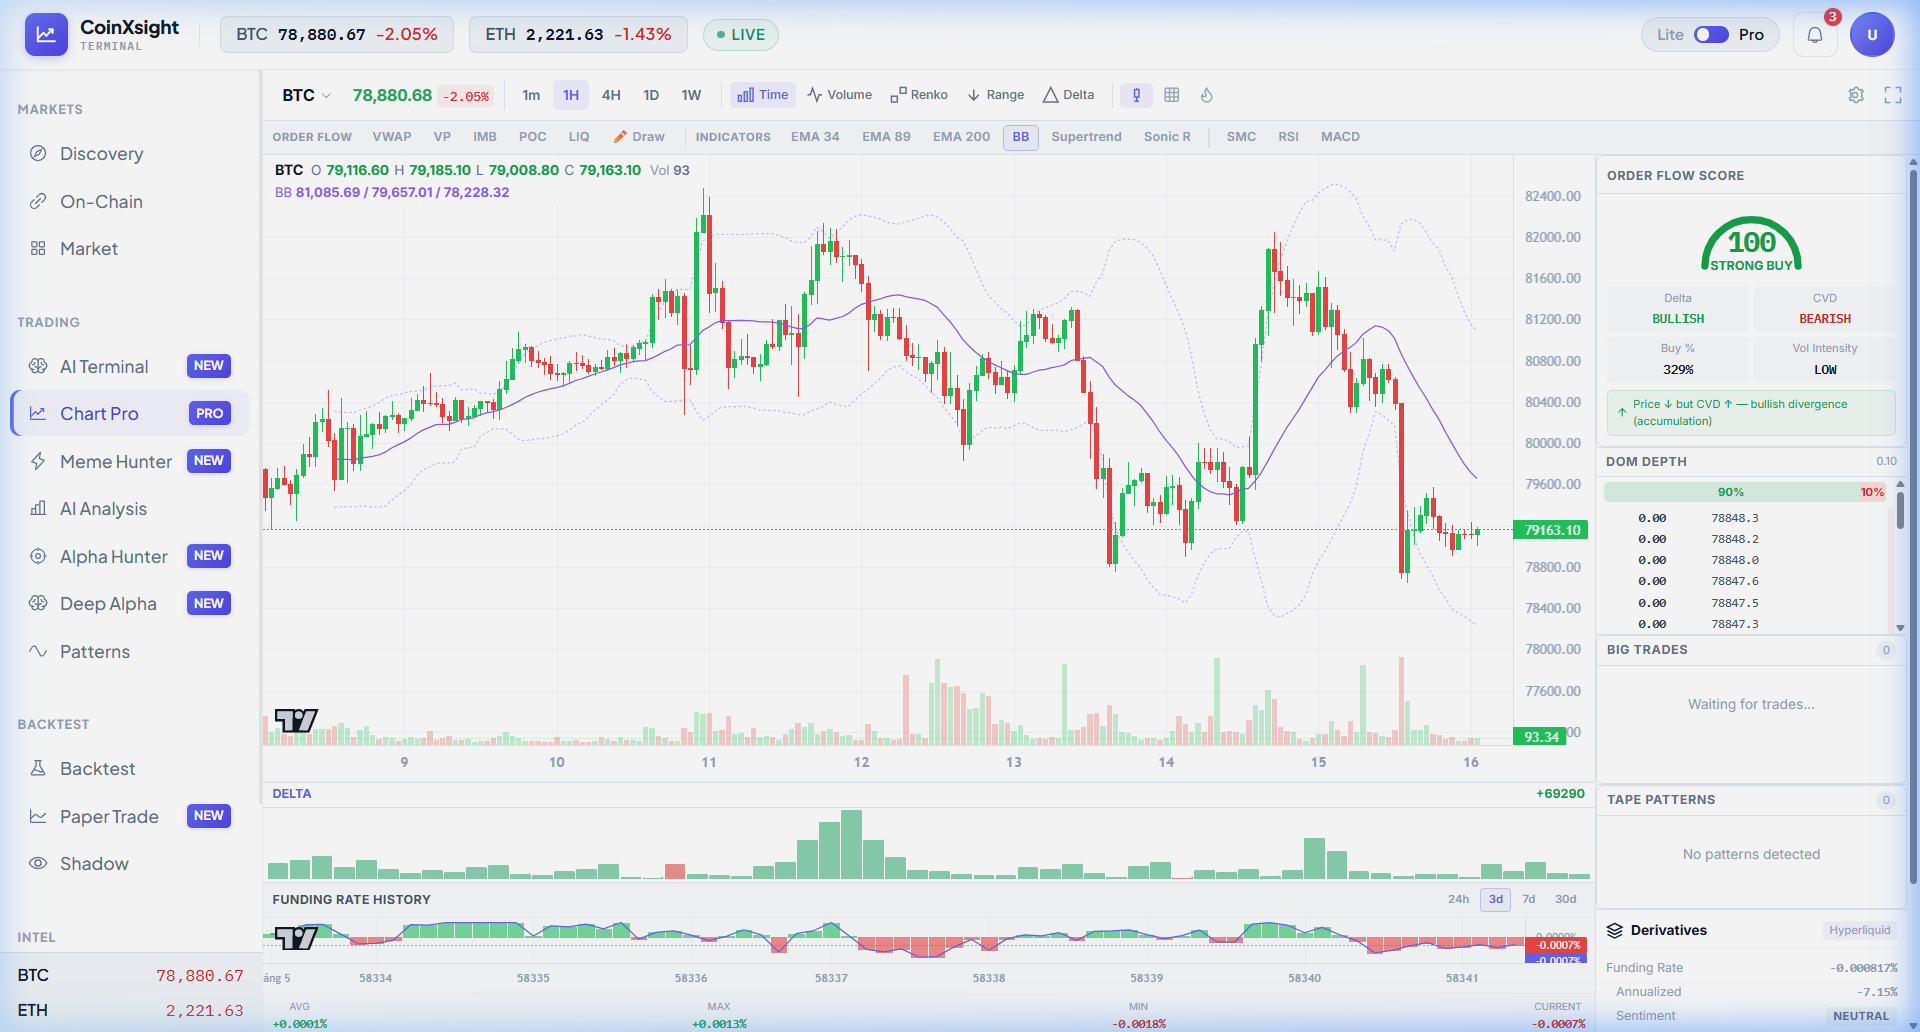
Open Chart Pro → toggle BB from the indicator toolbar (disable all other overlays so the bands are clearly visible). In the screenshot below, BTC 1H shows the Bollinger Bands at Upper: $81,085, Middle: $79,657, Lower: $78,228 — a bandwidth of ~3.6%. Look at two key things:
The squeeze on May 10-11: Bands contracted to their narrowest point in 7 days. Then BTC exploded to $82,400 — a classic post-squeeze breakout.
The current widening: After the spike, bands are widening again. Price is now at $79,163, sitting right at the middle band (SMA 20). This is the decision point — a close below the middle band typically targets the lower band at $78,228.
What I look for specifically: the angle of the bands. When both bands are expanding symmetrically, volatility is rising but direction is unclear. When the upper band curves up while the lower band stays flat, that is directional expansion — the move is going up. In this chart, the bands expanded upward first (bullish breakout) and are now starting to contract — the explosive move is exhausting.
Step 2: Contextualize with trend data on Deep Alpha
Bollinger Bands tell you volatility state, not trend direction. Switch to Deep Alpha → search BTC. The header shows Market Regime: MIXED, Trend: BEARISH. This context changes everything about the BB signal: price at the middle band during a bearish trend means the middle band is more likely to act as resistance (not support). The Confluence Score shows PARTIAL — the system is not strongly biased either way, which aligns with the middle-band indecision zone.
Step 3: Check if smart money is fading or joining the move on On-Chain
The BB squeeze broke upward to $82,400, but is that move backed by real capital or just a short squeeze? Switch to On-Chain. The Exchange Inflow is +$32.8M, meaning tokens are flowing INTO exchanges (bearish). Smart money is selling into the rally, not accumulating. That is why the breakout failed to hold — the BB breakout looked bullish on the chart, but on-chain data showed distribution. This is the filter I use to avoid getting trapped in BB breakout fakeouts.
Whether you want to buy Bitcoin, buy Ethereum, or trade altcoins, this indicator helps you time entries on any crypto exchange with data-driven confidence.
Frequently Asked Questions
What Bollinger Band settings should I use for crypto?
The standard 20-period SMA with 2 standard deviations works well for most crypto assets on daily and 4H charts. Some traders use 1.5 standard deviations for tighter bands (more signals, more noise) or 2.5 for wider bands (fewer signals, higher reliability). CoinXSight uses the standard 20/2 settings.
What does a Bollinger Band squeeze mean?
A squeeze means volatility has compressed to an extreme low. Statistically, low-volatility periods are followed by high-volatility breakouts. The squeeze tells you a big move is coming — use trend indicators (EMA) and momentum (RSI, MACD) to predict the direction, then enter after the breakout candle confirms.
Should I buy when price touches the lower Bollinger Band?
Only in a ranging or uptrending market. In a downtrend, lower band touches are often continuation signals (band walk), not bounce setups. Always confirm with trend direction (EMA ribbon) and momentum (RSI) before treating a lower band touch as a buying opportunity.
How do Bollinger Bands relate to volatility?
Bollinger Bands are a direct measure of volatility. Wide bands = high volatility. Narrow bands = low volatility. The bandwidth metric (upper band minus lower band, divided by middle band) gives a normalized volatility reading. On CoinXSight, this data feeds into the Volume Layer of the Confluence Scoring system.
Can Bollinger Bands predict the next Bitcoin move?
No indicator predicts the future. Bollinger Bands identify the current volatility state and statistical extremes. A squeeze tells you to prepare for a big move; a band touch tells you price is at a statistical extreme. Combine with CoinXSight's Confluence Score to assess whether the setup has multi-factor support before trading.
JV
Julian Vance
TA // SYSTEMS
Lead Technical Systems Architect·Signals & Metrics Desk
Technical systems developer with a mathematical focus on momentum indicators, volatility metrics (ATR), volume profiles, and multi-timeframe filter models.
QUANTITATIVE SUITE // DEEP ALPHA ENGINEACTIVE
BTC/USDT // LIVE SCANNER
CONFLUENCE 81
LIVE SPOT PRICE$83,773.12MODERATE_BUY
TP2
$89,020.57
+6.96%
TP1
$85,544.37
+2.78%
ENTRY
$83,226.90
ZONE
SL
$82,068.17
-1.39%
Auto-detect Order Blocks, Fair Value Gaps and risk-adjusted DCA ladders in < 5s.
Master every cryptocurrency technical analysis indicator with this complete guide. Covers 27 indicators across trend, momentum, volume, volatility, and crypto-native…