Funding Rate & Open Interest: The Crypto-Native Edge Traditional Markets Don’t Have
Master funding rate analysis, open interest tracking, and liquidation cascade prediction for crypto trading. Learn to read leveraged positioning, detect crowded trades, and time entries using derivatives data.
JV
Julian VanceLead Technical Systems Architect·May 23, 2026 · 15 min read · Updated Oct 6
In traditional markets, you see price and volume. That's it. In crypto, you see something far more powerful: the exact positioning of every leveraged trader in the market.
Funding rates, open interest, liquidation levels, and long/short ratios tell you exactly how crowded a trade is, where the pain threshold sits, and when a liquidation cascade is about to trigger a violent move.
This is data that hedge fund traders in traditional markets would pay millions for. In crypto, it's free. The question is: do you know how to read it? For a complete overview of all crypto indicators and how they work together, see our Cryptocurrency Technical Analysis Indicators guide.
Funding Rate: The Cost of Being Crowded
What Is Funding Rate?
Perpetual futures contracts have no expiration date. To keep the perpetual price anchored to the spot price, exchanges use a funding mechanism: every 8 hours (on most exchanges), one side pays the other.
Funding Rate
Who Pays Who
What It Means
Positive (+0.01% to +0.05%)
Longs pay shorts
More buyers than sellers — bullish sentiment
Neutral (~0.00% to +0.01%)
Minimal transfer
Balanced market — no crowding
Negative (-0.01% to -0.05%)
Shorts pay longs
More sellers than buyers — bearish sentiment
Extremely positive (>+0.05%)
Longs pay heavily
Overcrowded long — correction likely
Extremely negative (<-0.05%)
Shorts pay heavily
Overcrowded short — squeeze likely
The Contrarian Signal
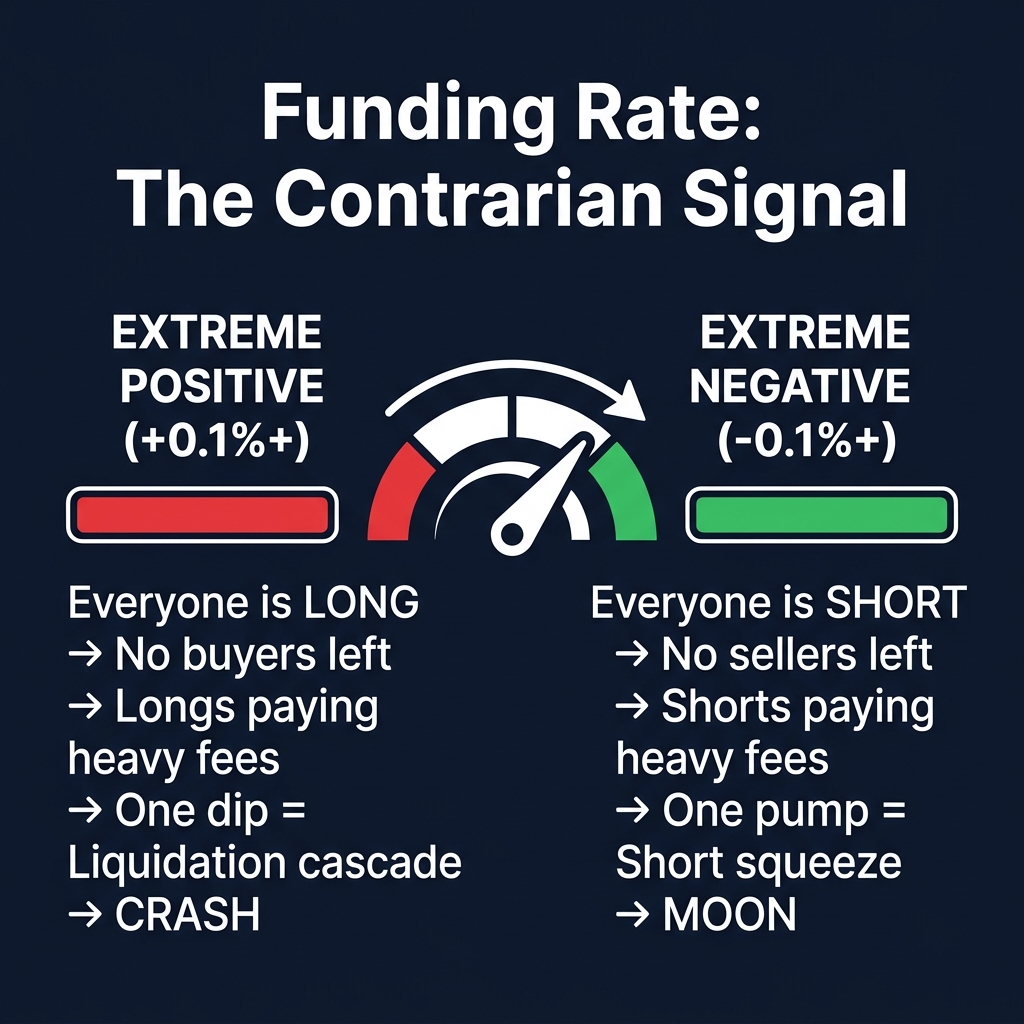
Here's the key insight: extreme funding rates are contrarian indicators. When everyone is positioned in one direction, the market tends to reverse — because there's no one left to push the trade further.
Extreme positive funding (+0.1% or higher):
Everyone is long and leveraged
No more buyers left to push price up
Longs are paying expensive funding fees, creating selling pressure
One small dip triggers a cascade of long liquidations
Result: Sharp correction or crash
Extreme negative funding (-0.1% or lower):
Everyone is short and leveraged
No more sellers left to push price down
Shorts are paying expensive funding fees, creating buying pressure
One small pump triggers a cascade of short liquidations
Result: Violent short squeeze
Historical Funding Rate Extremes
Date
Asset
Funding Rate
What Happened
Apr 2021
BTC
+0.15%
Crashed 53% from $64K to $30K
Jun 2022
ETH
-0.08%
Squeezed 40% from $880 to $1,280
Nov 2024
BTC
+0.12%
Corrected 18% from $99K to $81K
Mar 2025
SOL
-0.06%
Squeezed 35% from $120 to $162
The pattern is consistent: extreme funding precedes major reversals.
Open Interest: The Fuel Gauge
What Is Open Interest?
Open Interest (OI) is the total number of active futures contracts. Unlike volume (which counts each trade), OI only changes when NEW contracts are created or existing ones are closed.
OI increases when: A new buyer opens a long AND a new seller opens a short (new money enters the market)
OI decreases when: An existing long closes AND an existing short closes (money exits the market)
OI + Price: The 4 Scenarios
Price
Open Interest
Interpretation
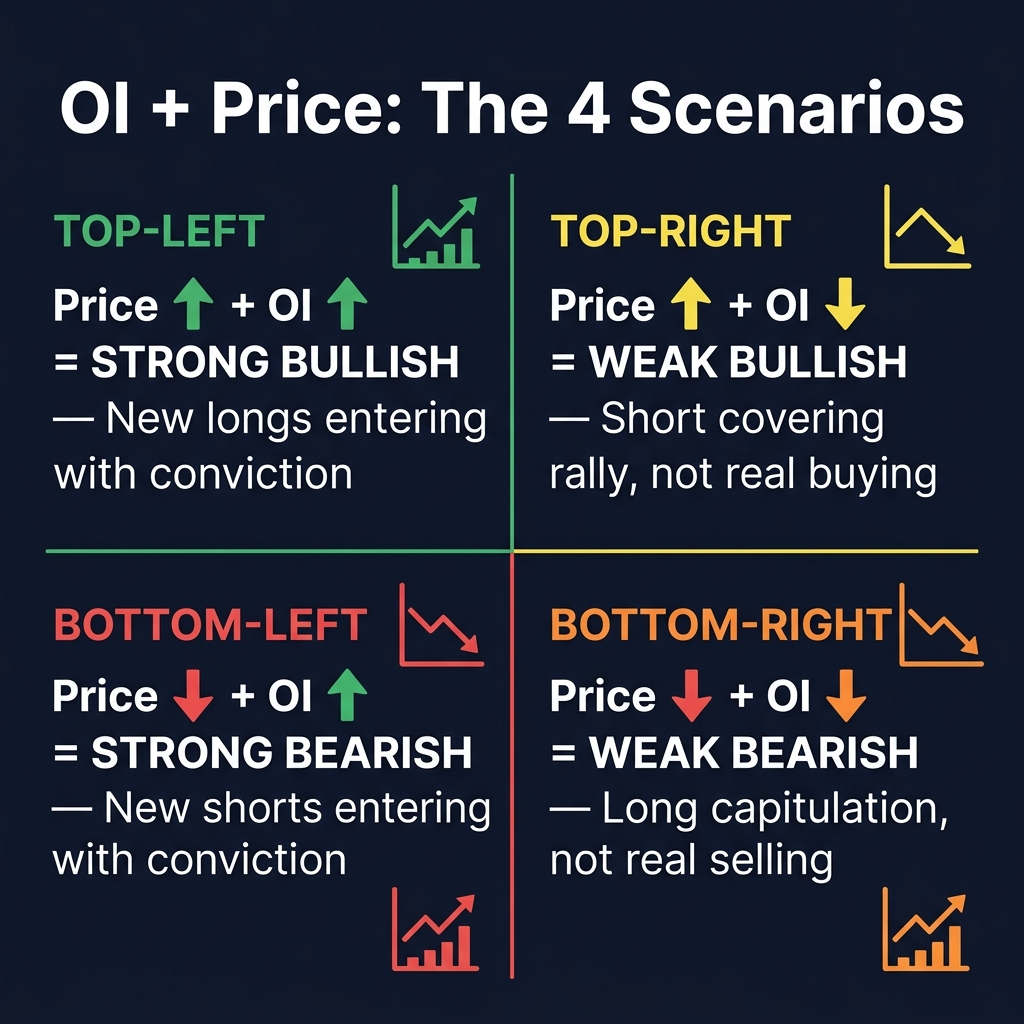
Price ↑ + OI ↑
New longs being opened aggressively
Bullish — fresh money chasing the move up
Price ↑ + OI ↓
Shorts closing (short covering rally)
Weak bullish — rally driven by closing, not conviction
Price ↓ + OI ↑
New shorts being opened aggressively
Bearish — fresh money betting on further decline
Price ↓ + OI ↓
Longs closing (long capitulation)
Weak bearish — decline driven by closing, not new selling
The critical insight: OI rising with price confirms the move has real conviction. OI falling with price means the move is exhaustion-driven and likely to reverse.
OI Divergence
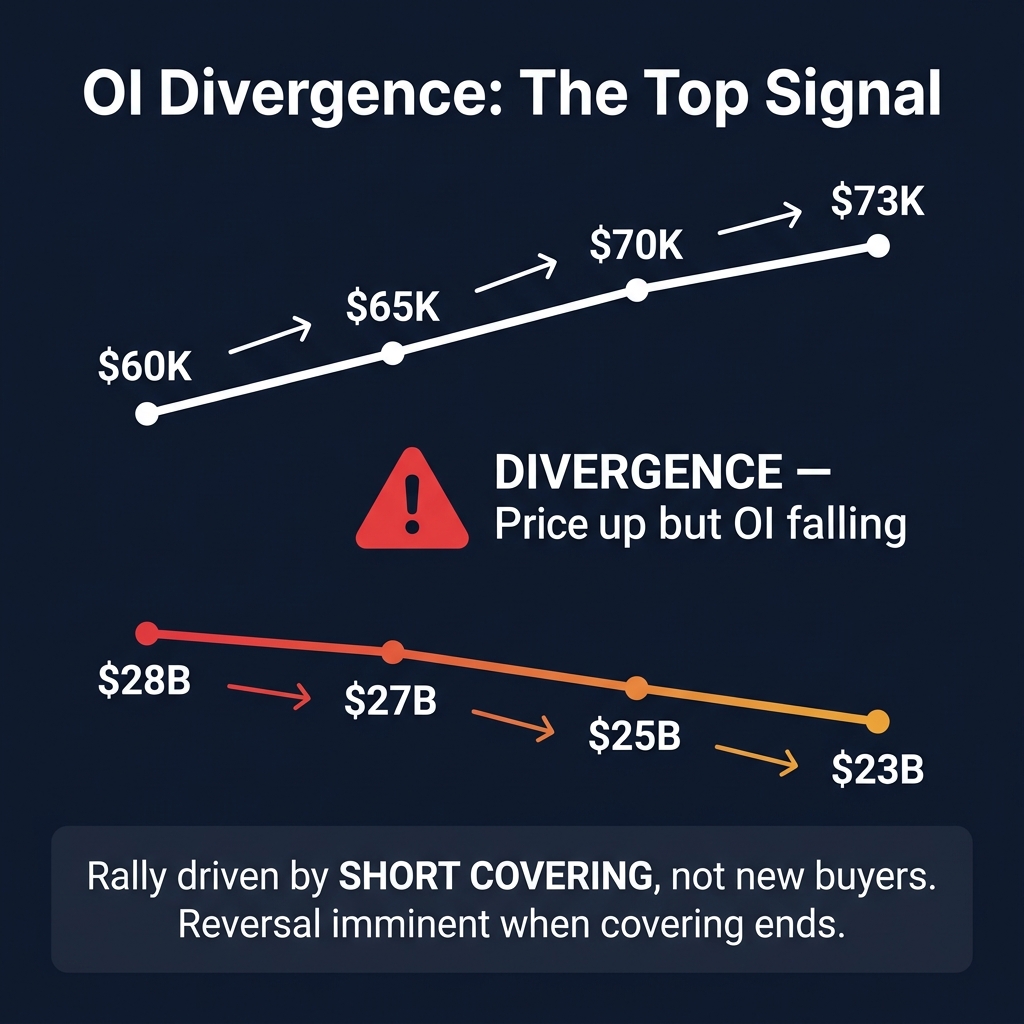
When price makes a new high but OI is declining — that's a major red flag. It means the rally is being driven by short covering, not new buyers. The moment shorts are done covering, buying pressure evaporates and price collapses.
Price:   $60K → $65K → $70K → $73K (new high!)
OI:      $28B → $27B → $25B → $23B (declining!)

→ OI DIVERGENCE: Price up but fewer contracts
→ Rally driven by short covering, not new longs
→ WARNING: Reversal imminent when covering ends
This divergence pattern predicted multiple major tops in BTC history.
Liquidation Cascades: The Market's Nuclear Option
How Liquidations Work
When a leveraged trader's unrealized loss exceeds their margin, their position is forcibly closed (liquidated) by the exchange. This creates a market order in the opposite direction.
Long liquidation: Trader was long → position force-sold → creates selling pressure → pushes price down → triggers more long liquidations → CASCADE
Short liquidation: Trader was short → position force-bought → creates buying pressure → pushes price up → triggers more short liquidations → CASCADE
The Cascade Mechanics
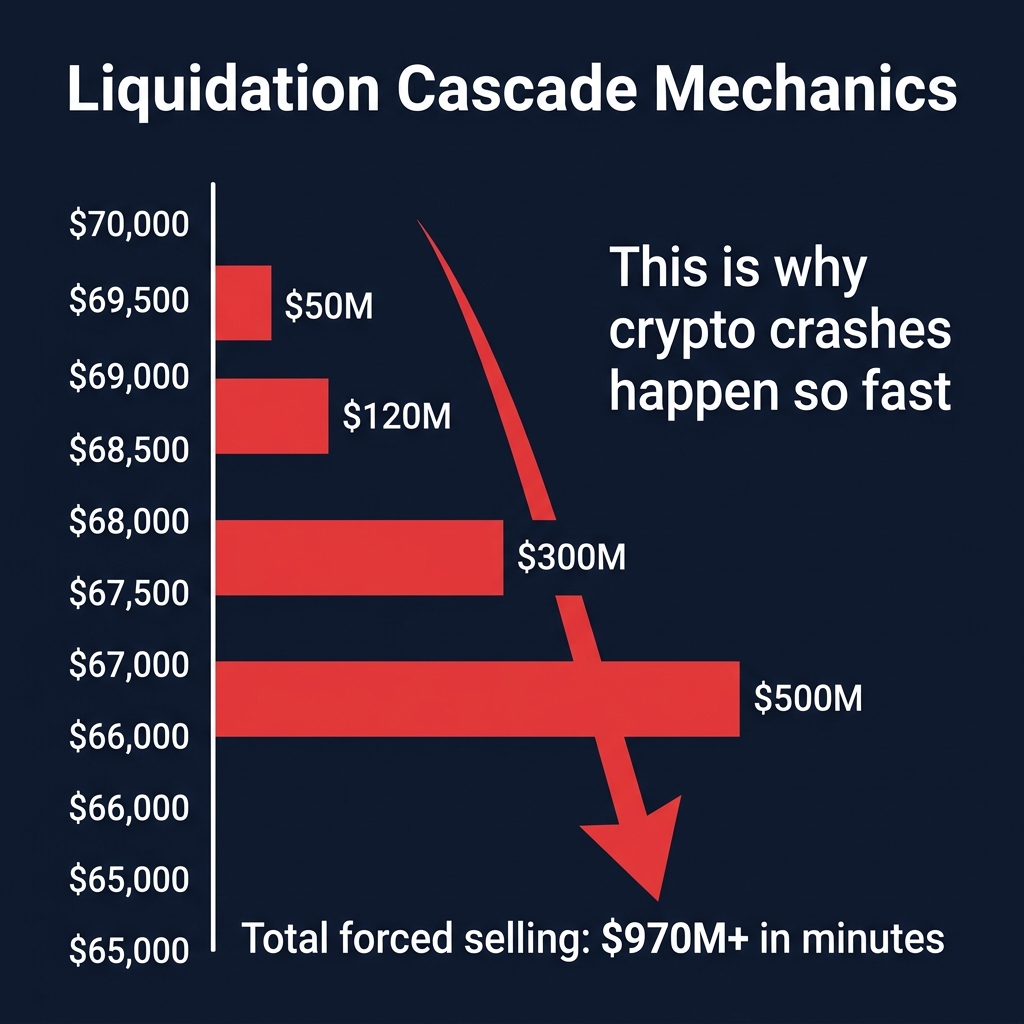
Liquidation Cascade (Longs):

$70,000  ←── Price starts falling
$69,500  ←── 10x longs liquidated ($50M sold)
$69,000  ←── 20x longs liquidated ($120M sold)
$68,000  ←── 25x longs liquidated ($300M sold)
$67,000  ←── 50x longs liquidated ($500M sold)
$65,000  ←── Cascade exhausts, price stabilizes

Total forced selling: $970M+ in minutes
This is why crypto "crashes" happen so fast
Reading Liquidation Heatmaps
Liquidation heatmaps show WHERE concentrated clusters of liquidation orders sit at specific price levels. These clusters act as "magnets" — price tends to be drawn toward the largest liquidation pools because market makers and whales profit from triggering them.
How to use liquidation heatmaps:
Identify the largest clusters — Above current price (short liquidations) and below (long liquidations)
Price gravitates toward the bigger cluster — If $500M in short liquidations sit at $72K and only $200M in long liquidations at $68K, price is more likely to squeeze up
After the cascade, look for reversal — Once a liquidation cluster is swept, the forced buying/selling exhausts and price often reverses
Combine with SMC — Liquidation sweeps ARE liquidity sweeps. The SMC framework applies directly
The Complete Derivatives Dashboard
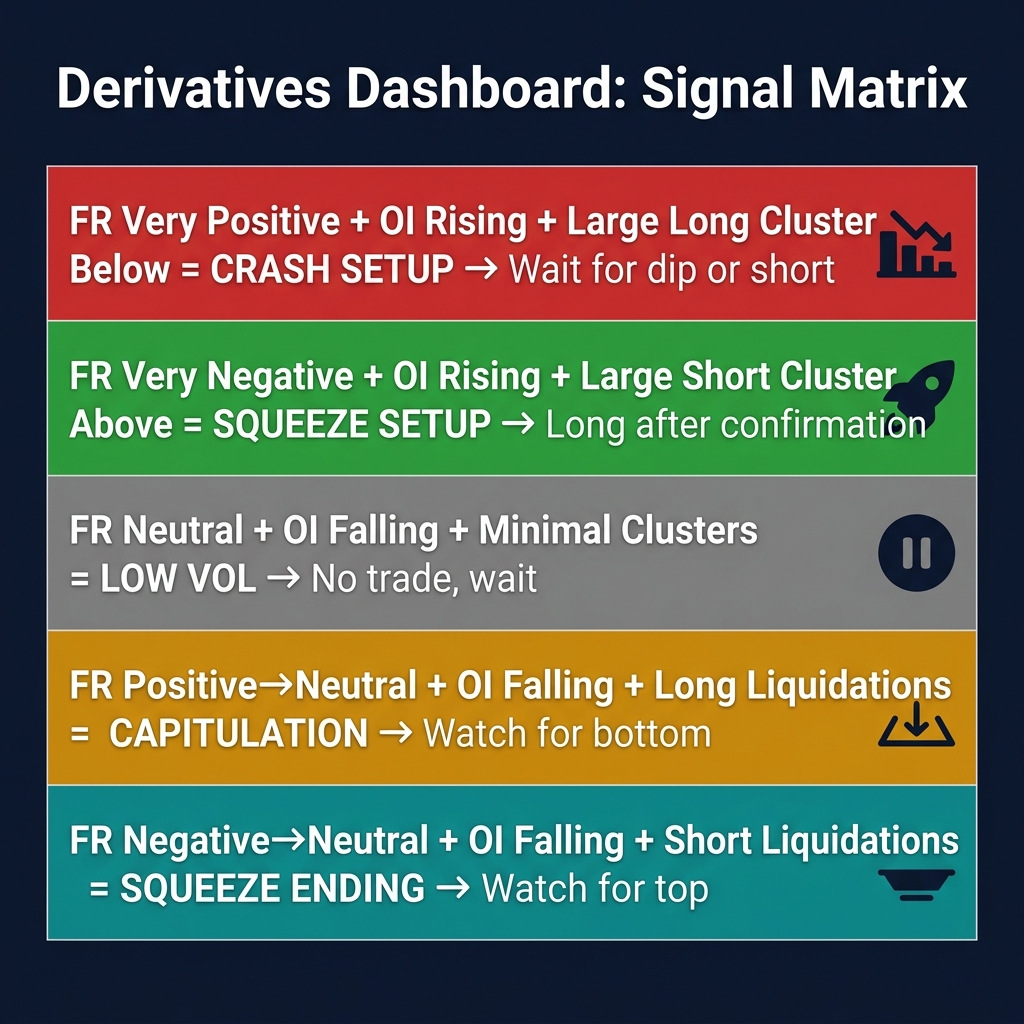
Indicator Combination Matrix
Funding Rate
Open Interest
Liquidations
Signal
Action
Very positive
Rising
Large long cluster below
Crash setup
Wait for dip to buy, or short
Very negative
Rising
Large short cluster above
Squeeze setup
Wait for pump confirmation, or long
Neutral
Falling
Minimal clusters
Low volatility
No trade — wait for buildup
Positive → Neutral
Falling
Long liquidations occurring
Capitulation
Watch for bottom formation
Negative → Neutral
Falling
Short liquidations occurring
Short squeeze ending
Watch for top formation
Long/Short Ratio
The aggregate long/short ratio shows the percentage of traders positioned long vs. short. Like funding rates, extremes are contrarian.
Long/Short Ratio
Interpretation
>65% long
Overcrowded long — bearish contrarian signal
55-65% long
Mildly bullish sentiment — normal
45-55%
Balanced — no edge from sentiment
35-45% short
Mildly bearish sentiment — normal
>65% short
Overcrowded short — bullish contrarian signal
Important: Long/short ratio measures the NUMBER of traders, not the SIZE of positions. 90% of traders can be long while one whale has a short position larger than all of them combined. Always cross-reference with OI and funding.
Practical Trading Framework
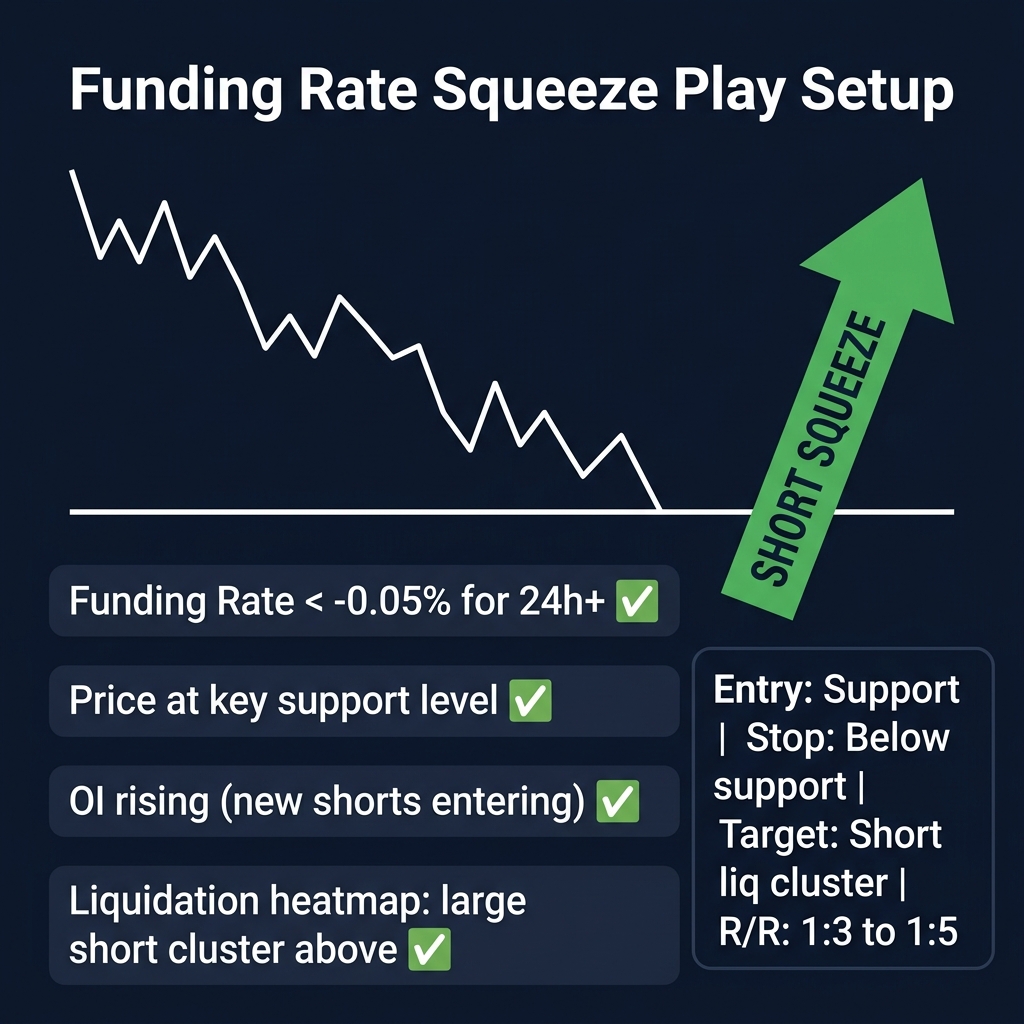
Setup 1: The Funding Rate Squeeze Play
Conditions:
1. Funding rate < -0.05% for 24+ hours
2. Price at or near key support
3. OI rising (new shorts entering)
4. Liquidation heatmap shows large short cluster above

Action:
- Enter long at support with tight stop
- Target: The short liquidation cluster level
- R/R: Typically 1:3 to 1:5 (squeezes are violent)
- Size: Standard (not aggressive — squeezes can fail)
Setup 2: The OI Divergence Fade
Conditions:
1. Price making new highs
2. OI declining (short covering, not new longs)
3. Funding rate positive and rising
4. RSI divergence on HTF confirms

Action:
- Wait for first bearish CHoCH on 4H
- Enter short at the Order Block
- Stop: Above the recent high
- Target: Previous support + liquidity pool
- R/R: Typically 1:2 to 1:4
Setup 3: The Post-Liquidation Reversal
Conditions:
1. Major liquidation cascade just occurred ($100M+)
2. Price has swept a key liquidity level
3. Funding rate resetting toward neutral
4. OI dropping rapidly (positions being wiped)

Action:
- Wait for LTF CHoCH after the cascade
- Enter in the OPPOSITE direction of the cascade
- Stop: Beyond the cascade extreme
- Target: Pre-cascade price level
- R/R: Typically 1:3+ (reversals from cascades are strong)
CoinXSight Integration
Real-Time Derivatives Dashboard
CoinXSight aggregates funding rates, OI, and liquidation data across all major exchanges (Binance, Bybit, OKX, dYdX) into a unified dashboard. Instead of checking 4 exchanges manually, get the cross-exchange average in one view.
Funding rate extremes — When funding exceeds historical norms
OI divergences — When OI trends opposite to price
Liquidation cluster proximity — When price approaches major liquidation levels
Long/short ratio extremes — When crowd positioning becomes one-sided
ASI Score: Derivatives Component
The ASI Score includes derivatives data as one of its input layers. When ASI detects extreme funding + rising OI + price at a key SMC level, the confluence score increases significantly — giving you a single number that synthesizes what would take 30 minutes of manual analysis.
Common Mistakes
1. Trading Funding Rate in Isolation
Extreme funding alone is NOT a trade signal. You need confluence:
Funding extreme + on-chain whale activity + OI divergence
Funding resets every 8 hours. A single extreme reading can persist for days before the reversal. Don't front-run it.
2. Ignoring the "Funding Carry" Trade
In trending markets, funding can stay extreme for weeks. During the 2024-2025 bull run, BTC funding was positive for months — shorts who tried to fade it got destroyed. Trend > funding rate.
Rule: Only trade funding extremes AGAINST the trend when you have strong technical confirmation (CHoCH, OB, Wyckoff distribution/accumulation evidence).
3. Confusing Volume with Open Interest
Volume = trades executed (a day trader opening AND closing creates volume but no OI change)
Open Interest = active positions still open (new positions entering the market)
High volume + flat OI = day traders churning, no directional conviction
High volume + rising OI = new money entering with directional conviction
4. Misreading Liquidation Maps
Liquidation levels are probabilistic targets, not guaranteed magnets. Price doesn't ALWAYS sweep liquidation clusters. Use them as confluence, not as standalone signals.
Derivatives data is the X-ray vision of crypto trading. While everyone else sees price and draws trendlines, you see the exact positioning of every leveraged trader, the cost they're paying to hold that position, and the precise levels where their positions will be forcibly closed. This isn't an edge — it's an unfair advantage. Use it wisely.
Lead Technical Systems Architect·Signals & Metrics Desk
Technical systems developer with a mathematical focus on momentum indicators, volatility metrics (ATR), volume profiles, and multi-timeframe filter models.
QUANTITATIVE SUITE // DEEP ALPHA ENGINEACTIVE
BTC/USDT // LIVE SCANNER
CONFLUENCE 35
LIVE SPOT PRICE$83,025.02NO_TRADE
TP2
$88,788.31
+6.95%
TP1
$85,327.13
+2.78%
ENTRY
$83,019.67
ZONE
SL
$81,865.94
-1.39%
Auto-detect Order Blocks, Fair Value Gaps and risk-adjusted DCA ladders in < 5s.
Master multi-timeframe analysis for crypto trading. Learn the 3-timeframe rule, top-down analysis flow, timeframe alignment signals, and how to combine…