I've read dozens of technical analysis guides over the years. Most of them do the same thing: they explain what a moving average is, show you what RSI looks like, and then leave you staring at a chart with absolutely no idea what to do next.
That's not what this guide is.
I'm not going to teach you what indicators are — if you need that foundation, start with our complete crypto technical analysis guide. Instead, I'm going to teach you how to actually sit down in front of a chart and analyze it, step by step, from a blank screen to a fully planned trade.
This is the exact 7-step framework I use every single time I analyze a cryptocurrency chart. It works for Bitcoin, Ethereum, Solana, or any liquid altcoin. It works on a 15-minute chart and on a weekly chart. And by the end of this article, you'll have walked through a real SOL/USDT analysis with me — not a hypothetical textbook example, but a real setup with real numbers.
Let's get into it.
Before You Start: What You Need
Before you open a single chart, make sure you have these four things in place. Skipping any of them is like driving without a seatbelt — you might be fine for a while, but eventually it'll cost you.
1. A Proper Charting Tool
You need a platform that lets you draw trendlines, add indicators, and switch between timeframes easily. Free tools like TradingView work perfectly for beginners. If you're not sure which platform to pick, I've compared all the major options in our best crypto technical analysis tools guide.
2. A Basic Understanding of Indicators
You don't need to be an expert, but you should at least know what a moving average, RSI, and volume bars represent. Our technical analysis indicators guide covers everything a beginner needs. Read that first if terms like "EMA crossover" or "RSI divergence" sound unfamiliar.
3. A Trading Journal
This is the one thing that separates traders who improve from traders who repeat the same mistakes for years. Before you start analyzing charts, open a spreadsheet or notebook where you'll record every trade — your reasoning, your entry, your exit, and what you learned. You don't need anything fancy. A Google Sheet with columns for date, pair, setup, entry, stop-loss, target, result, and notes will do.
!TIPGet Our Free Trading Journal Template: We have designed a clean, ready-to-use Google Sheets Trading Journal template that calculates your Win Rate, Risk-Reward Ratio, and monthly PnL automatically. Click here to make a copy of the template and start tracking your trades today.
4. Risk Management Rules (Established First)
Decide before you ever look at a chart: how much of your portfolio are you willing to risk on a single trade? For most beginners, the answer should be 1-2% maximum. If you haven't built a risk framework yet, pause here and read our crypto risk management guide. Seriously — technical analysis without risk management is just sophisticated gambling.
The 7-Step Crypto TA Framework
Here's the framework, laid out in the order you should follow every single time. Don't skip steps, don't rearrange them. The sequence matters.

Step 1 — Start with the Higher Timeframe
This is the most important step, and it's the one most beginners skip. They open a 5-minute chart, see a pattern they recognize, and jump into a trade — without ever checking what the bigger picture looks like.
Always begin with the Daily or Weekly chart.
Your job in Step 1 is simple: determine the macro trend. Ask yourself one question: "On the daily chart, is price generally going up, going down, or moving sideways?"
That's it. No indicators yet. No trendlines. Just look at the chart and make a judgment call.
- Uptrend: Price has been making higher peaks and higher valleys over the past few weeks/months.
- Downtrend: Price has been making lower peaks and lower valleys.
- Range: Price is bouncing between roughly the same high and low points.
Here's the guideline I wish someone had told me when I started:
For beginners: If the Daily chart is bearish, do not look for longs on the 15-minute chart.
It sounds obvious, but you'd be amazed how beginner traders fight the higher timeframe trend. The 15-minute chart might show a beautiful bullish setup — but if the daily trend is firmly down, that "bullish setup" is most likely just a temporary pullback before the next leg down.
Note for experienced traders: Counter-trend trading (longing oversold dips during a daily downtrend) is possible, but it requires much tighter stop-losses, lower position sizes, and confirmation from leading oscillators (like RSI bullish divergence) or on-chain inflows. If you are starting out, stick to trading in the direction of the daily trend.
This concept is called multi-timeframe analysis, and it's one of the highest-value skills you can develop. The higher timeframe sets the direction; the lower timeframe sets the timing.
Step 2 — Identify Market Structure
Now that you know the macro trend, it's time to get more precise. Market structure is the backbone of technical analysis — it tells you exactly where the trend is and whether it's still healthy.
Here's how to read it:
- Higher Highs (HH) + Higher Lows (HL) = Uptrend. Each peak is higher than the last, and each pullback holds above the previous low.
- Lower Highs (LH) + Lower Lows (LL) = Downtrend. Each rally fails at a lower point, and each dip cuts deeper.
- Equal Highs + Equal Lows = Range. Price is compressing between boundaries — it's coiling up for a move, but the direction isn't clear yet.
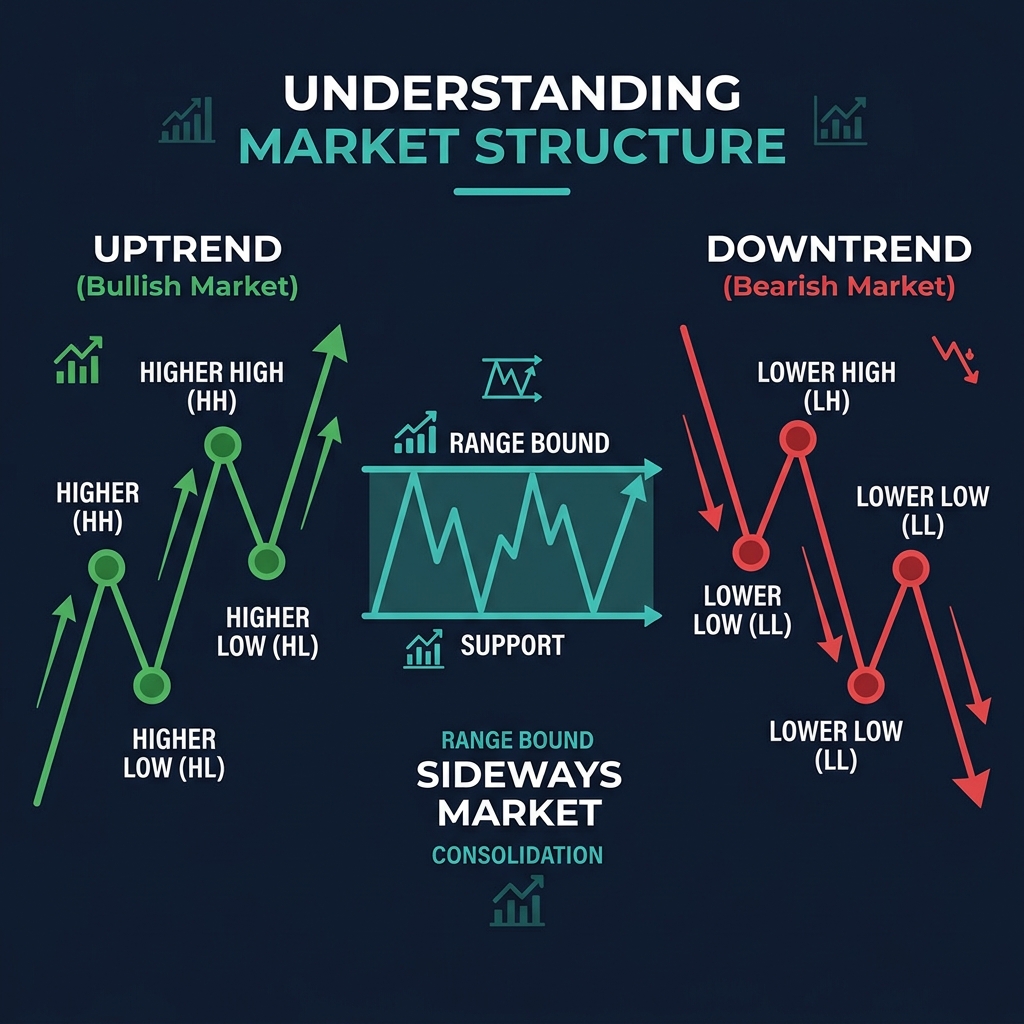
Draw the structure on the chart. I mean this literally — mark the swing highs and swing lows with horizontal lines or small labels. This simple exercise forces you to see the trend objectively instead of projecting what you want to see.
The critical moment to watch for is a structure break — when an uptrend makes a Lower Low for the first time, or a downtrend makes a Higher High. These shifts don't always lead to trend reversals, but they're always worth paying attention to.
For a deeper dive into how support and resistance interact with market structure, check out our support and resistance guide.
Step 3 — Mark Key Support & Resistance Levels
With market structure mapped out, you now know where the important turning points are. Step 3 is about drawing horizontal levels at the prices where you expect buyers or sellers to show up.
Here's how I identify support and resistance zones:
- Previous swing highs and lows. If price reversed at $150 twice in the past month, that's a level worth marking.
- Round numbers. Humans are psychologically attracted to round numbers. Levels like $100, $50,000 (Bitcoin), or $200 often act as magnets.
- High-volume nodes. If you use a volume profile, look for price levels where the most trading activity occurred — these tend to act as strong support or resistance.
Critical rule: Don't draw too many lines.
I see beginner charts that look like a notebook page — lines everywhere, at every minor turning point. That's not analysis, that's noise. Limit yourself to 3-5 key levels on any single timeframe. If a level isn't immediately obvious, it probably isn't important enough to draw.
Also, use zones, not exact prices. Support and resistance aren't laser-precise price points — they're areas. If price bounced at $145, $147, and $143 over several sessions, your support zone is roughly $143-$147, not a single line at $145.
Step 4 — Add Your Indicator Stack (Max 3-4)
Now — and only now — do you add indicators. Notice that we've already done three full steps of analysis using nothing but price and structure. That's intentional. Price is the source; indicators are the commentary.
For beginners, I recommend this stack:
| Indicator | Setting | Purpose |
|---|---|---|
| EMA (Exponential Moving Average) | 20-period and 50-period | Trend direction and dynamic support/resistance |
| RSI (Relative Strength Index) | 14-period | Momentum and overbought/oversold conditions |
| Volume | Default | Confirms the strength of moves |
Why these three?
- The EMA 20 and 50 give you an instant visual read on trend direction. When EMA 20 is above EMA 50, momentum is bullish. When it's below, momentum is bearish. Price bouncing off the EMA 20 in an uptrend is one of the most reliable entry signals in crypto.
- RSI 14 tells you whether momentum is stretched. Above 70 is overbought (price might need to cool off). Below 30 is oversold (sellers may be exhausted). Between 40-60 is neutral territory.
- Volume is the lie detector of technical analysis. A breakout on high volume is credible. A breakout on low volume is suspicious.
You might eventually add a fourth indicator — MACD for momentum confirmation or Bollinger Bands for volatility — but start with three. Learn to read them well before adding more.
"Don't use 10 indicators — more indicators ≠ better analysis." In fact, too many indicators create conflicting signals that lead to analysis paralysis. Three well-understood indicators will outperform ten poorly understood ones every time.
Step 5 — Check Volume Confirmation
Volume gets its own step because it's that important — and that frequently ignored.
Here's what you need to know:
- Breakouts need volume confirmation. If price breaks above a resistance level on 3x the average volume, that breakout has legs. If it breaks out on below-average volume, be suspicious — it might be a fakeout.
- Volume declining in a trend = weakening. If price is making new highs but volume is decreasing with each push, momentum is fading. The trend might be running out of steam.
- Volume spikes at support/resistance = institutional activity. When you see an unusually large volume bar at a key level, big players are active. That often marks a turning point.
Reading volume is less about specific numbers and more about relative comparison. Is today's volume higher or lower than the average of the past 20 bars? That context matters more than the absolute number.
For a more advanced look at how to use volume data to time your entries, read our volume profile guide.
Step 6 — Look for Confluence (3+ Signals Agree)
This is the step that separates breakeven traders from profitable ones.
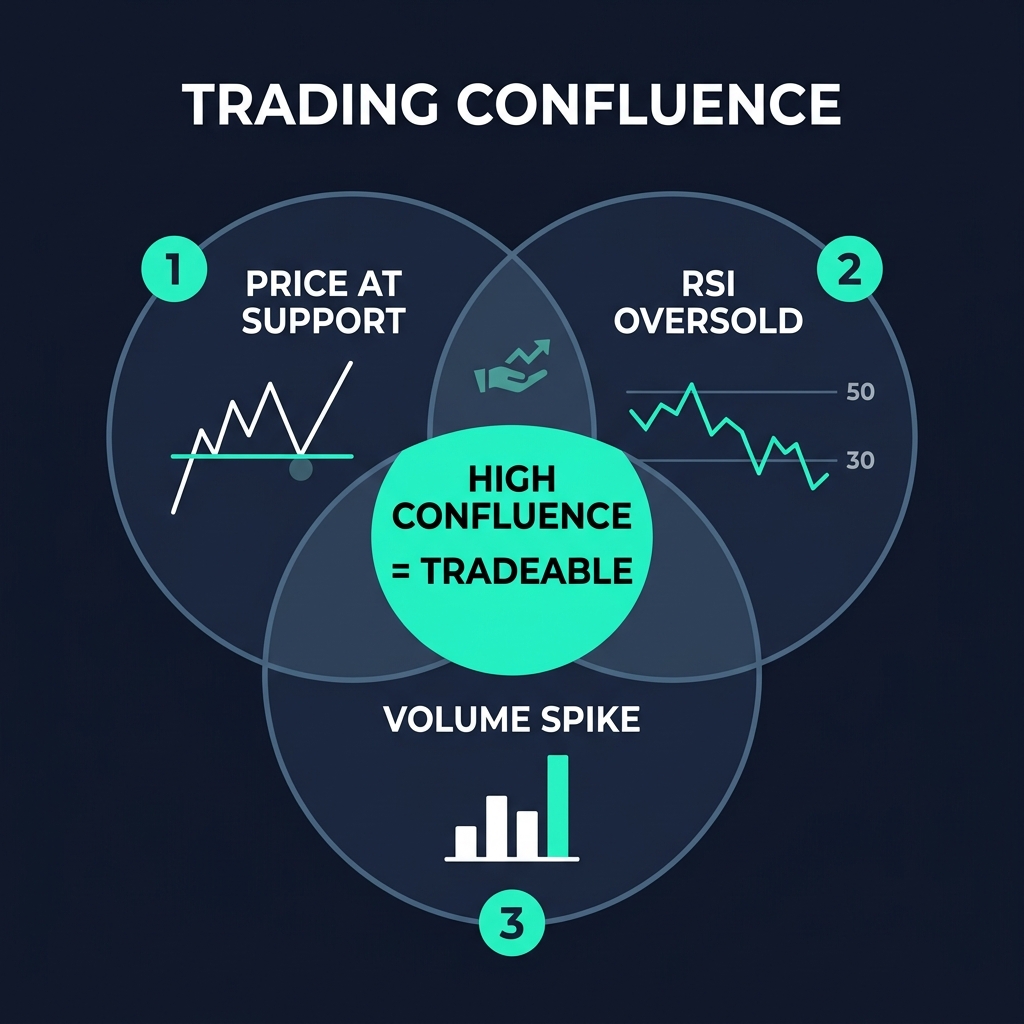
Confluence means multiple, independent signals are pointing in the same direction at the same time. It's the difference between a "maybe" and a "probably."
Here's how I think about it:
- 1 signal = Maybe. Price is at a support level. Interesting, but not enough.
- 2 signals = Interesting. Price is at support and RSI is oversold. Getting warmer.
- 3+ signals = Tradeable. Price is at support, RSI is oversold, and volume is increasing. That's a setup worth risking money on.
The types of confluence I look for:
- Price at a key support/resistance zone (from Step 3)
- Indicator confirmation — RSI oversold/overbought, MACD crossover, price bouncing off an EMA
- Volume confirmation (from Step 5)
- Candlestick pattern — a bullish engulfing or hammer candle at the confluence zone adds conviction (see our candlestick patterns guide)
- Multi-timeframe alignment — the daily and 4-hour charts agree on direction
No single signal is reliable on its own. But when three or four independent signals converge on the same price level and direction, probability shifts meaningfully in your favor.
For advanced confluence techniques, our guide on divergence trading shows how to spot hidden momentum shifts that add another layer of confirmation.
Step 7 — Plan Your Trade Before You Enter
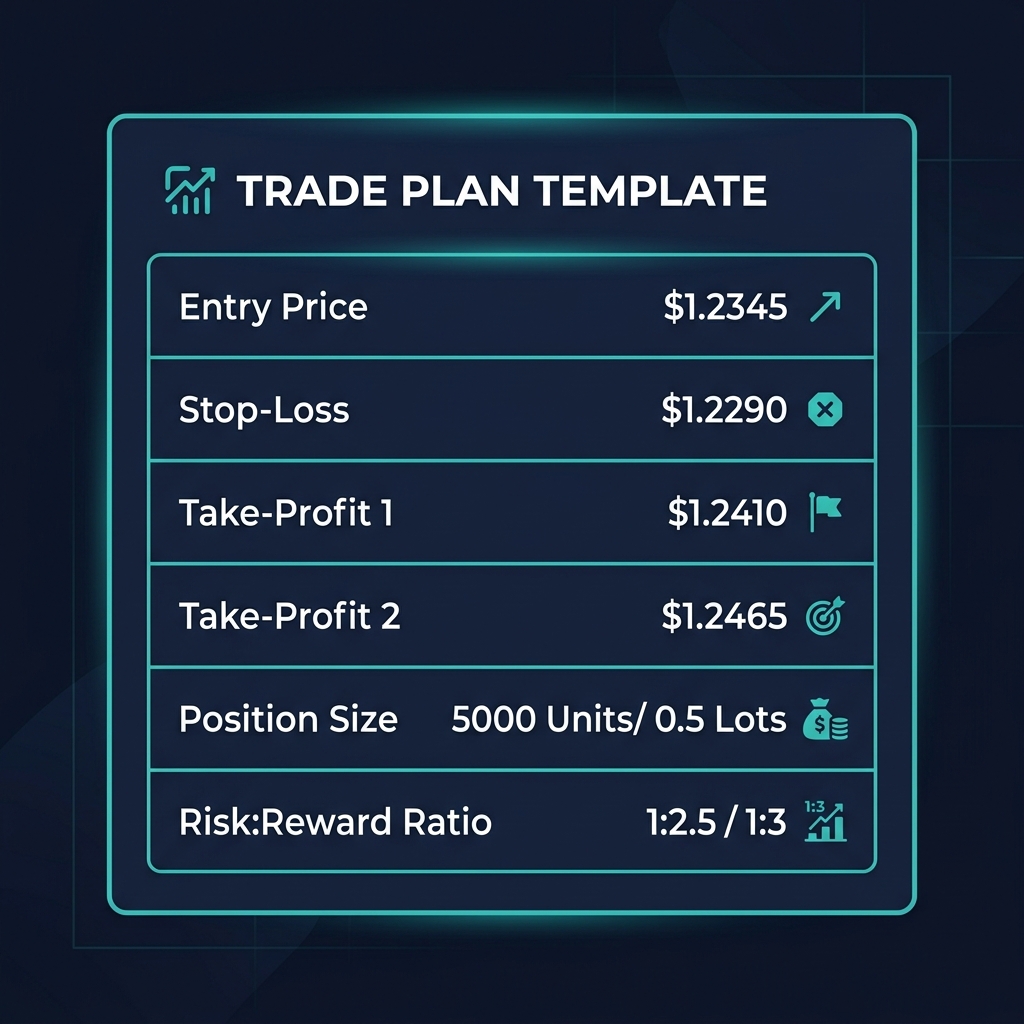
You've done the analysis. You've found confluence. Now — before you touch the buy or sell button — you need a complete trade plan. Every trade needs five elements defined in advance:
1. Entry Price The specific price (or zone) where you'll enter. This should be based on your confluence analysis, not a round number you picked because it "feels right."
2. Stop-Loss The price where you admit you're wrong and exit. For longs, this goes below the support zone that's part of your thesis. For shorts, above the resistance zone. If your support zone is $143-$147 and you're going long, your stop-loss might be at $138 — below the zone with some buffer for wicks.
3. Take-Profit Target(s) Where will you take profits? Usually the next significant resistance level for longs, or the next support for shorts. I like to set two targets: take 50% off at the first target and let the rest ride to the second.
4. Position Size Based on your risk management rules from the preparation phase. If you're risking 2% of a $10,000 portfolio, that's $200 maximum loss. If your stop-loss is $10 below your entry, your position size is $200 ÷ $10 = 20 units.
5. Risk-to-Reward Ratio Calculate it: (Take Profit - Entry) ÷ (Entry - Stop Loss). Minimum 1:2. If the math doesn't give you at least 1:2, the trade isn't worth taking no matter how good the setup looks. I personally aim for 1:3 or better.
Write all five elements down in your trading journal before you enter. If you can't fill in all five, you're not ready to trade — go back to Step 6 and wait for a better setup.
For specific approaches to executing trades based on your timeframe, explore our guides on day trading crypto and swing trading crypto.
Real Example: Analyzing SOL/USDT with This Framework
Theory is great. Application is better. Let's walk through a real SOL/USDT analysis using all seven steps — exactly as I'd do it in real time.
(Note: This example uses price levels and conditions observed at the time of writing to illustrate the framework. Always perform your own current analysis before trading.)
Step 1: Higher Timeframe — Daily Chart
I open the SOL/USDT daily chart and zoom out to the past three months. What do I see?
Price ran from about $95 to $185 over the past eight weeks, with a series of higher highs and higher lows along the way. Over the last two weeks, it's pulled back from the $185 high and is currently trading around $150.
Verdict: The daily trend is bullish. The broader structure is up. This pullback looks like a retracement within an uptrend, not a reversal — at least until the structure tells me otherwise.
Because the daily is bullish, I'll be looking for long setups on the lower timeframes. I'm not interested in shorting right now.
Step 2: Market Structure
Let me map the swing points on the daily chart:
- Swing Low 1: ~$95 (early April)
- Swing High 1: ~$135 (mid-April)
- Swing Low 2: ~$118 (late April) — Higher Low ✓
- Swing High 2: ~$168 (mid-May) — Higher High ✓
- Swing Low 3: ~$140 (late May) — Higher Low ✓
- Swing High 3: ~$185 (recent) — Higher High ✓
Verdict: HH/HL structure is intact. This is a clean uptrend. The structure would break if price dropped below $140 (the most recent higher low). That's my "line in the sand" — if $140 breaks, the uptrend thesis is invalidated.
Step 3: Key Support and Resistance Levels
Based on the structure and previous price action, I'm marking these zones:
| Level | Type | Notes |
|---|---|---|
| $183-$187 | Resistance | Recent swing high, psychological zone near $185 |
| $165-$170 | Resistance | Previous swing high from mid-May, flipped from support |
| $143-$148 | Support | Previous consolidation zone, cluster of wicks |
| $138-$140 | Support | Critical structure level — if this breaks, trend reverses |
| $118-$120 | Support | April swing low, major level |
I'm keeping it to five zones. Price is currently sitting right at the $143-$148 support zone.
Step 4: Indicators
I add my three indicators to the chart:
- EMA 20 (Daily): Currently at ~$158, sloping slightly downward due to the pullback. Price is below the EMA 20, which means short-term momentum has cooled off.
- EMA 50 (Daily): Currently at ~$146, still sloping upward. Price is hovering right around the EMA 50 — this is important because in uptrends, the EMA 50 often acts as dynamic support.
- RSI 14 (Daily): Currently reading 42. Not oversold (below 30), but approaching the neutral-to-low territory that has historically preceded bounces in this uptrend. The previous two pullbacks bounced when RSI hit 38-40.
- Volume: The last several daily candles show declining volume on the sell-off. This tells me selling pressure is fading, not intensifying.
Verdict: EMA 20 is above EMA 50 (bullish alignment still intact). RSI is neutral but approaching the zone where previous bounces occurred. Volume is declining on the pullback — a positive sign.
Step 5: Volume Confirmation
Looking more closely at volume:
- The rally from $140 to $185 was accompanied by steadily increasing volume — that's healthy.
- The pullback from $185 to $150 has seen declining volume — sellers aren't aggressive.
- I'm watching for a volume spike on a green candle near the $143-$148 support. That would signal buyers stepping in with conviction.
Verdict: Volume picture is constructive but not yet confirming a bounce. I need to wait for a volume signal before entering.
Step 6: Confluence Check
Let me count the signals pointing toward a long setup at current levels:
- ✅ Daily uptrend intact (HH/HL structure)
- ✅ Price at horizontal support zone ($143-$148)
- ✅ Price at EMA 50 (dynamic support)
- ✅ RSI approaching the zone where previous bounces occurred (42, heading toward 38-40)
- ⏳ Volume confirmation — not yet, waiting for a spike
That's 3 confirmed confluences with a 4th developing. The missing piece is volume confirmation. In my framework, this is a setup I'm watching — I'll move to Step 7 and have my trade plan ready, but I won't enter until I see either:
- A strong bullish candle (engulfing or hammer) on the daily at this support zone, or
- A volume spike that's 1.5x+ the 20-period average on a green candle.
Step 7: The Trade Plan
Here's my plan, written out before anything happens:
| Element | Detail |
|---|---|
| Pair | SOL/USDT |
| Direction | Long |
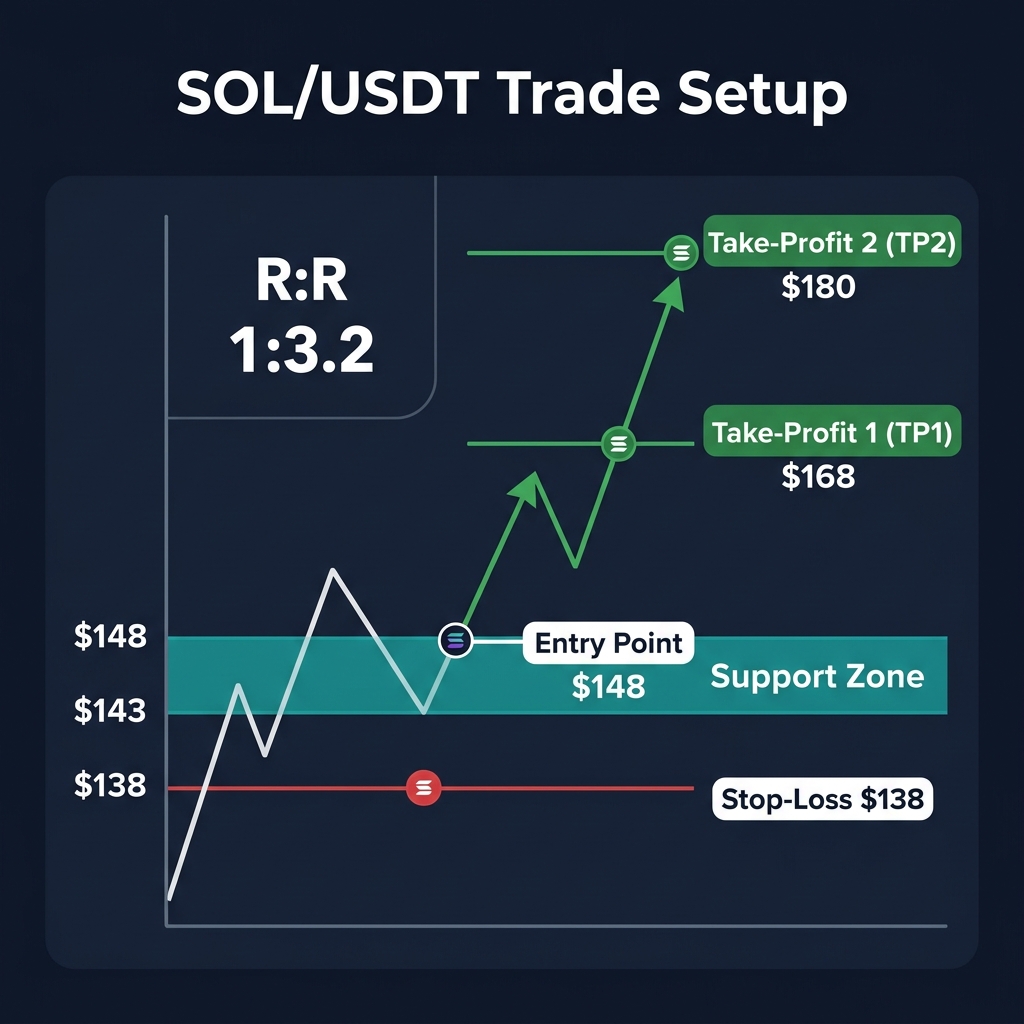
| Entry | $148 (upper end of support zone, entering on daily candle close confirmation) |
| Stop-Loss | $138 (below the $140 structural level with buffer for wicks) |
| Take-Profit 1 | $168 (previous swing high, take 50% off) |
| Take-Profit 2 | $180 (near the all-time high zone, close remaining) |
| Risk per unit | $148 - $138 = $10 |
| Reward to TP1 | $168 - $148 = $20 |
| Reward to TP2 | $180 - $148 = $32 |
| R:R to TP1 | 1:2.0 |
| R:R to TP2 | 1:3.2 |
| Position Size | Risking 2% of $10K portfolio = $200 max loss → $200 ÷ $10 = 20 SOL |
The R:R is 1:3.2 to my second target — well above my 1:2 minimum. The setup has strong confluence. The plan is complete.
Now I wait. If price confirms with a volume spike and a bullish candle close above $148, I execute. If price breaks below $138 first, I scratch the idea entirely and look for new setups. No emotions, no FOMO, no chasing.
This is what "doing technical analysis" actually looks like.
When NOT to Trade (Equally Important)
Knowing when to not trade is a skill that's worth just as much as knowing when to enter. Here are the situations where I close my charts and walk away:
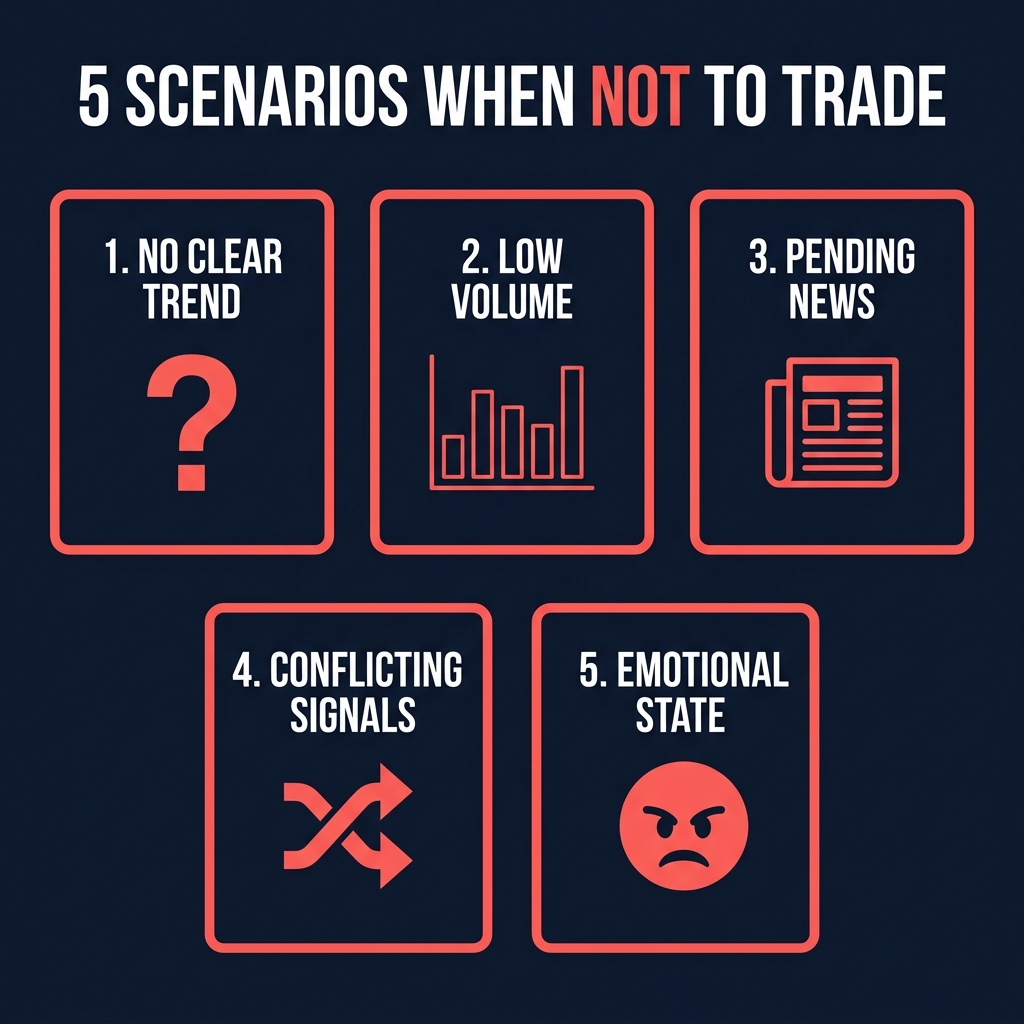
No clear trend on the higher timeframe. If the daily chart is a mess — chopping sideways with no clear structure — there's no edge to be found. Don't force trades in noise.
Low volume or holiday periods. Weekends often have thin liquidity in crypto. Public holidays, end-of-year periods, and pre-halving quiet zones tend to produce erratic price action that doesn't respect technical levels.
Major news events pending. If the Fed is announcing interest rates tomorrow (FOMC), or a major ETF decision is expected, or CPI data is about to drop — technical analysis takes a back seat to macro catalysts. These events can invalidate entire chart setups in seconds. Sit on the sidelines until the dust settles.
Your indicators contradict each other. If RSI says oversold but volume is screaming distribution, or the daily is bullish but the weekly is at major resistance — conflicting signals mean there's no clear edge. When in doubt, stay out.
You're emotionally compromised. Just took a big loss? Feeling the urge to "make it back"? Walk away. The market will be there tomorrow. Revenge trading after a loss is one of the fastest ways to blow up an account.
Checking on-chain data like exchange flows can also help you determine whether it's a good time to be active. Large inflows to exchanges often signal incoming selling pressure, even if the chart looks bullish.
Common Mistakes in Crypto Technical Analysis
I've made every single one of these mistakes. Learn from my tuition payments to the market:
Mistake 1: Analysis Paralysis
You add RSI, MACD, Stochastic, Bollinger Bands, three different EMAs, Ichimoku Cloud, and Volume Profile to a single chart. Half the indicators say buy, half say sell. You freeze. You do nothing — or worse, you override your own analysis with gut feeling.
The fix: Three to four indicators maximum. Master them before adding more.
Mistake 2: Ignoring the Higher Timeframe
You find a beautiful bullish flag on the 15-minute chart. You enter long. Then price dumps because the daily chart was in a clear downtrend and you never checked.
The fix: Always start with Step 1. The higher timeframe is the boss.
Mistake 3: No Stop-Loss
"I'll just watch it and exit manually if it goes against me." Famous last words. Price gaps down while you're asleep and you wake up to a 15% loss instead of the 2% you planned.
The fix: Every trade gets a stop-loss. No exceptions. Set it before you enter.
Mistake 4: Moving Your Stop-Loss
Price approaches your stop-loss, and you panic — "What if it bounces right after stopping me out?" So you move your stop lower. Price continues dropping. You move it again. Now your 2% risk trade is a 10% loss.
The fix: If your stop-loss was placed logically (below a structural level), trust it. Getting stopped out is part of trading. A small loss is infinitely better than a large one.
Mistake 5: FOMO Entries Without a Plan
Bitcoin pumps 8% in an hour. You see green candles on Twitter. You market-buy at the top of the move with no entry plan, no stop-loss, no target. Price retraces, and you're underwater.
The fix: If you didn't analyze it before the move, you're already late. Wait for a pullback, apply the 7-step framework, and enter on your terms — not the market's.
Mistake 6: Not Keeping a Trading Journal
You take 50 trades over three months. Some win, some lose. You "feel" like you're doing okay but you can't point to any specific patterns in your performance. You keep making the same mistakes because you never recorded them.
The fix: Log every trade. Review weekly. Your journal will tell you things about your trading that no indicator ever will — like the fact that you lose money every Monday morning, or that your win rate on SOL setups is twice your win rate on meme coins.
How AI Can Accelerate Your TA Learning
Technical analysis has a steep learning curve. You're essentially training your eyes and brain to recognize patterns, and that takes hundreds of hours of chart time. AI tools can compress that timeline — not by replacing your analysis, but by augmenting it.
Here's how I recommend beginners use AI:
As a "second opinion." After you've completed your own 7-step analysis, run the same chart through an AI analysis tool. Did it spot a support level you missed? Did it flag a divergence you didn't see? That feedback loop accelerates your learning dramatically.
As pattern recognition training. AI tools can scan hundreds of charts in seconds and surface setups that match your criteria. Instead of manually scrolling through 50 altcoin charts, you can focus your time on the handful that actually have valid setups.
As a confluence validator. Platforms like CoinXSight use confluence scoring to quantify how many technical signals agree on a setup. For beginners, this acts like training wheels — it helps you calibrate what "strong confluence" actually looks like until your own judgment catches up. You can explore how this works in our Chart Pro guide.
For a deeper exploration of how AI is reshaping technical analysis — and where its limitations are — read our guide on AI-powered crypto technical analysis.
One important caveat: Don't over-rely on AI tools. If you let AI do all your analysis, you'll never develop the intuition and skill that comes from doing it yourself. Use AI to validate and accelerate your own learning, not to replace it. The goal is to eventually trust your own analysis — AI is the scaffold, not the building.
Combining AI-flagged technical signals with on-chain data like whale activity tracking can give you an additional edge that purely chart-based analysis can't provide.
Frequently Asked Questions
How long does it take to learn crypto technical analysis?
Expect 3-6 months of consistent practice before you feel confident reading charts on your own. The framework itself is simple — you can memorize the 7 steps in a day. But developing the pattern recognition and judgment to apply it well takes screen time. I recommend analyzing at least one chart per day for the first 90 days, even if you don't trade any of them. Journal your analysis and review it a week later to see how accurate your reads were.
What's the best timeframe for beginners?
The Daily chart. It's slow enough that you have time to think, the signals are cleaner (less noise than lower timeframes), and you don't need to sit in front of your screen all day. Once you're consistently profitable on the daily, you can start layering in the 4-hour chart for more precise entries. Avoid the 1-minute and 5-minute charts as a beginner — they'll eat you alive. Our beginners' guide to crypto technical analysis goes into much more detail about choosing your starting timeframe.
Do I need paid tools to do technical analysis?
No. TradingView's free tier gives you everything you need to follow this 7-step framework: charting, indicators, drawing tools, and multi-timeframe views. The main limitations on free plans are usually the number of indicators per chart (typically 2-3) and the number of alerts you can set. If you find yourself needing more, a basic paid plan is worth it — but start free and upgrade only when you hit actual limitations, not before.
How many indicators should I use?
Three to four, maximum. My recommended beginner stack is EMA 20/50, RSI 14, and Volume. These cover trend direction, momentum, and confirmation — the three pillars you need. Adding a fourth (like MACD or Bollinger Bands) is fine once you're comfortable, but resist the temptation to add more. Every indicator you add increases the chance of conflicting signals.
Does technical analysis work for all cryptocurrencies?
TA works best on liquid cryptocurrencies with high trading volume — think Bitcoin, Ethereum, Solana, and the top 20-30 by market cap. For small-cap or micro-cap tokens with thin order books, technical levels break easily because a single large order can move the price significantly. If the daily volume is below $5-10 million, I'd be cautious about relying heavily on TA. For low-liquidity tokens, on-chain analysis and fundamental research become more important than chart patterns.
Should I use AI tools for technical analysis?
Yes — as a supplement, not a substitute. AI tools are excellent at scanning large numbers of charts, flagging confluences you might miss, and providing a "second opinion" on your analysis. They're especially valuable for beginners who are still calibrating their pattern recognition. But never blindly follow an AI signal without understanding why it was generated. The best approach is: do your own analysis first, then compare it to what the AI suggests. Over time, you'll need the AI less as your own skills develop.
What's the most important indicator for beginners?
If I could only use one indicator, I'd choose the EMA 50 on the daily chart. It tells you the trend direction (slope), acts as dynamic support/resistance (price bounces off it in trending markets), and is widely watched by other traders (self-fulfilling prophecy). Price above the EMA 50 = generally bullish. Price below = generally bearish. It's simple, visual, and effective. Layer in RSI and volume once you're comfortable with the EMA, but start there.
Your Next Steps
You now have a complete, actionable framework for analyzing any cryptocurrency chart. Here's what I'd recommend doing right now:
- Open your charting tool and pull up the BTC/USDT daily chart.
- Walk through all 7 steps on your own. Don't skip any.
- Write down your analysis in your trading journal — even if you don't plan to trade.
- Do this every day for 30 days. Pick a different coin each day. By day 30, the framework will feel natural.
Remember: technical analysis isn't about predicting the future. It's about identifying probabilities and managing risk. No setup works 100% of the time. But if you consistently find high-confluence setups, plan your trades properly, and manage your risk — the math works in your favor over time.
Want to dive deeper into any part of this framework? Start with our comprehensive crypto technical analysis guide, which covers the broader landscape of TA principles, or explore specific indicators using the guides linked throughout this article.
The charts are waiting. Go analyze something.
!WARNINGFinancial Disclaimer: Trading cryptocurrencies involves substantial risk and may not be suitable for every investor. The high volatility of crypto assets can result in significant financial losses. The information provided in this guide is for educational purposes only and does not constitute financial, investment, or trading advice. Always conduct your own research, practice proper risk management, and consult with a licensed financial advisor before making any investment decisions.
About the Author
Sarah Mitchell is a Technical Analysis Specialist at CoinXSight, focusing on combining traditional chart patterns with modern on-chain metrics and machine learning algorithms. With over seven years of active trading experience, she specializes in swing trading strategies and trend-following frameworks. Connect with her on LinkedIn or follow her latest market updates on Twitter/X.