Swing Trading Crypto: The Complete Strategy Guide for 2026
Master crypto swing trading with AI-powered signal generation, EMA crossover strategies, and risk management. Step-by-step setups using CoinXSight with real trade examples.
MC
Marcus ChenSenior Quantitative Strategist·May 17, 2026 · 12 min read · Updated Oct 6
What Is Swing Trading and Why Does It Work in Crypto?
Swing trading captures price movements that develop over 2-14 days. Unlike day trading (which requires constant screen time) or investing (which requires months of patience), swing trading fits the rhythm of how crypto markets actually move — short bursts of momentum followed by consolidation periods.
Crypto is uniquely suited for swing trading because of three structural features:
High volatility: Crypto routinely produces 5-20% swings within a week — moves that take months in traditional markets
24/7 markets: Swings develop continuously, giving traders more opportunities than stock markets' limited hours
Narrative-driven cycles: Token narratives (AI, L2, meme seasons) create predictable momentum cycles that swing traders can exploit
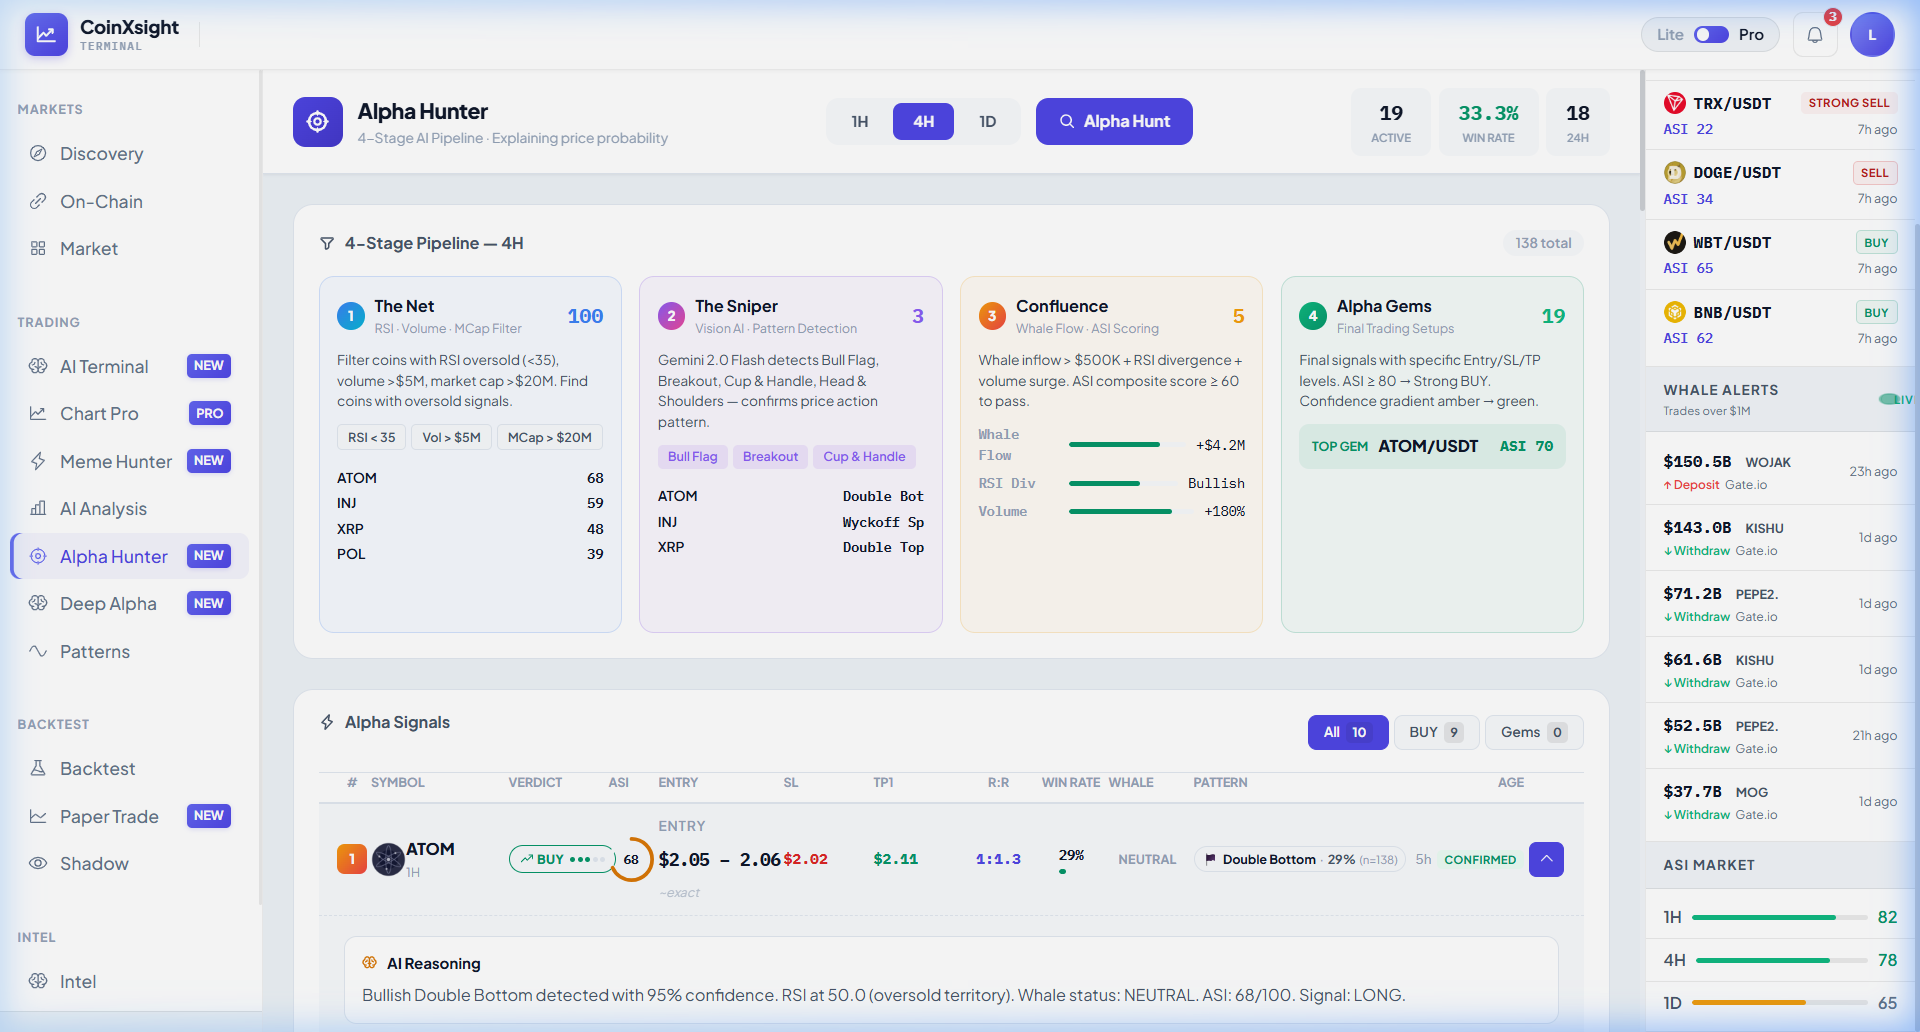
The core principle is simple: identify a high-probability turning point, enter with a clear plan, and exit before the momentum exhausts. AI tools like CoinXSight's Alpha Hunter dramatically improve the identification phase by scanning 138+ tokens simultaneously across multiple timeframes and pattern types.
The 3 Core Swing Trading Strategies
Strategy 1: EMA Crossover Pullback (Most Reliable)
This strategy enters when price pulls back to key Exponential Moving Averages during an established trend. It's the bread-and-butter of swing trading because it enters with the trend, not against it.
Rules:
Trend filter: Price must be above EMA 89 AND EMA 200 on the 4H chart (bullish trend confirmed)
Entry trigger: Price pulls back to EMA 34 and bounces (first green candle closing above EMA 34)
Stop-loss: Below the pullback low (typically 2-4% below entry)
Target: Previous swing high (TP1) and 1.618 Fibonacci extension (TP2)
How to identify this on CoinXSight:
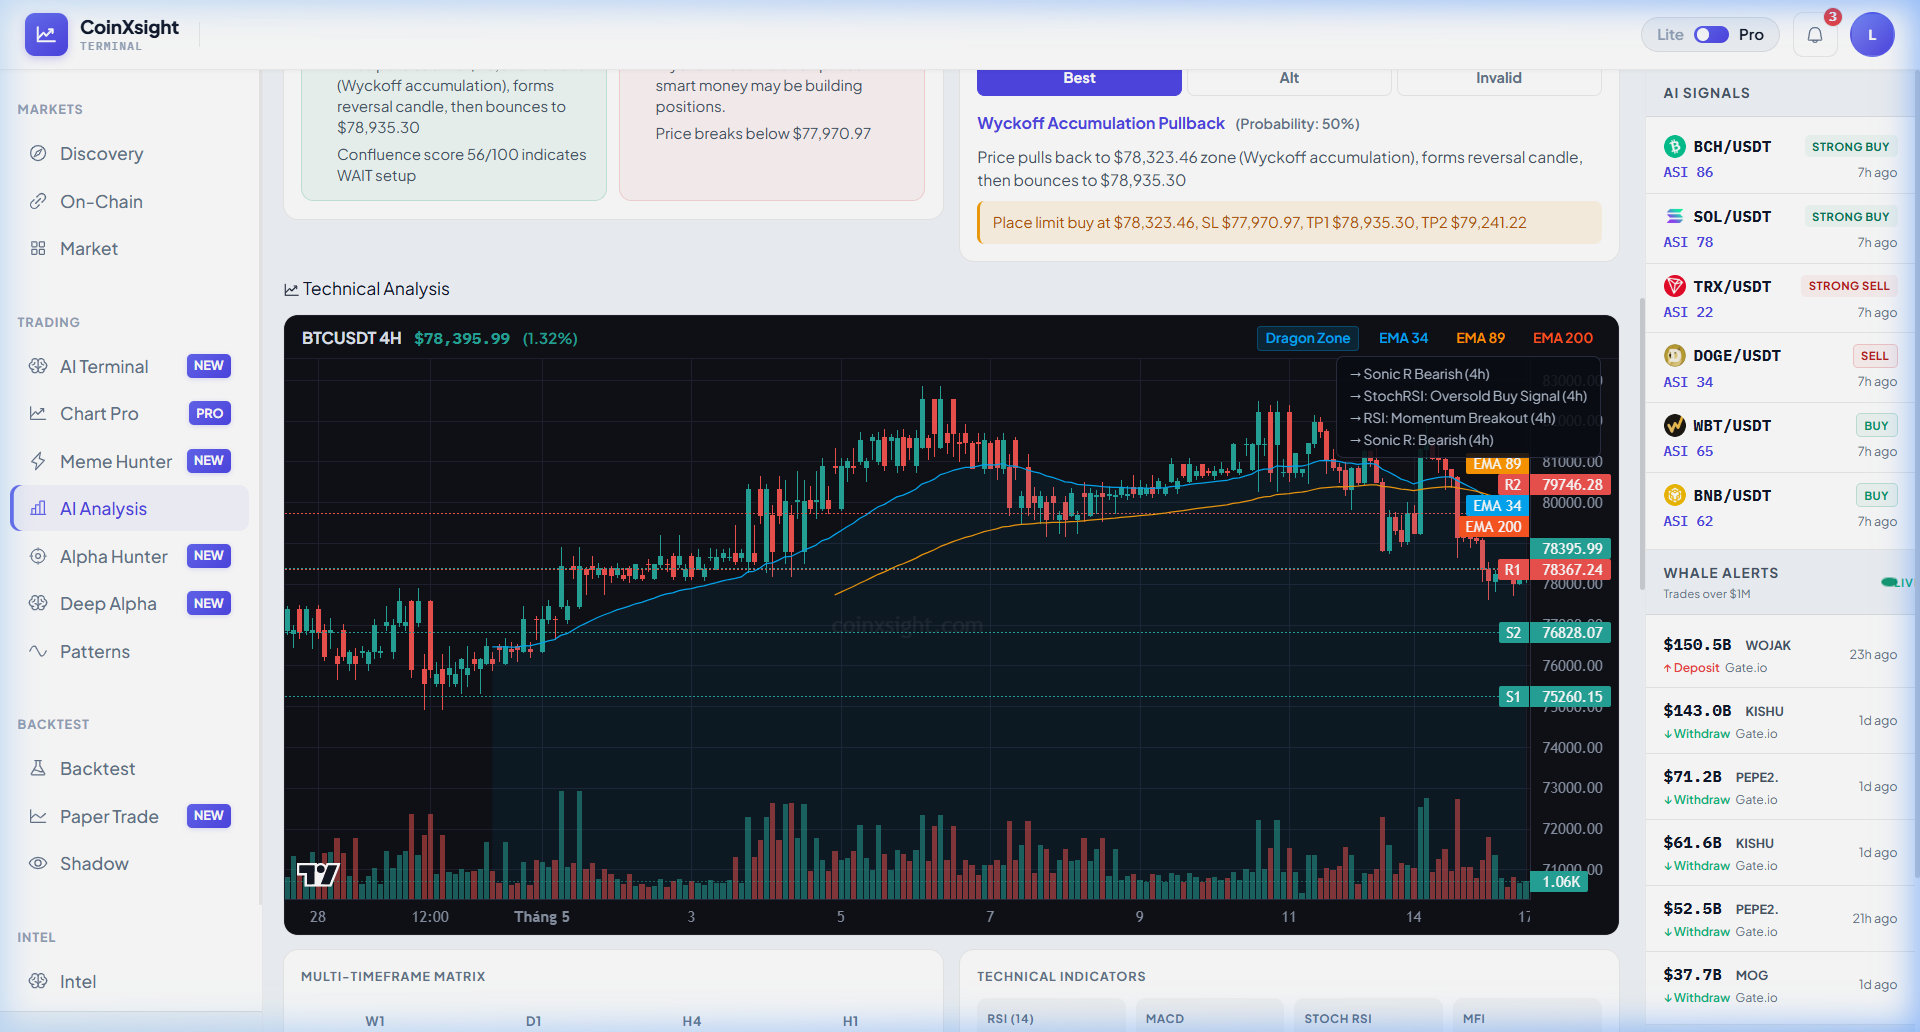
The AI Analysis chart shows BTC in a Dragon Zone — the area between EMA 34 and EMA 89. When price enters this zone during a pullback, it's a potential swing entry area:
Current setup: BTC at $78,395, sitting right at EMA 34 with EMA 89 above at ~$80,000
StochRSI Oversold Buy Signal (4h): The AI has flagged the oscillator as oversold — supporting a bounce
RSI Momentum Breakout (4h): Momentum is attempting to turn positive
Problem: Price is BELOW EMA 89 and EMA 200, meaning the trend is actually bearish — this setup does NOT qualify for the EMA Crossover Pullback strategy
Action: WAIT for price to reclaim EMA 89 before this strategy becomes valid
This illustrates a critical point: the AI flags setups, but your strategy rules filter them. Not every AI signal matches your specific strategy criteria.
This strategy enters after price breaks above a significant resistance level, waits for a retest of that level as new support, and enters on confirmation of the retest holding.
Rules:
Breakout: Price closes above resistance with volume >1.5x 20-period average
Wait for retest: Price pulls back to the broken resistance (now support)
Entry trigger: First candle that closes above the retest level with positive RSI momentum
Stop-loss: Below the retest low (the old resistance level)
Target: Measured move (height of the previous range projected from breakout point)
How to find breakout candidates:
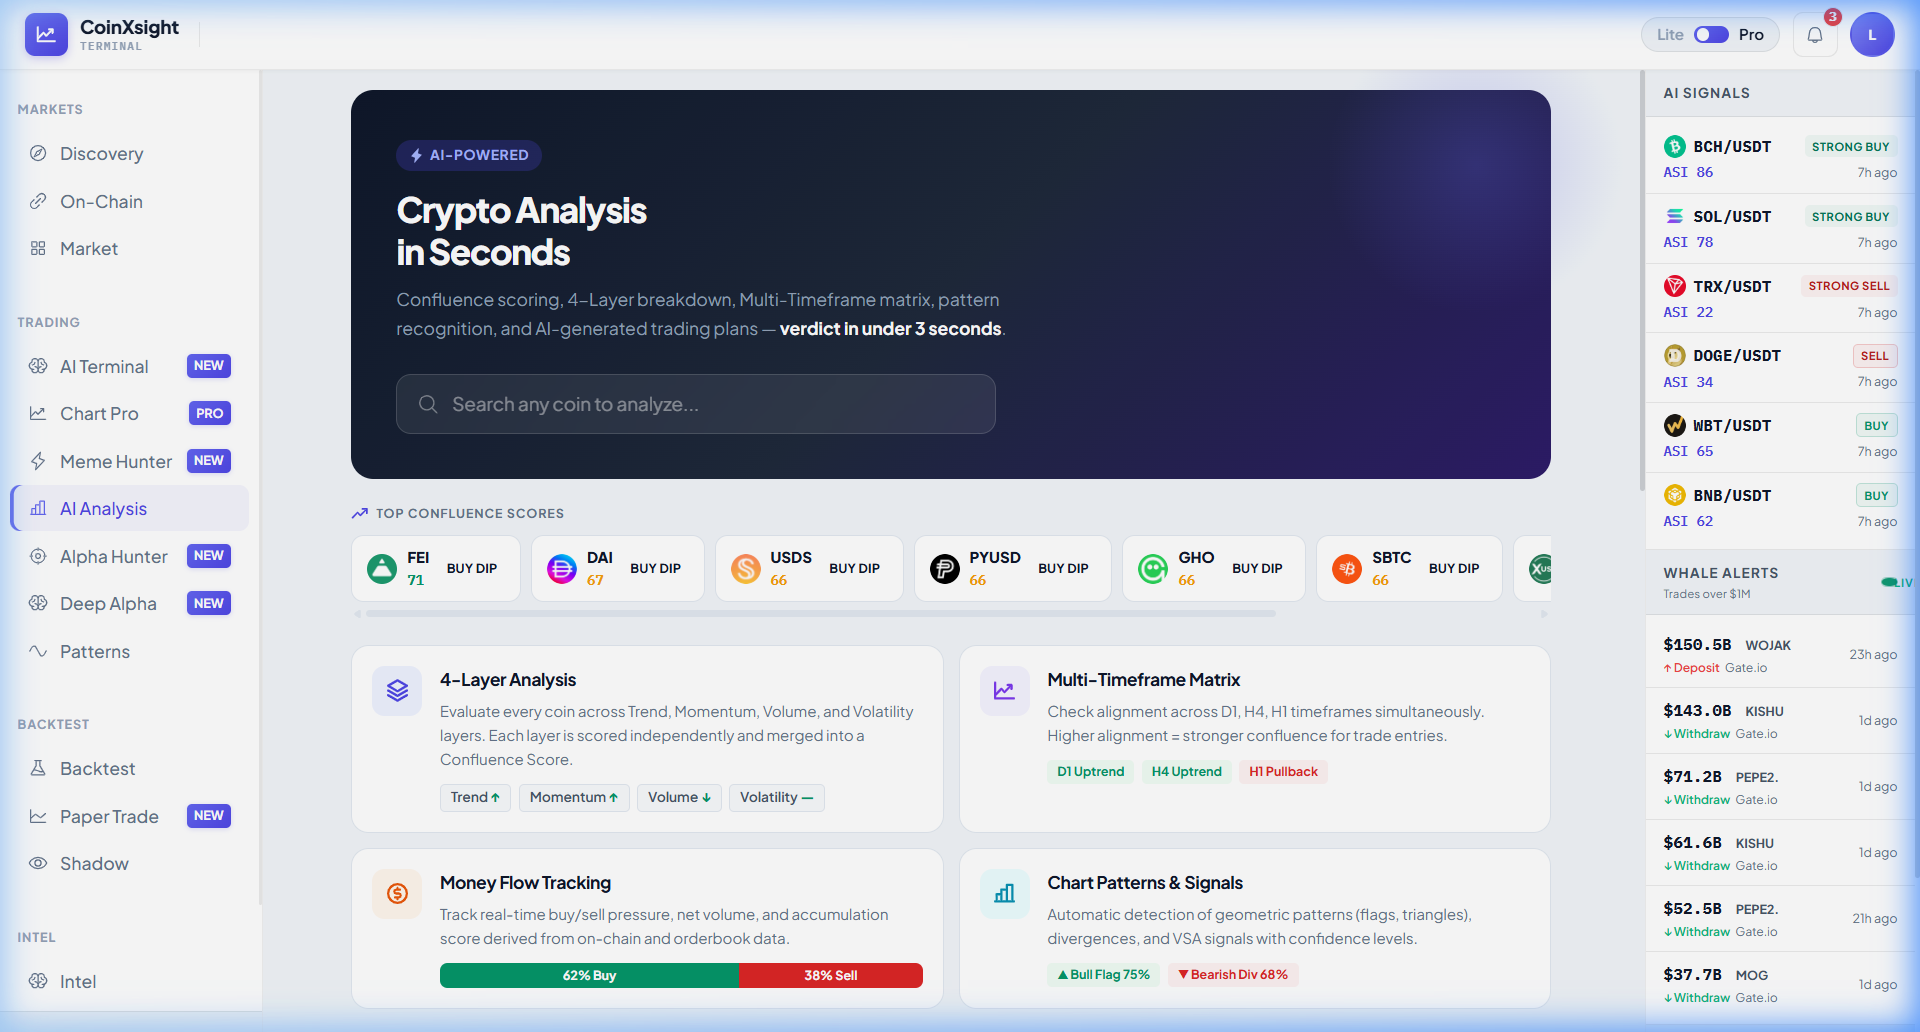
The AI Analysis search page shows Chart Patterns detection in real-time:
Bull Flag 75% confidence: A confirmed bull flag pattern suggests a continuation breakout is forming
Bearish Divergence 68%: Conflicting signal — price making higher highs while momentum makes lower highs
For breakout trading, focus on tokens where the Bull Flag or Breakout pattern is detected with confidence above 70% and the Momentum layer is positive (not negative as shown here).
Strategy 3: AI Signal Swing (CoinXSight-Specific)
This strategy uses Alpha Hunter's AI pipeline directly as a signal source, filtering for swing-appropriate setups.
Rules:
Source: Alpha Hunter signals with ASI ≥65
Pattern filter: Only Double Bottom, Wyckoff Spring, or Bull Flag patterns (these have the highest swing trade success rates)
Whale filter: Whale Activity must be NEUTRAL or ACCUMULATING (not distributing)
Entry: At the AI's recommended entry level
Stop-loss: At the AI's recommended SL level
Target: AI's TP1 (close 50%) and TP2 (close remaining 50%)
Check AI Analysis chart → Verify key levels and EMA positioning
Check On-Chain → Whale activity must not contradict signal direction
Calculate position size using 1-2% risk rule
Set entry, SL, and TP levels in your exchange
Phase 4: Active Management (During trade, 2 minutes/day)
After entry: Monitor once daily — check if ASI score is improving or deteriorating
After TP1 hit: Move SL to breakeven, let TP2 run
Time limit: If no TP or SL after 10 trading days, reassess and likely close
Backtesting a Swing Strategy
Before trading any strategy with real capital, validate it through backtesting.
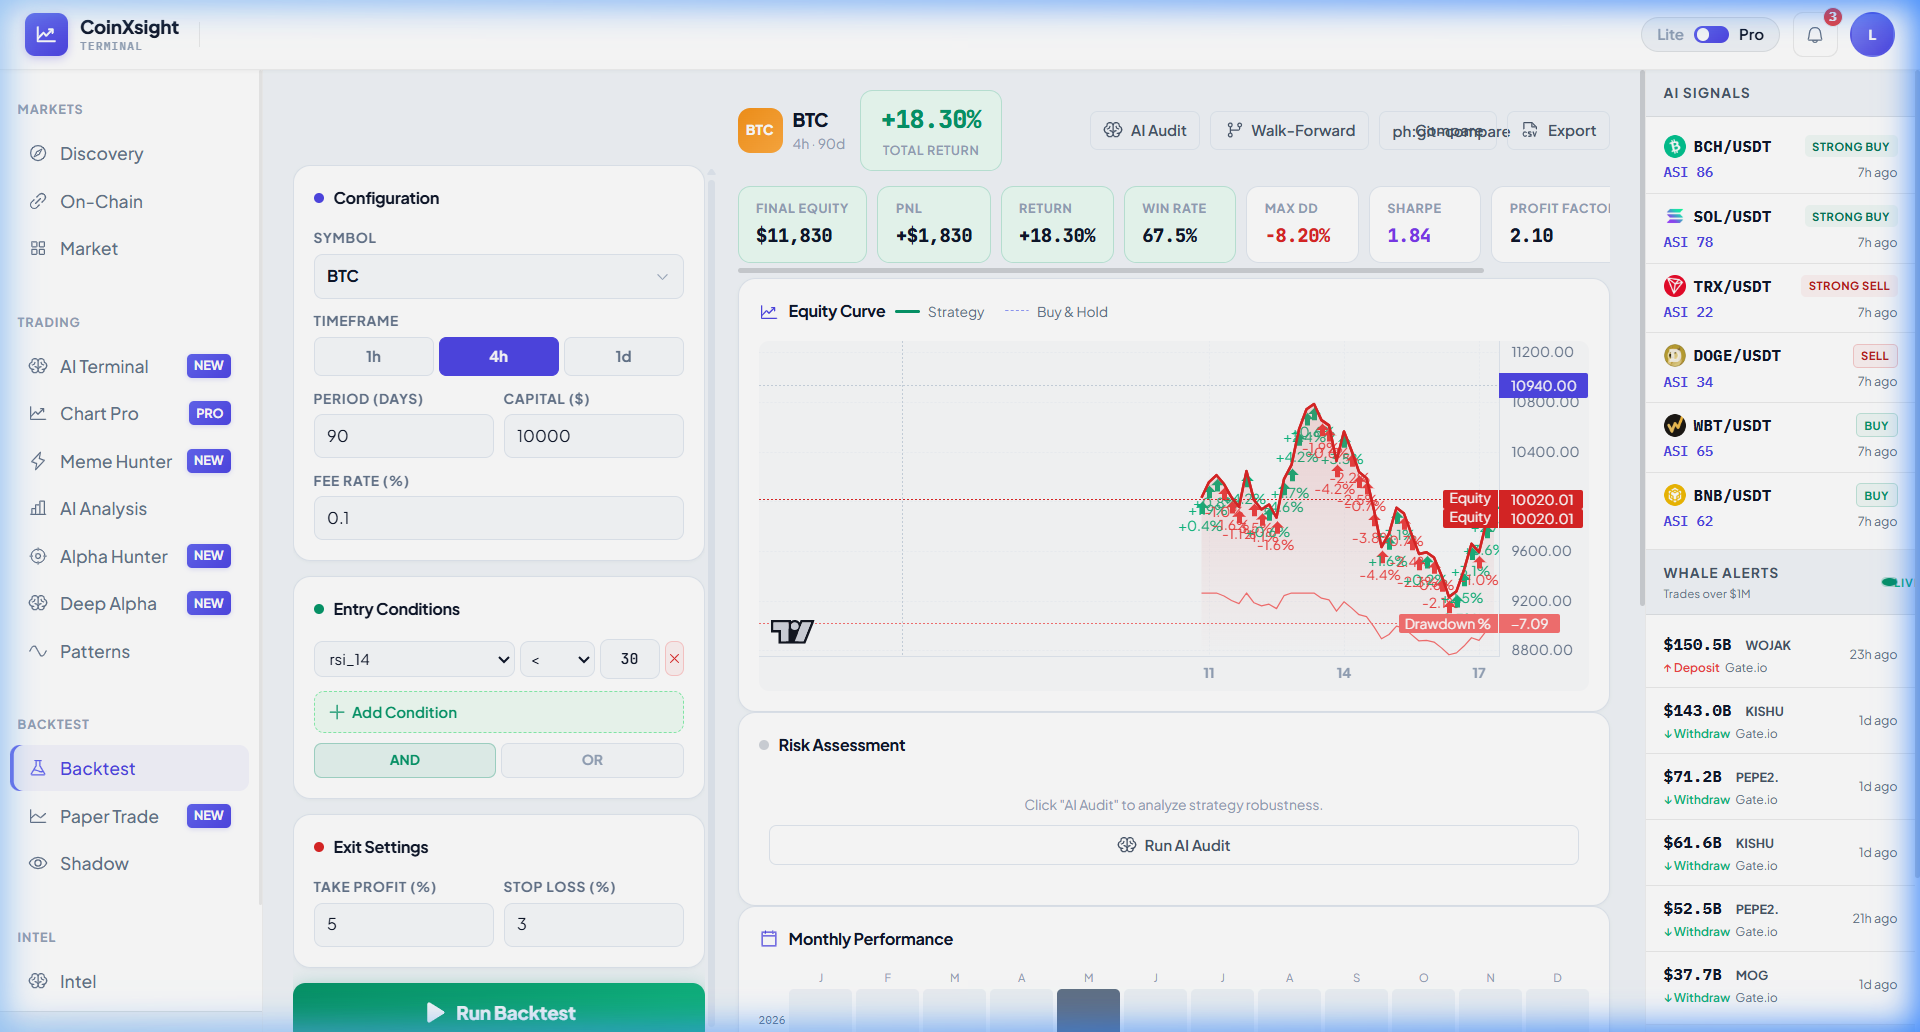
RSI Oversold Swing Strategy — Backtest Results
This backtest validates a simple RSI oversold entry — buying when RSI drops below 38 on BTC 4H:
Why these results are encouraging:
67.5% win rate with 2.10 profit factor means winners are significantly larger than losers
-8.20% max drawdown is acceptable — most professional funds target max DD below 15%
1.84 Sharpe ratio indicates excellent risk-adjusted returns (above 1.5 is considered very good)
+18.30% over 90 days annualizes to approximately 73% per year — strong performance
What the equity curve reveals:
The strategy outperformed simple Buy & Hold. The curve shows concentrated winning periods followed by minor drawdowns. The annotated percentage labels on trades show individual trade outcomes — mostly in the +2% to +7% range with occasional -2% to -4% losses.
Your optimization path:
Start with this validated baseline
Add EMA trend filter (only buy when price is above EMA 200) → Should improve win rate
Add whale flow filter (only buy when on-chain is not net selling) → Should reduce false signals
Re-backtest after each addition → Only keep changes that improve all 4 metrics
What's the ideal timeframe for crypto swing trading?
The 4H chart is the primary timeframe — it balances signal quality with sufficient opportunities. Use the Daily chart for trend direction (macro filter) and the 1H chart for precise entry timing. CoinXSight's Alpha Hunter uses 4H as its primary scanning timeframe.
How many tokens should I monitor for swing trades?
Focus on 15-20 tokens with sufficient liquidity (>$5M daily volume). CoinXSight's Alpha Hunter automatically scans 138+ tokens and filters them down to actionable signals, saving you from manually monitoring dozens of charts.
What win rate should I expect?
A well-designed swing strategy should achieve 55-70% win rate with a profit factor above 1.5. The backtested RSI strategy showed 67.5% — this is realistic and achievable. Don't expect 80%+ win rates; those usually indicate overfitting.
Should I use leverage for swing trades?
For beginners: No. Leverage amplifies losses as much as gains, and holding leveraged positions overnight exposes you to liquidation risk. For experienced traders: Maximum 2x leverage on high-conviction setups (ASI 80+), with stop-losses that account for the leveraged risk.
How do I manage trades during sleep?
Set your stop-loss and take-profit orders on the exchange before sleeping. A properly constructed swing trade doesn't require real-time monitoring — the orders will execute automatically. Check positions once in the morning and once in the evening.
Can I combine swing trading with day trading?
Yes, but use separate capital allocations. Swing positions: 50-70% of portfolio. Day trading: 20-30% of portfolio. Cash reserve: 10-20%. Never use the same capital for both — a swing trade might need the capital for days, conflicting with intraday opportunities.
Summary
Swing trading is the optimal strategy for most crypto traders because it captures meaningful price movements without requiring constant screen time. The three core strategies — EMA Crossover Pullback, Breakout + Retest, and AI Signal Swing — cover the most common high-probability setups in crypto markets.
CoinXSight's integrated modules provide the complete toolkit: Alpha Hunter for AI-filtered signal generation, AI Analysis for multi-layer validation, the On-Chain module for smart money confirmation, the Chart with AI overlays for visual confirmation, and the Backtest module for strategy validation before risking real capital.
The key success factors are systematic execution (following rules without emotional deviation), strict risk management (1-2% per trade, correlated exposure limits), and continuous improvement through backtesting and performance tracking.
Master risk management for crypto trading. Learn position sizing formulas, stop-loss strategies, and how CoinXSight's Portfolio module tracks your risk…