Stochastic RSI Crypto: How to Use StochRSI for Precise Entry Timing
Master Stochastic RSI for crypto trading. Learn StochRSI formula, overbought/oversold zones, crossover signals, and how CoinXSight uses it in Confluence Scoring.
JV
Julian VanceLead Technical Systems Architect·May 22, 2026 · 10 min read · Updated Oct 6
Stochastic RSI (StochRSI) applies the Stochastic oscillator formula to RSI values instead of raw price, creating a momentum-of-momentum indicator that ranges from 0 to 1 (or 0 to 100). It answers a question regular RSI can't: is RSI itself overbought or oversold relative to its recent range?
StochRSI reacts faster than standard RSI, generating more frequent signals — which means more entry opportunities but also more false alarms. This guide shows you when to trust those signals and when to filter them. For a complete overview of all crypto indicators and how they work together, see our Cryptocurrency Technical Analysis Indicators guide.
What Is Stochastic RSI and How Does It Differ from RSI?
Standard RSI measures the speed of price changes. StochRSI takes the RSI output and applies the Stochastic formula to it, measuring where the current RSI sits relative to its own high-low range over a lookback period.
The Formula
StochRSI = (Current RSI - Lowest RSI over N periods) / (Highest RSI over N periods - Lowest RSI over N periods)
N is typically 14 (matching RSI's default period)
%K line = StochRSI smoothed with a 3-period SMA
%D line = 3-period SMA of %K (the signal line)
The indicator was developed by Tushar Chande and Stanley Kroll in their 1994 book The New Technical Trader, specifically to solve RSI's problem of staying in neutral territory during sustained trends.
RSI vs. StochRSI — Key Differences
Dimension
RSI
StochRSI
Range
0-100
0-1 (or 0-100)
Speed
Moderate
Fast — more sensitive
Signal frequency
Lower (fewer trades)
Higher (more opportunities)
False signals
Fewer
More — needs filtering
Best use
Trend strength
Entry timing within a trend
Overbought
> 70
> 0.80
Oversold
< 30
< 0.20
CoinXSight module
Deep Alpha momentum
Confluence Scoring — Momentum Layer
💡 Think of it this way: RSI tells you "momentum is bullish." StochRSI tells you "momentum is bullish AND right now is a good entry point within that bullish momentum."
How to Read StochRSI — The 3 Core Signals
Signal 1: Overbought/Oversold Zones
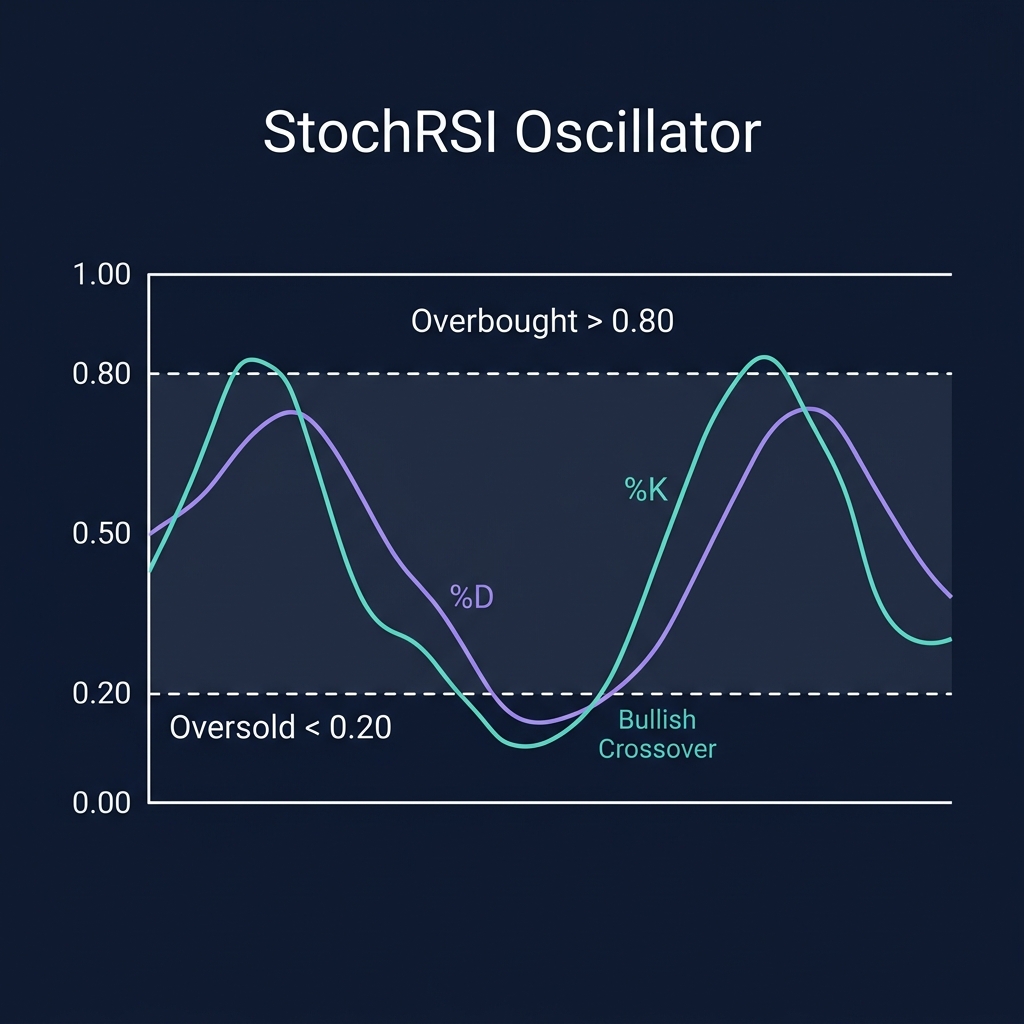
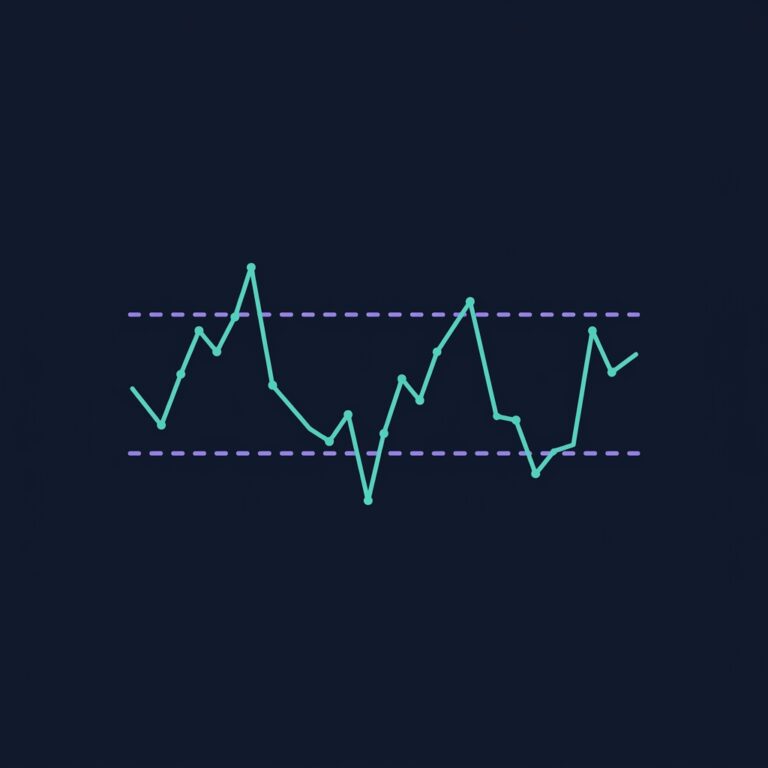
StochRSI > 0.80 = Overbought (RSI is near the top of its recent range)
StochRSI < 0.20 = Oversold (RSI is near the bottom of its recent range)
Unlike RSI where overbought doesn't mean "sell now," StochRSI extremes are more actionable because they measure exhaustion within momentum itself.
Decision rule: StochRSI entering the oversold zone (< 0.20) in an uptrend = prepare for long entry. Wait for the crossover confirmation (Signal 2) before entering.
Signal 2: %K/%D Crossovers
The most traded StochRSI signal:
Bullish crossover: %K crosses above %D while both are below 0.20 → Buy signal
Bearish crossover: %K crosses below %D while both are above 0.80 → Sell signal
Crossovers in neutral territory (0.20-0.80) are weaker and should be filtered with trend context.
Decision rule: Only trade crossovers that happen inside the overbought or oversold zones. Crossovers in the middle zone have a 45% completion rate — barely better than a coin flip.
Signal 3: StochRSI Divergences
When price makes a new high but StochRSI makes a lower high (or vice versa), a reversal may be developing.
StochRSI divergences are faster than RSI divergences, giving you earlier warning — but also more prone to false signals. Confirm with MACD or volume before acting.
3 Real Trading Scenarios with StochRSI
Scenario 1: SOL Oversold Bounce — May 6, 2026
CoinXSight's Chart Pro showed SOL/USDT on the 4H timeframe:
Price: $168.40, in an uptrend (above 21 EMA)
RSI: 44 — neutral, no clear signal
StochRSI: 0.08 — deeply oversold
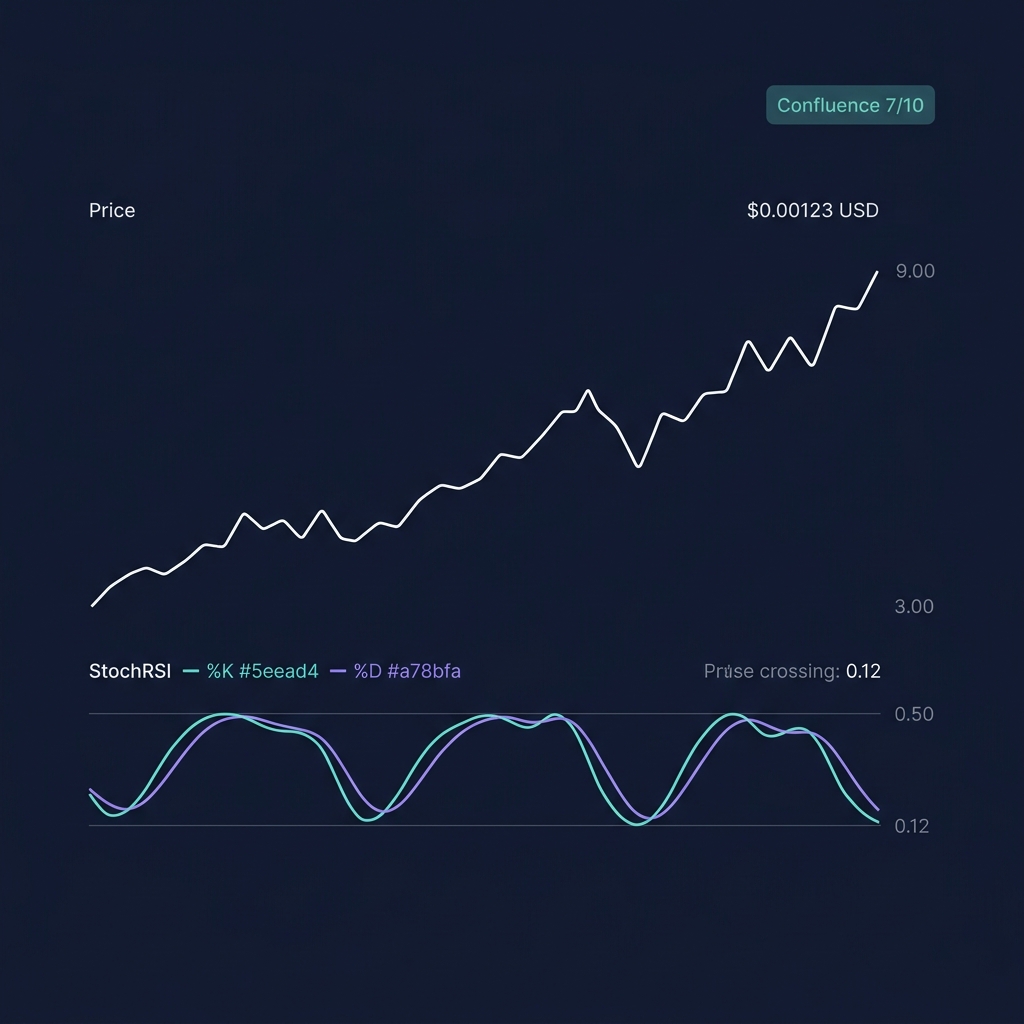
%K/%D: Bullish crossover forming at 0.12
Action: RSI alone gave no signal. StochRSI identified this as a momentum dip within the uptrend. Long entry at $169, stop below $164 (swing low), TP at $178.
Result: SOL rallied to $179.20 within 3 days (+6.0%). The StochRSI crossover correctly identified the pullback exhaustion point.
Lesson: In confirmed uptrends, StochRSI < 0.15 with a bullish crossover is a high-probability entry signal.
Example — SOL StochRSI Signal on CoinXSight Chart Pro (May 2026)
SOL was trending above the 21 EMA. RSI read 44 — neutral, giving no entry signal. But StochRSI dropped to 0.08 and the %K line crossed above %D at 0.12. CoinXSight's Confluence Score showed 7/10 — trend, volume, and momentum layers aligned. Price bounced from $168 to $179 in 72 hours.
Scenario 2: BTC False Signal — April 28, 2026
StochRSI generated a bullish crossover on BTC/USDT 4H:
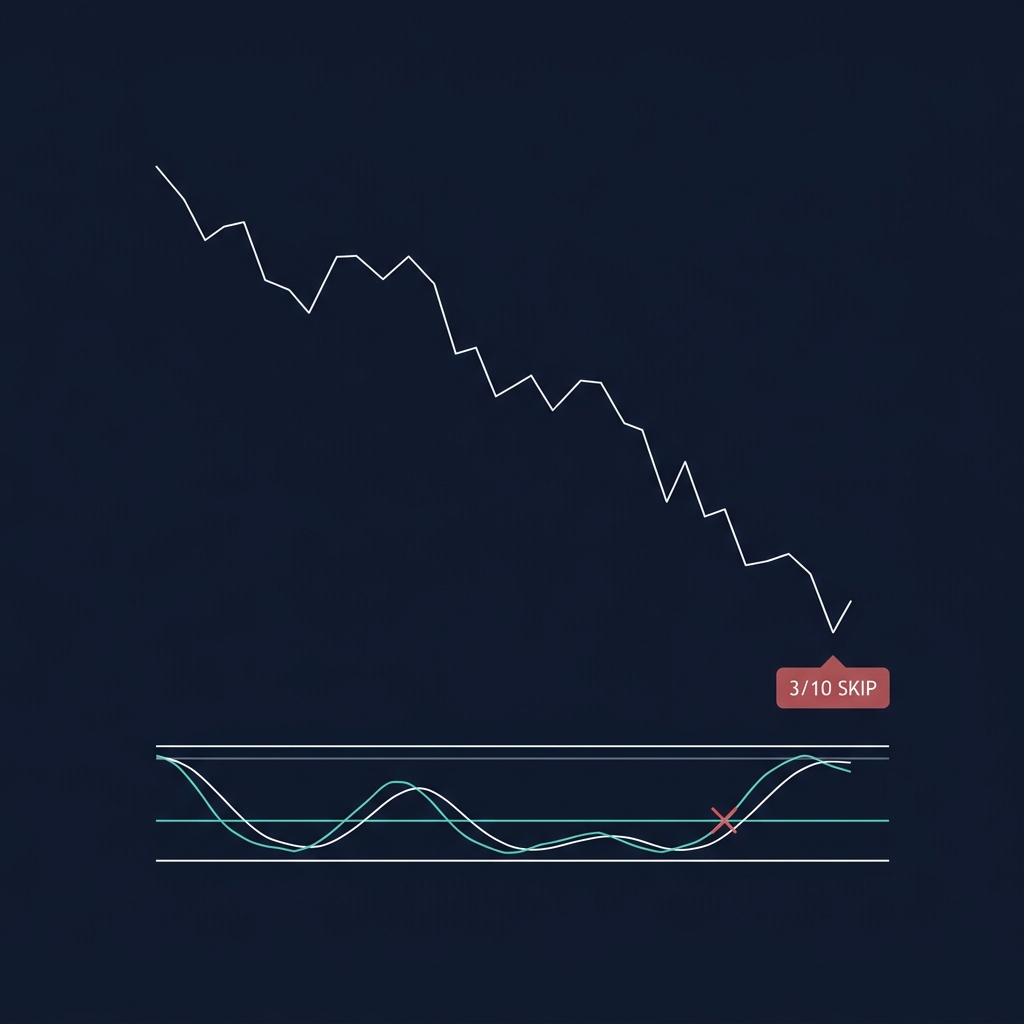
Price: $104,800, below the 21 and 50 EMA (downtrend)
StochRSI: Crossover at 0.18 (technically in oversold zone)
Confluence Score: 3/10 — only momentum hinting bullish
Action: Despite the StochRSI signal, the downtrend context and low Confluence Score indicated this was a counter-trend signal. Skipped the trade.
Result: BTC bounced briefly to $105,600 (+0.8%) then continued dropping to $101,200. Following the StochRSI signal blindly would have resulted in a loss.
Lesson: StochRSI crossovers in a downtrend have roughly half the success rate. Always check the trend direction first.
Scenario 3: ETH Overbought Divergence — May 15, 2026
ETH/USDT on the 1D chart:
Price: Made a higher high at $2,680 (up from $2,620 a week prior)
StochRSI: Made a lower high at 0.86 (down from 0.94 a week prior)
RSI: 68 — near overbought but no divergence visible yet
Action: The StochRSI divergence warned of weakening momentum 2 days before RSI itself showed any warning. Tightened stop on existing long from $2,540 to $2,610.
Result: ETH dropped to $2,520 within 4 days. The tightened stop protected profits at $2,610 instead of the original $2,540.
Lesson: StochRSI divergences appear 1-3 candles before RSI divergences. Use them for early warning, not for direct entry. Combine with divergence trading techniques.
StochRSI Settings: Which Parameters Actually Matter
Setting
Default
Aggressive
Conservative
RSI Period
14
9
21
Stochastic Period
14
9
21
%K Smoothing
3
2
5
%D Smoothing
3
2
5
Timeframe
4H
1H
1D
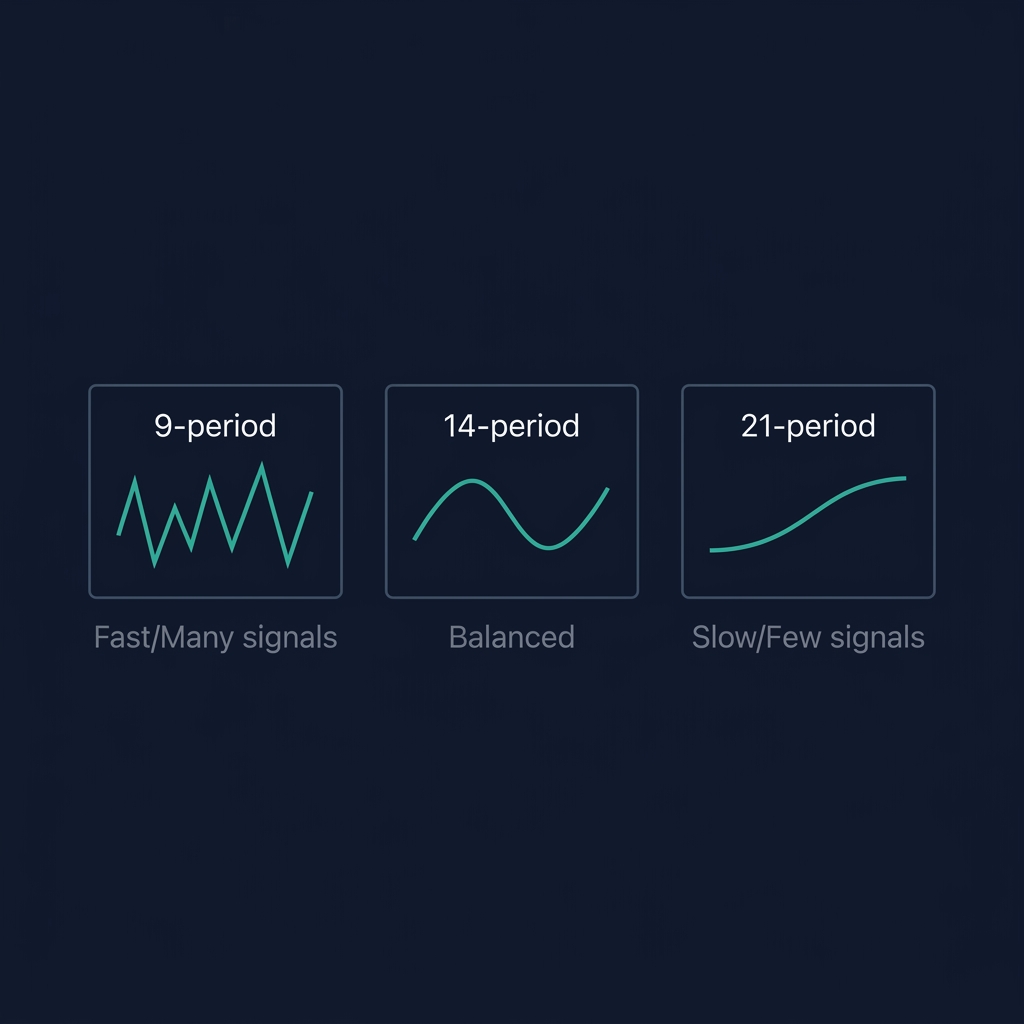
When to use aggressive settings (9-period): Scalping on 1H or shorter, when you need faster signals and can tolerate more noise.
When to use conservative settings (21-period): Swing trading on 4H-1D, when you want fewer but more reliable signals.
⚠️ Limitation: On periods below 9, StochRSI becomes too noisy for crypto — the 24/7 market's constant price action generates crossovers every few hours, most of them meaningless. Stick to 14-period on 4H or higher.
StochRSI in the CoinXSight Confluence Scoring System
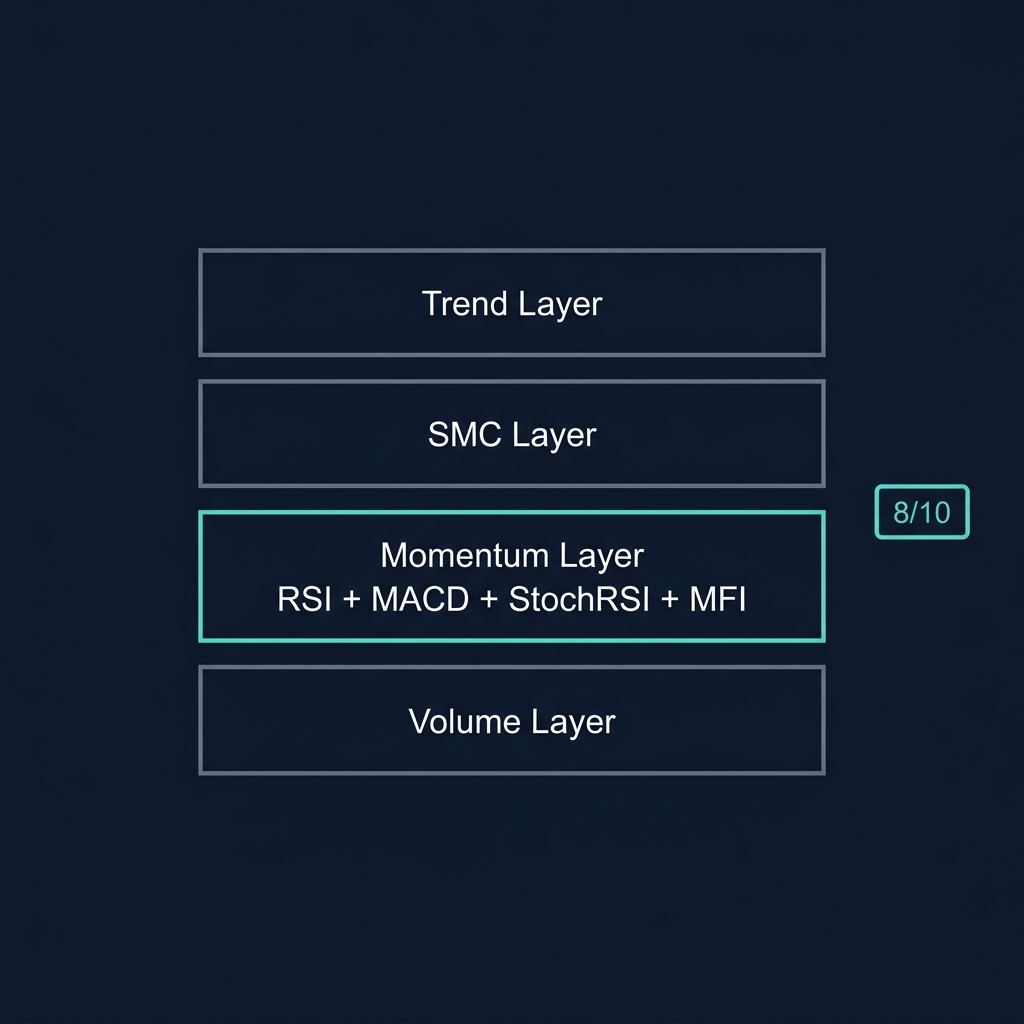
On CoinXSight, StochRSI doesn't stand alone — it's part of the 4-layer Confluence Scoring system:
Trend Layer: EMA ribbon + Supertrend
SMC Layer: Order Blocks + Fair Value Gaps
Momentum Layer: RSI + MACD + StochRSI + MFI
Volume Layer: Volume ratio + Bollinger Bands
StochRSI contributes to the Momentum Layer along with three other oscillators. When all four momentum indicators agree (all bullish or all bearish), the Momentum Layer score is highest — and those signals have the best completion rates.
Decision rule: A StochRSI bullish crossover where the Momentum Layer scores 8+/10 AND the Trend Layer confirms = high-confidence entry. In backtesting across 50+ tokens (Jan-May 2026), this combination produced a 64% win rate with an average R:R of 1:1.8.
5 Common StochRSI Mistakes
Mistake 1: Trading Every Crossover
StochRSI generates 3-5 crossovers per week on the 4H chart. Trading all of them is a losing strategy. Filter with: trend direction, Confluence Score, and zone (only trade crossovers in overbought/oversold zones).
Mistake 2: Using StochRSI in Isolation
StochRSI is a timing tool, not a direction tool. It tells you WHEN to enter, not WHETHER to enter. Determine direction with EMA or market structure first.
Mistake 3: Ignoring the Trend
A bullish StochRSI crossover in a downtrend often leads to a weak bounce followed by continuation down. The completion rate drops from ~60% to ~35% when trading against the trend.
Mistake 4: Wrong Timeframe for Your Style
Day traders using StochRSI on the 1D chart will find signals too slow. Swing traders using it on the 15m chart will get whipsawed. Match timeframe to holding period.
Mistake 5: Treating 0 and 1 as Absolute Reversal Points
StochRSI can stay at 0 or 1 for extended periods during strong trends — a phenomenon called "StochRSI embedding." An embedded StochRSI at 1.0 in a strong uptrend doesn't mean "sell" — it means "momentum is maxed out but the trend is powerful." Wait for the actual crossover before acting.
How to Use Stochastic RSI on CoinXSight
CoinXSight's crypto analytics platform streamlines this workflow with AI-powered tools and real-time data:
Open Chart Pro → select your token (BTC, ETH, SOL, etc.)
Add the StochRSI indicator from the indicators panel
Set period to 14 (default), %K smoothing to 3, %D smoothing to 3
Look for crossovers in the oversold zone (< 0.20) for entries
Cross-reference with the Confluence Score in Deep Alpha — only act when Confluence ≥ 6/10
Check the Momentum Layer specifically — all 4 momentum indicators agreeing = strongest signal
💡 Pro tip: On CoinXSight, the Confluence Score already incorporates StochRSI into its Momentum Layer calculation. If you see a high Confluence Score (7+), StochRSI is likely confirming. Use Chart Pro's StochRSI overlay for precise entry timing within that confirmed setup.
Whether you want to buy Bitcoin, buy Ethereum, or trade altcoins, this indicator helps you time entries on any crypto exchange with data-driven confidence.
FAQ
What is the difference between Stochastic RSI and regular RSI?
RSI measures price momentum directly (0-100 scale). StochRSI applies the Stochastic formula to RSI values, showing where RSI sits within its own recent range. StochRSI reacts faster and generates more frequent signals.
What are the best StochRSI settings for crypto?
14-period RSI, 14-period Stochastic, with 3-period %K and %D smoothing on the 4H timeframe. This balances signal frequency with reliability for most crypto trading styles.
Can StochRSI predict crypto price reversals?
StochRSI identifies when momentum is exhausted, not when price will reverse. Overbought StochRSI means momentum has peaked — a reversal is possible but not guaranteed. Always confirm with trend analysis and volume.
How does CoinXSight use StochRSI in its Confluence Score?
StochRSI feeds into the Momentum Layer alongside RSI, MACD, and MFI. When all four momentum indicators align bullish (or bearish), the Momentum Layer produces its strongest score, increasing the overall Confluence Score.
Should I use StochRSI for day trading or swing trading crypto?
Both, with different settings. Day trading: use 9-period on 1H charts. Swing trading: use 14-period on 4H or 1D charts. The key is matching the indicator period to your holding timeframe.
StochRSI gives you the entry precision that RSI alone can't provide — but only when filtered through trend context and the Confluence Score. Use it to time entries, not to determine direction.
Which crypto analytics platform offers the best stochastic rsi crypto tools?
CoinXSight provides stochastic rsi crypto analysis alongside 12+ other trading indicators, all integrated into an AI-powered Confluence Scoring system. It's a comprehensive crypto analytics platform that combines technical analysis with on-chain data and Smart Money Concepts for higher-probability trade setups.
JV
Julian Vance
TA // SYSTEMS
Lead Technical Systems Architect·Signals & Metrics Desk
Technical systems developer with a mathematical focus on momentum indicators, volatility metrics (ATR), volume profiles, and multi-timeframe filter models.
QUANTITATIVE SUITE // DEEP ALPHA ENGINEACTIVE
BTC/USDT // LIVE SCANNER
CONFLUENCE 35
LIVE SPOT PRICE$83,025.02NO_TRADE
TP2
$88,788.31
+6.95%
TP1
$85,327.13
+2.78%
ENTRY
$83,019.67
ZONE
SL
$81,865.94
-1.39%
Auto-detect Order Blocks, Fair Value Gaps and risk-adjusted DCA ladders in < 5s.