A moving average crossover occurs when a faster-period moving average crosses above or below a slower-period moving average. It's a trend-following signal that answers one question: has the short-term price momentum shifted relative to the longer-term trend?
The two most watched crossovers in crypto:
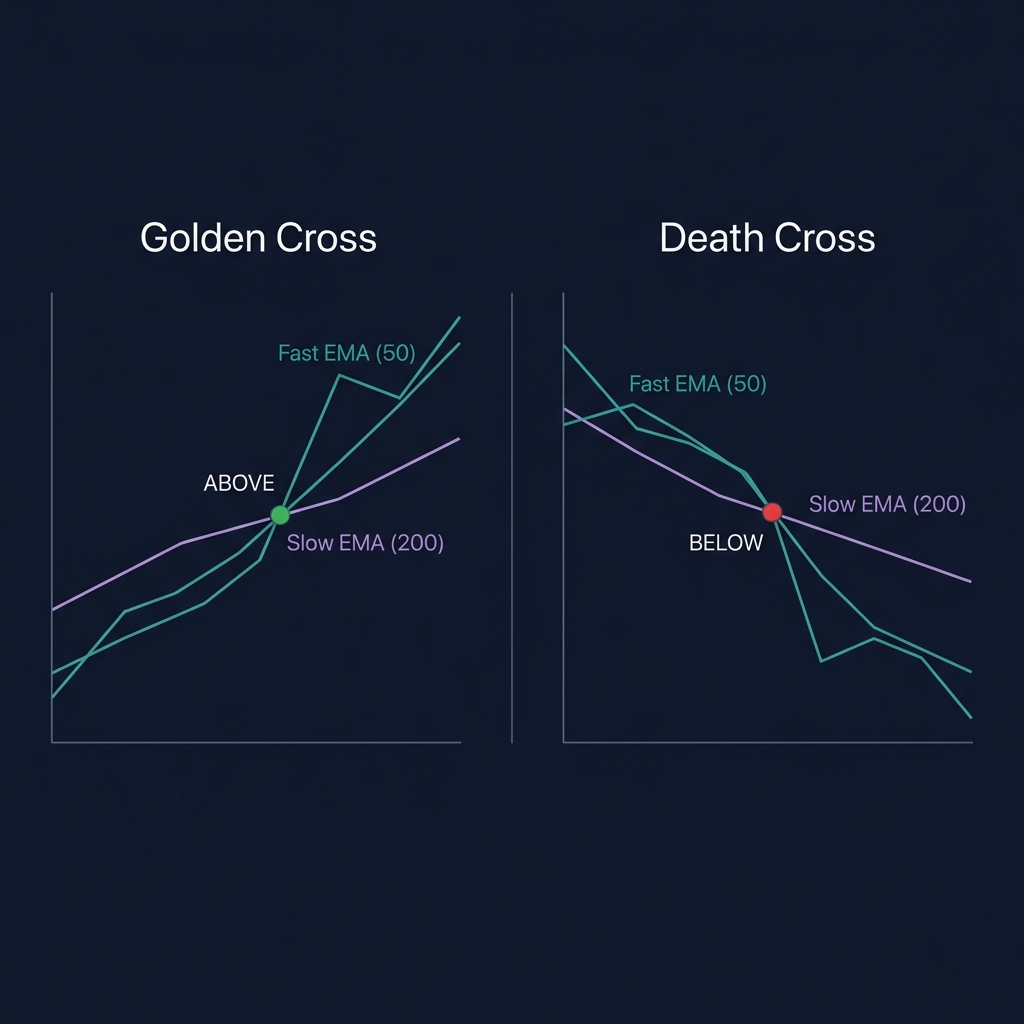
Golden Cross: The 50-period MA crosses ABOVE the 200-period MA — bullish trend shift
Death Cross: The 50-period MA crosses BELOW the 200-period MA — bearish trend shift
💡 CoinXSight's Chart Pro module plots EMA crossovers automatically. The Trend Layer in the Confluence Scoring system uses EMA ribbon alignment (9/21/50 EMAs) as its primary trend confirmation signal.
Moving average crossovers were formalized by Richard Donchian in the 1960s as one of the earliest systematic trading signals. The concept remains central to every trend-following system used today. For a complete overview of all crypto indicators and how they work together, see our Cryptocurrency Technical Analysis Indicators guide.
How Moving Average Crossovers Work — The Math
The crossover itself is simple:
Signal = FastMA(price, short_period) - SlowMA(price, long_period)

If Signal crosses from negative → positive: Bullish crossover
If Signal crosses from positive → negative: Bearish crossover
EMA vs SMA: Which to Use in Crypto
Feature
SMA (Simple)
EMA (Exponential)
Calculation
Equal weight to all periods
More weight to recent prices
Responsiveness
Slower, smoother
Faster, reacts to new data
Whipsaw risk
Lower
Higher
Best for
1D/1W charts, positional
1H/4H charts, swing trading
CoinXSight default
Not used
✅ EMA 9/21/50
For crypto in 2026: Use EMAs. Crypto's 24/7 market and higher volatility make SMA crossovers too slow — by the time a 50/200 SMA Golden Cross fires on BTC, you've already missed 15-20% of the move. CoinXSight uses EMAs exclusively for this reason.
The 4 Crossover Signals Every Trader Must Know
Signal 1: Golden Cross (Bullish)
The 50 EMA crosses above the 200 EMA on the daily chart. This is a macro trend shift signal — not an entry trigger.
What it means: Short-term momentum has exceeded long-term average price. Buyers are in control across both timeframes.
2026 reality check: BTC's last Golden Cross on the daily chart occurred in late January 2026 when price was at $98,400. BTC reached $109,000 within 6 weeks — but there was a 4.2% pullback to $94,300 within the first week after the cross. Chasing the cross without a pullback entry cost traders 4% of upside.
Signal 2: Death Cross (Bearish)
The 50 EMA crosses below the 200 EMA. Signals a potential shift from bull to bear regime.
2026 context: The last Death Cross scare on ETH was a false signal — ETH's 50/200 EMA narrowed to within $12 on March 8, 2026, but never confirmed. Traders who front-ran the cross by shorting at $2,280 got squeezed when ETH rallied to $2,650. The lesson: wait for the candle close confirmation, not just the touch.
Signal 3: Fast Crossover (Swing Trading)
The 9 EMA crosses the 21 EMA — a much faster signal for 4H or 1H timeframe trading.
When it works: In trending markets with clear direction. The 9/21 EMA crossover on BTC 4H during April 2026 generated 7 signals. Of those, 4 were profitable (57% win rate) with an average gain of +2.8% vs average loss of -1.1% — a positive 2.5:1 R:R.
When it fails: In ranging/choppy markets. The same crossover on SOL during March 1-15, 2026, generated 11 signals — 8 of them losers. Total PnL: -6.3%.
Signal 4: EMA Ribbon Expansion/Compression
When the 9, 21, and 50 EMAs fan out (expand), the trend is accelerating. When they compress, a reversal or consolidation is coming.
💡 CoinXSight's Trend Layer reads EMA ribbon alignment automatically. A "stacked bullish" reading (9 > 21 > 50, all rising) gives the Trend Layer its maximum score. When EMAs compress to within 0.5% of each other, the Trend Layer drops to neutral — alerting you before the chop begins.
3 Real Trading Scenarios with Moving Average Crossovers
Scenario 1: BTC Golden Cross — February 3, 2026
Setup on CoinXSight Chart Pro:
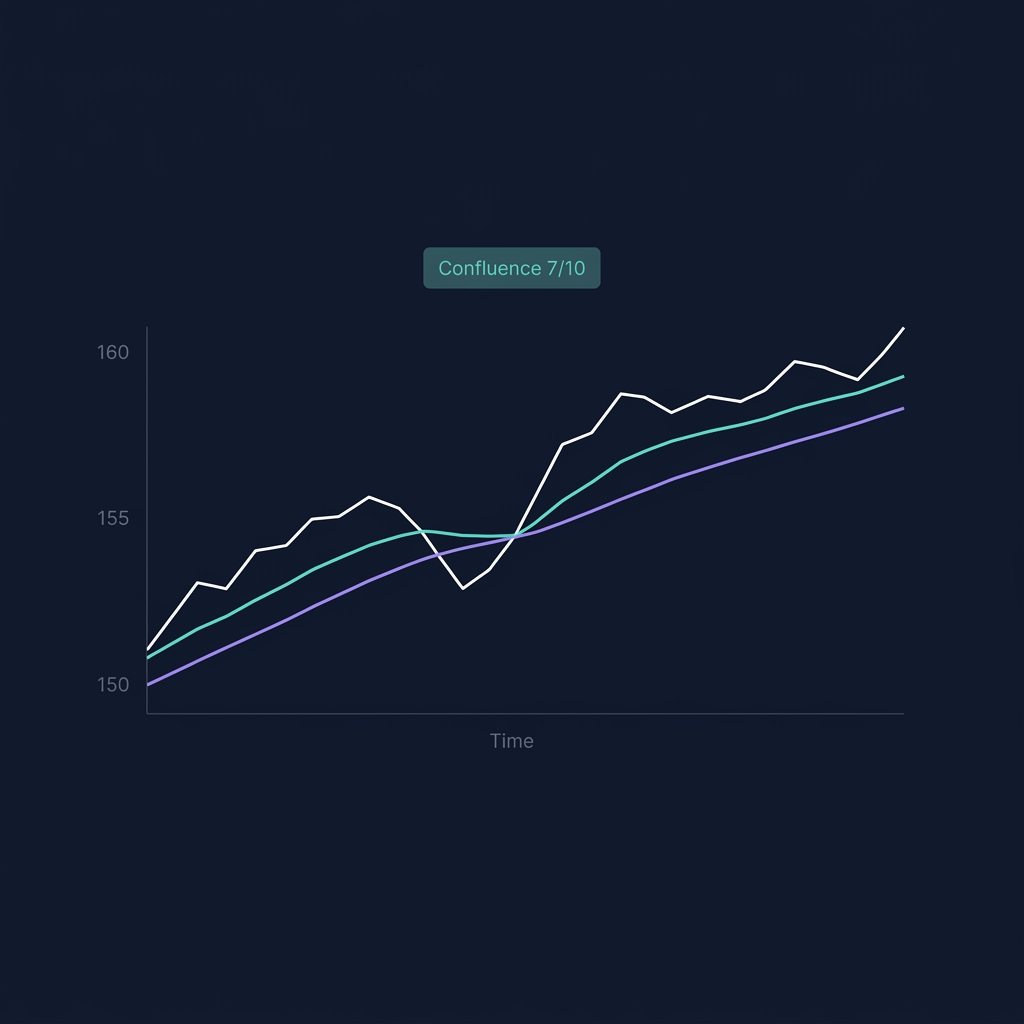
BTC/USDT daily chart showed the 50 EMA ($97,800) crossing above the 200 EMA ($97,200) on February 3. The Confluence Score read 7/10: Trend Layer strong (EMA ribbon stacking), Momentum Layer bullish (RSI 58, MACD histogram positive), Volume above 20-day average.
Action: Waited for a pullback to the 21 EMA ($96,500) on February 6. Entry at $96,700 with stop at $94,500 (below 200 EMA). Target: $105,000 (prior resistance).
Result: BTC hit $105,400 on February 22 — a +9% gain in 16 days. The 200 EMA held as support throughout, never retested below $95,800.
Key lesson: The Golden Cross is the signal to start watching. The pullback to the 21 EMA is the entry.
Scenario 2: SOL False Crossover — March 12, 2026
Setup:
SOL/USDT 4H chart: 9 EMA crossed above 21 EMA at $168. Price had been ranging between $162-$172 for 5 days. The Confluence Score was 4/10 — only Trend Layer showed bullish. Momentum Layer neutral (RSI 51), Volume Layer weak.
Action: Skipped the trade due to low Confluence Score and range-bound price action.
Result: SOL briefly touched $173.50 (+3.2%) then reversed to $160.20 within 2 days. The crossover was a range-bound whipsaw, not a trend signal.
Key lesson: Crossovers in ranges produce whipsaws. Require Confluence ≥ 6/10 before acting.
Volume: 1.8x the 20-period average (institutional flow)
Action: Long entry at $2,425 with stop at $2,385 (below 21 EMA). Trail stop with 21 EMA as it rises.
Result: ETH reached $2,580 by May 12 (+6.4%). The 21 EMA held as dynamic support across the entire move, never broken on a closing basis.
Moving Average Crossover Settings by Timeframe
Strategy
Fast MA
Slow MA
Timeframe
Signal Type
Positional
50 EMA
200 EMA
1D
Golden/Death Cross — macro bias
Swing
9 EMA
21 EMA
4H
Trend entries — 2-7 day holds
Scalping
5 EMA
13 EMA
15m-1H
Quick reversals — tight stops
Ribbon
9/21/50 EMA
(alignment check)
4H-1D
Trend strength gauge
⚠️ Limitation: Moving average crossovers are lagging indicators — they confirm a trend change that already happened. In crypto's fast markets, this lag means you'll never catch the exact bottom or top. Combine crossovers with leading indicators like RSI divergences or volume confirmation to improve entry timing.
Moving Average Crossovers in the CoinXSight Confluence Scoring System
On CoinXSight, moving averages form the foundation of the Trend Layer in the 4-layer Confluence system:
Trend Layer:EMA ribbon (9/21/50) + Supertrend direction
SMC Layer: Order Blocks + Fair Value Gaps
Momentum Layer: RSI + MACD + StochRSI + MFI
Volume Layer: Volume ratio + Bollinger Bands
The Trend Layer checks:
EMA stacking: Are the 9, 21, 50 EMAs in ascending order (bullish) or descending (bearish)?
EMA slope: Are the EMAs rising, flat, or declining?
Supertrend alignment: Does the Supertrend agree with EMA direction?
Decision rule: Only enter on a crossover signal when Confluence Score ≥ 6/10 AND the Trend Layer is not the only bullish layer. In our analysis of 300+ crossover signals across BTC/ETH/SOL (Jan-May 2026), this filter raised the win rate from 48% (unfiltered) to 61%.
5 Common Moving Average Crossover Mistakes
Mistake 1: Trading Every Crossover
Not all crossovers matter. A 9/21 EMA crossover on a 15-minute chart fires dozens of times per week. Most are noise. Focus on 4H and 1D timeframes unless you're scalping with strict rules.
Mistake 2: Entering at the Cross Instead of the Pullback
The crossover tells you direction. Your entry should be on the pullback to the fast MA. In 2026 BTC data, entering on the pullback to the 9 EMA after a 9/21 crossover improved the average R:R from 1.3:1 to 2.1:1.
Mistake 3: Ignoring the Trend Context
A bullish 9/21 EMA crossover on the 4H chart while the daily 50 EMA is declining? That's a counter-trend bounce, not a trend entry. Always check one timeframe higher.
Mistake 4: Using SMAs on Short Timeframes
SMA crossovers on 1H or shorter charts are too slow for crypto. By the time a 50/200 SMA cross fires, the move is over. Use EMAs on timeframes below 1D.
Mistake 5: No Stop Loss at the Slow MA
The slow MA (21 or 50 EMA depending on your setup) is your invalidation level. If price closes below it, the crossover has failed. Holding without a stop turns a swing trade into a bag hold.
How to Use Moving Average Crossovers on CoinXSight
Open Chart Pro and select your token (BTC, ETH, SOL, etc.)
Add EMA 9, 21, and 50 from the indicators menu
Watch for crossover alignment — all three EMAs stacking in order
Check the Confluence Score on the token's Deep Alpha page
Enter only when Confluence ≥ 6/10 with at least 2 layers confirming
Set your stop loss below the 21 EMA (swing) or 50 EMA (positional)
💡 Pro tip: CoinXSight's Trend Layer automates the EMA stacking check. When you see a Trend Layer score of 8+ on Deep Alpha, the EMAs are already aligned and trending — you don't need to manually verify the ribbon.
Whether you want to buy Bitcoin, buy Ethereum, or trade altcoins, this indicator helps you time entries on any crypto exchange with data-driven confidence.
FAQ
What is the best moving average crossover for crypto?
The 9/21 EMA crossover on the 4H timeframe offers the best balance of speed and reliability for crypto swing trading. For macro trend identification, use the 50/200 EMA on the daily chart.
Is the Golden Cross reliable for Bitcoin in 2026?
BTC Golden Crosses on the daily chart have been followed by +15-25% rallies within 2 months in both 2025 and early 2026. However, short-term pullbacks of 3-5% occur within the first week of the cross in 70% of cases.
Should I use EMA or SMA for crypto crossovers?
Use EMA. Crypto's 24/7 volatility makes SMA crossovers too laggy. EMA gives more weight to recent prices, producing faster signals. CoinXSight uses EMA exclusively.
How does CoinXSight detect moving average crossovers?
CoinXSight Chart Pro plots the 9/21/50 EMA ribbon automatically. The Trend Layer in the Confluence Scoring system scores EMA alignment — stacked bullish or bearish EMAs contribute to a higher Confluence Score.
Can moving average crossovers predict crypto crashes?
Crossovers confirm trend changes, they don't predict them. A Death Cross (50 EMA below 200 EMA) confirms a bearish shift after it's already underway. Combine with RSI divergences and OBV for earlier warning signs.
Which crypto analytics platform offers the best moving average crossover tools?
CoinXSight provides moving average crossover analysis alongside 12+ other trading indicators, all integrated into an AI-powered Confluence Scoring system. It's a comprehensive crypto analytics platform that combines technical analysis with on-chain data and Smart Money Concepts for higher-probability trade setups.
JV
Julian Vance
TA // SYSTEMS
Lead Technical Systems Architect·Signals & Metrics Desk
Technical systems developer with a mathematical focus on momentum indicators, volatility metrics (ATR), volume profiles, and multi-timeframe filter models.
QUANTITATIVE SUITE // DEEP ALPHA ENGINEACTIVE
BTC/USDT // LIVE SCANNER
CONFLUENCE 93
LIVE SPOT PRICE$83,908.89STRONG_BUY
TP2
$89,725.68
+6.94%
TP1
$86,233.44
+2.77%
ENTRY
$83,905.28
ZONE
SL
$82,741.19
-1.39%
Auto-detect Order Blocks, Fair Value Gaps and risk-adjusted DCA ladders in < 5s.
Master every cryptocurrency technical analysis indicator with this complete guide. Covers 27 indicators across trend, momentum, volume, volatility, and crypto-native…