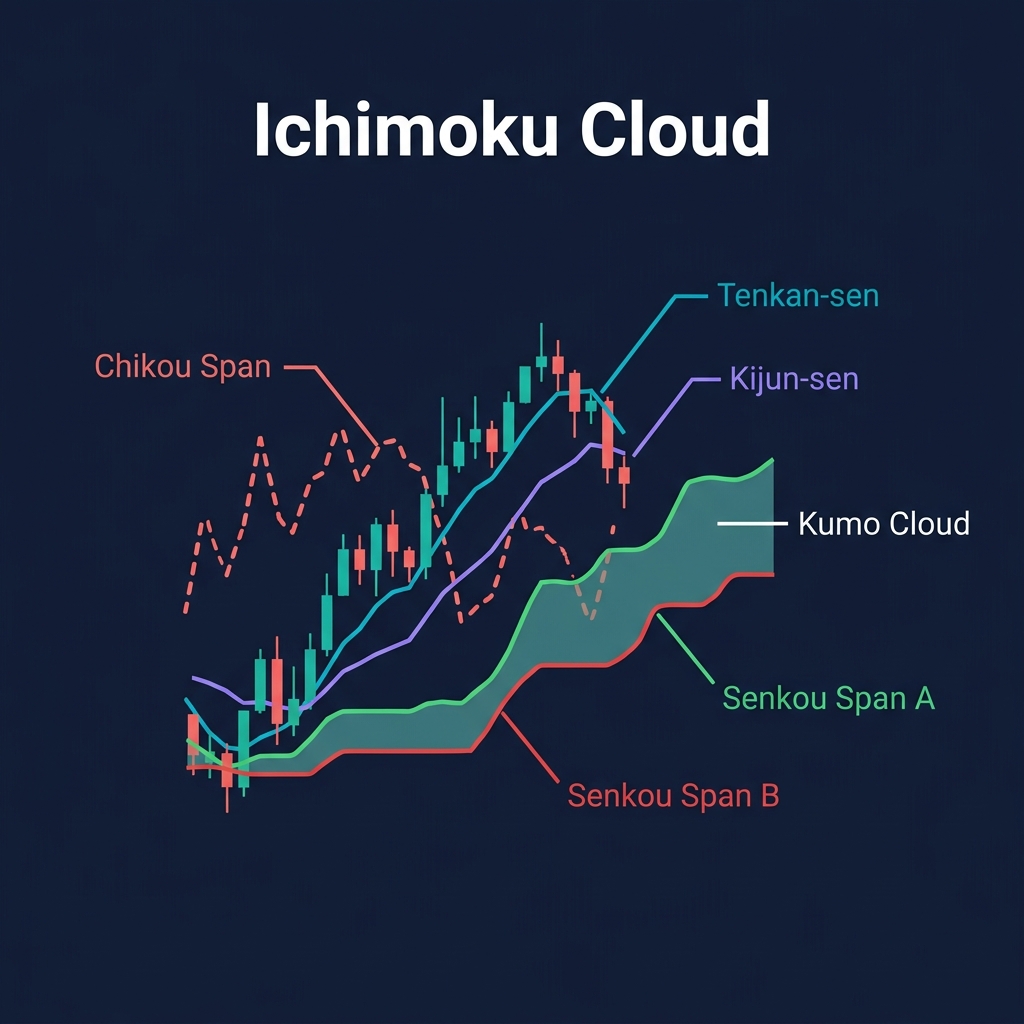
The Ichimoku Kinko Hyo — literally "one glance equilibrium chart" — is a Japanese technical analysis system developed by Goichi Hosoda in the 1960s after 30 years of research. Unlike single-line indicators like RSI or MACD, the Ichimoku system provides five signals simultaneously: trend direction, momentum, support, resistance, and potential entry/exit points.
For crypto traders, the Ichimoku Cloud solves a common frustration: needing 4-5 different indicators on your chart when one system can do the job. The cloud component (Kumo) is particularly powerful in crypto because it creates dynamic support and resistance zones that adapt to volatility — something fixed-level tools can't match in a 24/7 market.
Despite its complexity at first glance, the Ichimoku system follows clear, mechanical rules. Once you understand the five components, you can assess market conditions in seconds — which is exactly what the name promises. For a complete overview of all crypto indicators and how they work together, see our Cryptocurrency Technical Analysis Indicators guide.
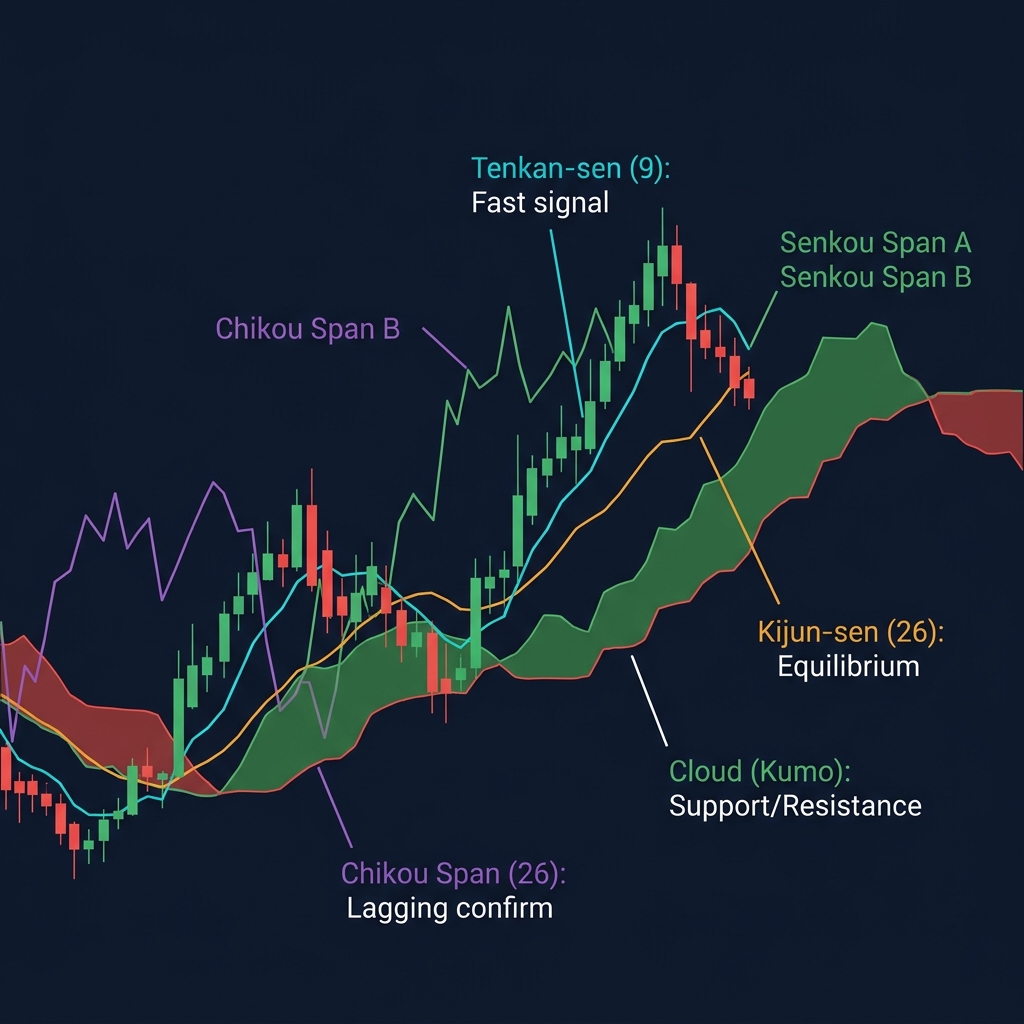
The Five Components Explained
1. Tenkan-sen (Conversion Line)
Calculation: (Highest High + Lowest Low) / 2, over the last 9 periods
The Tenkan-sen acts as a short-term trend indicator. Think of it as a faster-reacting moving average, but instead of averaging closing prices, it averages the midpoint of the price range. This makes it more responsive to breakouts.
How to use it:
Price above Tenkan-sen → short-term bullish
Tenkan-sen slope turning up → momentum building
In crypto, the 9-period setting on 4H charts captures intra-day swing momentum effectively
2. Kijun-sen (Base Line)
Calculation: (Highest High + Lowest Low) / 2, over the last 26 periods
The Kijun-sen represents medium-term equilibrium. It's the "gravity line" of Ichimoku — price tends to return to it after extended moves. Professional traders use the Kijun-sen as a trailing stop or as a baseline for risk management.
How to use it:
Price far above Kijun-sen → extended/overheated — expect a pullback
Price touching and bouncing off Kijun-sen in an uptrend → buying opportunity
Flat Kijun-sen → market in equilibrium (ranging)
3. Senkou Span A (Leading Span A)
Calculation: (Tenkan-sen + Kijun-sen) / 2, plotted 26 periods ahead
This is the first boundary of the "cloud" (Kumo). By plotting it forward, Hosoda designed the system to project future support/resistance — a concept that most Western indicators lack entirely.
4. Senkou Span B (Leading Span B)
Calculation: (Highest High + Lowest Low) / 2, over the last 52 periods, plotted 26 periods ahead
The second boundary of the cloud. Senkou Span B is slower-moving and creates the outer edge of support/resistance. The area between Span A and Span B forms the "cloud" itself.
Cloud interpretation:
Green cloud (Span A above Span B) → Bullish market environment
Red cloud (Span B above Span A) → Bearish market environment
Thin cloud → Weak support/resistance, easier for price to break through
Thick cloud → Strong support/resistance zone
5. Chikou Span (Lagging Span)
Calculation: Current closing price, plotted 26 periods behind
The Chikou Span compares current price to where price was 26 periods ago. It serves as a confirmation filter.
How to use it:
Chikou Span above price from 26 periods ago → confirms bullish bias
Chikou Span below → confirms bearish bias
When Chikou Span is tangled with past price bars → no clear trend, stay out
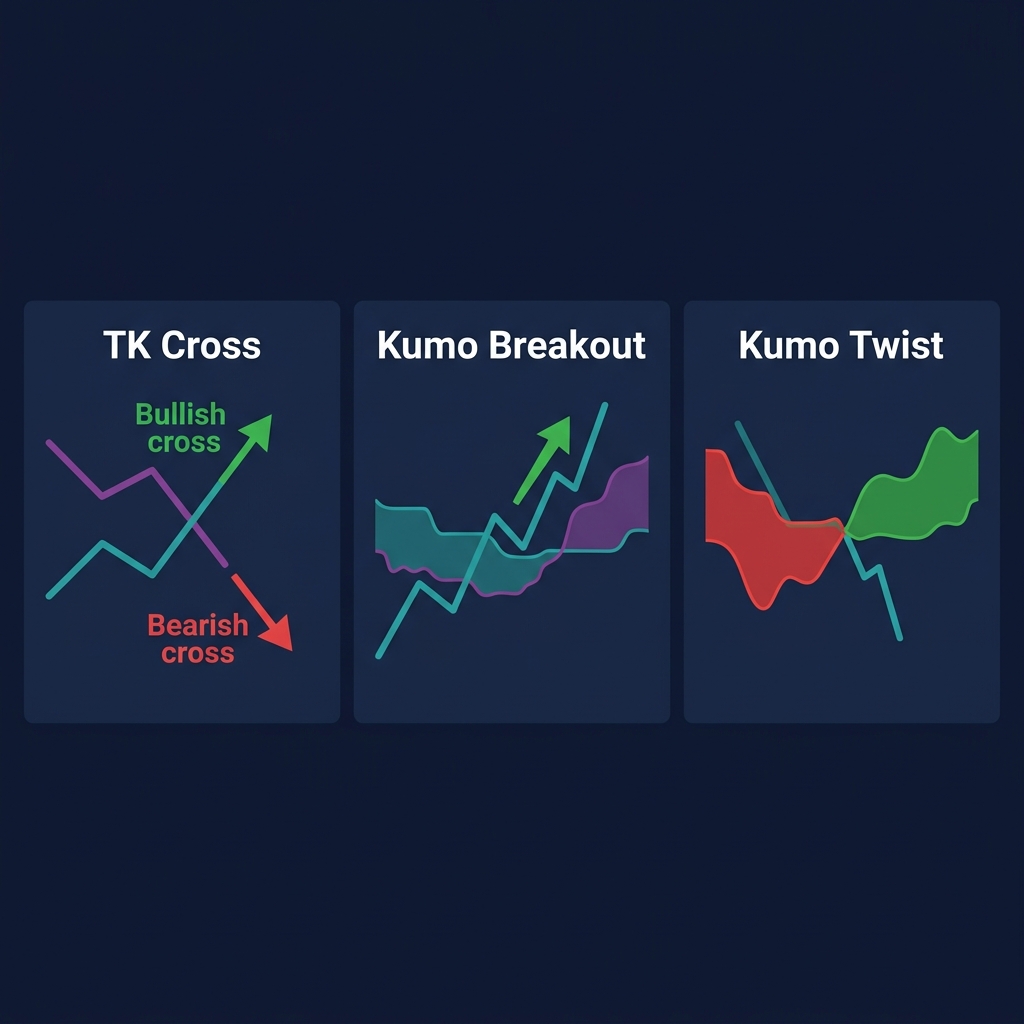
The Three Core Signals
Modern crypto analytics platforms integrate these signals with additional data layers — combining trading indicators, on-chain metrics, and AI analysis for higher-probability entries.
Signal 1: TK Cross (Tenkan/Kijun Crossover)
The Tenkan-Kijun crossover is the Ichimoku equivalent of a moving average cross, but with a critical advantage — the cloud provides context.
Cross Type
Condition
Signal Strength
Bullish TK Cross above cloud
Tenkan crosses above Kijun, price above cloud
🟢 Strong buy
Bullish TK Cross inside cloud
Tenkan crosses above Kijun, price inside cloud
🟡 Moderate buy
Bullish TK Cross below cloud
Tenkan crosses above Kijun, price below cloud
⚪ Weak buy
Bearish TK Cross below cloud
Tenkan crosses below Kijun, price below cloud
🔴 Strong sell
💡 CoinXSight Tip: On the Deep Alpha module, combine the TK Cross with the ASI score. A bullish TK Cross on the 4H chart + ASI score above 65 has historically produced win rates above 60% on major pairs.
Signal 2: Kumo Breakout
When price breaks above or below the cloud, it signals a potential trend change. This is the highest-conviction Ichimoku signal.
Rules for a valid Kumo breakout:
Price closes decisively above/below the cloud (not just a wick)
The cloud ahead is turning in the same direction (confirming momentum)
Volume increases on the breakout candle
Chikou Span is free (not tangled with past price)
In crypto, Kumo breakouts on the Daily chart often precede multi-week directional moves. The cloud acts as a "membrane" — once price escapes, it tends to trend.
Signal 3: Kumo Twist
When Senkou Span A and Senkou Span B cross each other, the cloud "twists" — changing from bullish to bearish or vice versa. Since the cloud is projected 26 periods ahead, you can see future twists coming before they happen.
This is unique to Ichimoku. No other indicator gives you a visible future support/resistance change.
How to trade Kumo twists:
Future twist from red to green → prepare for bullish reversal
Future twist from green to red → tighten stops on longs
Twist points themselves act as support/resistance levels
Ichimoku Settings for Crypto
The traditional Ichimoku settings (9, 26, 52) were designed for 6-day Japanese trading weeks. For crypto's 24/7 market, some traders adjust:
Setting
Traditional
Crypto Adjusted
When to Use
Tenkan
9
10
24/7 markets
Kijun
26
30
24/7 markets
Senkou B
52
60
24/7 markets
Default
9/26/52
9/26/52
Recommended for beginners
Our recommendation: Start with the default 9/26/52 settings. The traditional settings have been tested for over 50 years and work well on crypto's Daily and 4H charts. Only adjust if you've backtested the changes thoroughly.
Complete Ichimoku Trading Strategy
Here's a mechanical strategy you can apply immediately:
Entry Rules (Long)
✅ Price is above the cloud
✅ Cloud ahead is green (Span A > Span B)
✅ Tenkan-sen is above Kijun-sen
✅ Chikou Span is above price from 26 periods ago
✅ Wait for a pullback to Tenkan-sen or Kijun-sen → enter on bounce
Stop Loss
Below Kijun-sen (conservative)
Below the bottom of the cloud (aggressive)
Take Profit
TP1: Previous swing high (sell 50%)
TP2: Trail stop below Kijun-sen (ride the trend)
Exit Signal
Bearish TK Cross → close remaining position
Price enters the cloud → tighten stop to breakeven
Case Study: BTC Daily Chart — January 2026
In early January 2026, BTC pulled back to the Kijun-sen on the daily chart while remaining above a thick green cloud. All five Ichimoku signals were aligned bullish:
Price held above the cloud (support at $88,000)
TK Cross occurred bullish on January 8th
Chikou Span was well above past price
Cloud ahead remained green and thickening
Volume increased on the bounce from Kijun-sen
Entry at $91,500 with stop below Kijun at $87,200 and TP1 at $98,000. The trade hit TP1 within 12 days — a 7.1% gain with a clean 1:1.6 R:R ratio.
Common Mistakes with Ichimoku
1. Using Ichimoku on Low Timeframes
The system was designed for daily charts. On 5-minute or 15-minute charts, the signals generate excessive noise. Stick to 4H and Daily for crypto.
2. Taking Signals Inside the Cloud
When price is inside the cloud, the market is in no-man's land. All signals are unreliable. Wait for a clear break above or below.
3. Ignoring the Chikou Span
Many traders skip the Chikou Span because it looks confusing. But it's a critical confirmation filter. If Chikou is tangled with past price, the signal is not clean — reduce position size or skip.
4. Fighting a Thick Cloud
A thick cloud represents strong support or resistance. Trying to trade against it (shorting into thick support, or buying into thick resistance) is a low-probability setup.
How to Use Ichimoku on CoinXSight
As a comprehensive crypto analytics platform, CoinXSight makes this analysis accessible through its integrated toolset:
Step 1: Open Deep Alpha
Navigate to the Deep Alpha module and select any token. The charting view supports Ichimoku Cloud overlay.
Step 2: Assess the Cloud Structure
Check the current cloud color and thickness. Green + thick = strong bullish environment.
Step 3: Cross-reference with ASI Score
Use the ASI score as a second opinion. If Ichimoku shows bullish alignment AND ASI is above 65, you have confluence from both traditional and AI-based analysis.
Step 4: Set Alerts
Set a price alert at the Kijun-sen level for pullback entries. If price touches Kijun-sen in an uptrend, evaluate the bounce for a potential long entry.
Whether you want to buy Bitcoin, buy Ethereum, or trade altcoins, this indicator helps you time entries on any crypto exchange with data-driven confidence.
Frequently Asked Questions
Is the Ichimoku Cloud reliable for crypto?
Yes, particularly on 4H and Daily timeframes. The cloud adapts to volatility naturally because it's based on high-low ranges rather than closing prices. This makes it well-suited for crypto's wide price swings.
Can I use Ichimoku as my only indicator?
You can. Ichimoku is designed as a complete system — it provides trend, momentum, support, resistance, and timing in one view. Many professional traders use it as their primary tool with only volume as an additional filter.
What timeframe is best for Ichimoku in crypto?
The Daily chart gives the most reliable signals. The 4H chart is a good secondary timeframe for timing entries. Avoid anything below 1H — the signals become noisy and unreliable.
How do I know when the Ichimoku signal is wrong?
Watch for these invalidation signs: price re-enters the cloud after breaking out (failed breakout), TK Cross reverses within 3 candles (whipsaw), or Chikou Span becomes tangled with past price. Any of these = reduce size or close.
What's the difference between Ichimoku and moving average crossovers?
Two key differences: (1) Ichimoku uses high-low midpoints instead of closing prices, making it more responsive to ranges. (2) The cloud projects support/resistance 26 periods into the future — no moving average system does this.
Summary
The Ichimoku Cloud gives you a complete market picture in a single glance:
Five components working together: Tenkan, Kijun, Senkou A, Senkou B, Chikou
Cloud color tells you the market regime (bullish/bearish)
Cloud thickness tells you support/resistance strength
TK Cross provides entry timing with context
Chikou Span confirms signal quality
Future cloud projection shows you where support/resistance will be
The system requires patience — wait for all components to align before entering. But when they do, the probability tilts heavily in your favor.
Lead Technical Systems Architect·Signals & Metrics Desk
Technical systems developer with a mathematical focus on momentum indicators, volatility metrics (ATR), volume profiles, and multi-timeframe filter models.
QUANTITATIVE SUITE // DEEP ALPHA ENGINEACTIVE
BTC/USDT // LIVE SCANNER
CONFLUENCE 93
LIVE SPOT PRICE$83,908.89STRONG_BUY
TP2
$89,725.68
+6.94%
TP1
$86,233.44
+2.77%
ENTRY
$83,905.28
ZONE
SL
$82,741.19
-1.39%
Auto-detect Order Blocks, Fair Value Gaps and risk-adjusted DCA ladders in < 5s.
Master multi-timeframe analysis for crypto trading. Learn the 3-timeframe rule, top-down analysis flow, timeframe alignment signals, and how to combine…
Master every cryptocurrency technical analysis indicator with this complete guide. Covers 27 indicators across trend, momentum, volume, volatility, and crypto-native…