Master crypto technical analysis with our complete 2026 guide — AI-powered strategies, 27+ indicators, on-chain confirmation, and proven trading frameworks. Real data from CoinXSight's live platform.
MC
Marcus ChenSenior Quantitative Strategist·May 30, 2026 · 18 min read · Updated Oct 6
Crypto Technical Analysis: What It Is and Why 2026 Is Different
Crypto technical analysis (TA) is the practice of studying price charts, volume, and market data to forecast where prices are likely to move next. Instead of analyzing a project's team or tokenomics, TA focuses on patterns in how traders actually behave — what they buy, when they sell, and at what price levels they hesitate.
Why does 2026 matter? Because the crypto market has fundamentally changed. Bitcoin ETFs brought institutional capital. AI tools now analyze charts faster than any human. On-chain data has become a new analysis layer that didn't exist in traditional markets. The strategies that worked in 2021's retail-driven mania don't necessarily work today.
This guide gives you a complete, updated framework — with real data from CoinXSight's live platform to show exactly how each concept plays out in today's market.
Key Terms You Should Know
Term
What It Means
Support
A price level where buying pressure historically prevents further decline
Resistance
A price level where selling pressure historically prevents further advance
Confluence
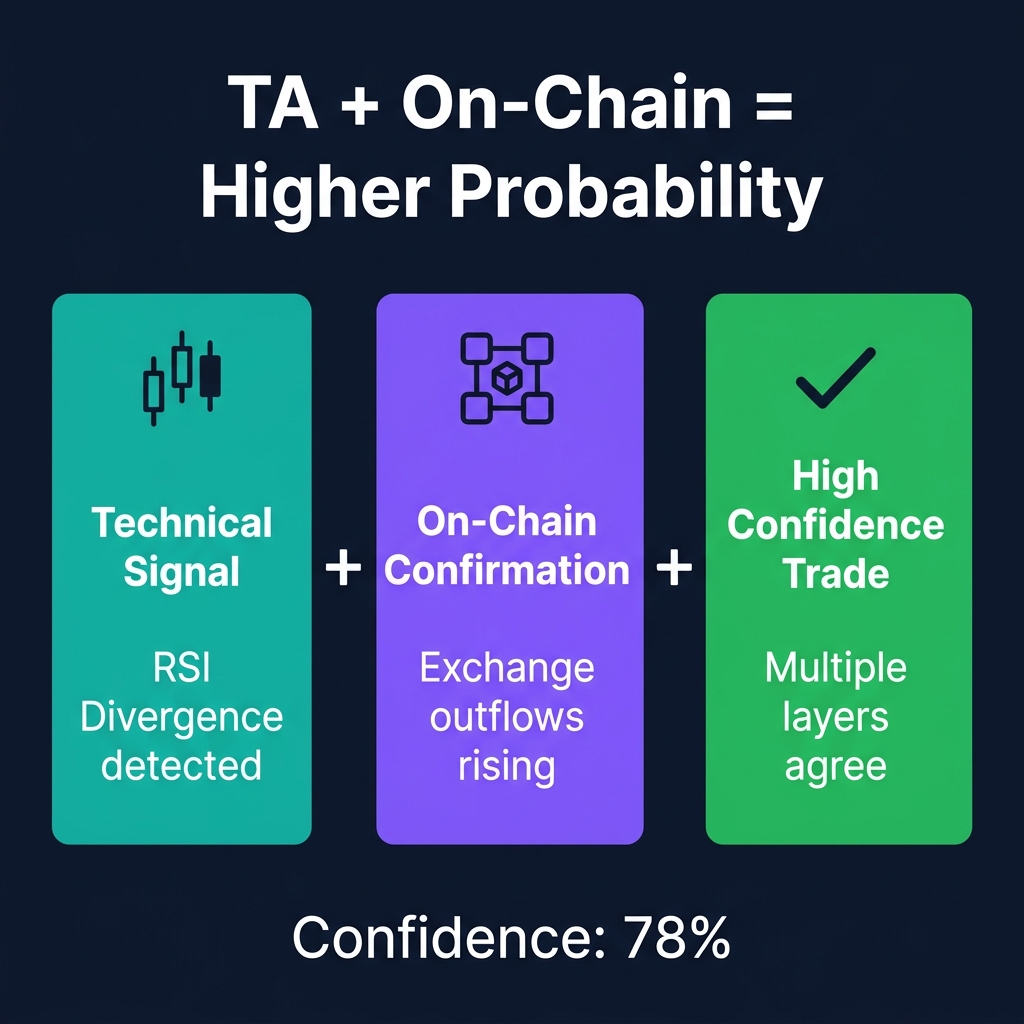
When multiple independent signals agree on the same direction — increasing probability
Divergence
When price moves one direction but an indicator moves the opposite — warning of reversal
Market Structure
The pattern of higher highs/lows (uptrend) or lower highs/lows (downtrend)
Liquidity
Areas where many stop-losses or limit orders cluster — price often hunts these zones
ASI Score
CoinXSight's AI Strength Index — a 0-100 composite score combining multiple TA and on-chain signals
Risk-Reward Ratio
How much you stand to gain versus how much you risk — a 3:1 ratio means $3 potential profit for every $1 risked
False Breakout
When price briefly breaks a level then reverses — trapping traders who entered too early
Regime
The current market "mode" — trending, ranging, or volatile — which determines which strategies work best
What Changed in Crypto TA for 2026
The tools and data haven't just improved — the entire game has shifted. Here's what's different:
The Institutional Effect
Bitcoin spot ETFs and Ethereum ETFs have funneled institutional capital into crypto. This means:
Support and resistance levels are more respected. Institutional algorithms trade based on these levels, creating self-reinforcing zones.
Fake-outs are more sophisticated. Institutions deliberately trigger retail stop-losses before entering at better prices — a practice called "liquidity hunting."
Volume patterns are more reliable. Institutional money creates genuine volume spikes that are easier to distinguish from wash trading.
The AI Revolution in TA
In 2023, traders manually drew trendlines and checked RSI. In 2026, AI tools scan hundreds of assets simultaneously, detect patterns in milliseconds, and combine data sources that no human could process alone.
CoinXSight's Discovery Scan, for example, currently tracks over 2,000 coins in real-time with signals like these pulled directly from the live API (May 30, 2026):
Coin
Price
RSI (14)
MACD
Divergence
Signal
Strength
COOKIE
$0.013
23.3
Bullish
Bullish Divergence
BUY
CONFIRMED_BULL
BNB
$662
35.3
Bearish
—
SELL
CONFIRMED_BEAR
HEI
$0.164
35.2
Bullish
Bullish Divergence
BUY
BULLISH
RAIN
$4.88
84.6
Bearish
Bearish Divergence
SELL
CONFIRMED_BEAR
Data source: CoinXSight Discovery API, May 30, 2026
Notice how the AI doesn't just show RSI — it combines RSI + MACD + divergence + pattern detection into a unified signal with confidence level. That's the difference between 2023's "check the chart" and 2026's "the chart checks itself."
On-Chain Data as a New TA Layer
Traditional TA only uses price and volume. In 2026, smart traders add a third dimension: on-chain data — the actual movement of coins between wallets and exchanges.
CoinXSight's Exchange Netflow data (May 30, 2026) shows:
Exchange
7-Day Signal
BTC Net
ETH Net
Stablecoin Net
Bybit
🟢 ACCUMULATING
0
-828 ETH outflow
+$268M
Binance
🔴 DISTRIBUTING
-452 BTC
+13,120 ETH inflow
+$19.3M
Coinbase
🟢 ACCUMULATING
0
0
neutral
Data source: CoinXSight On-Chain API, May 30, 2026
What does this tell us? Bybit users are pulling ETH off the exchange (bullish — they're holding, not selling). Binance is seeing ETH inflows (bearish — traders are depositing to sell). This real-time flow data adds context that candlestick charts alone can never provide.
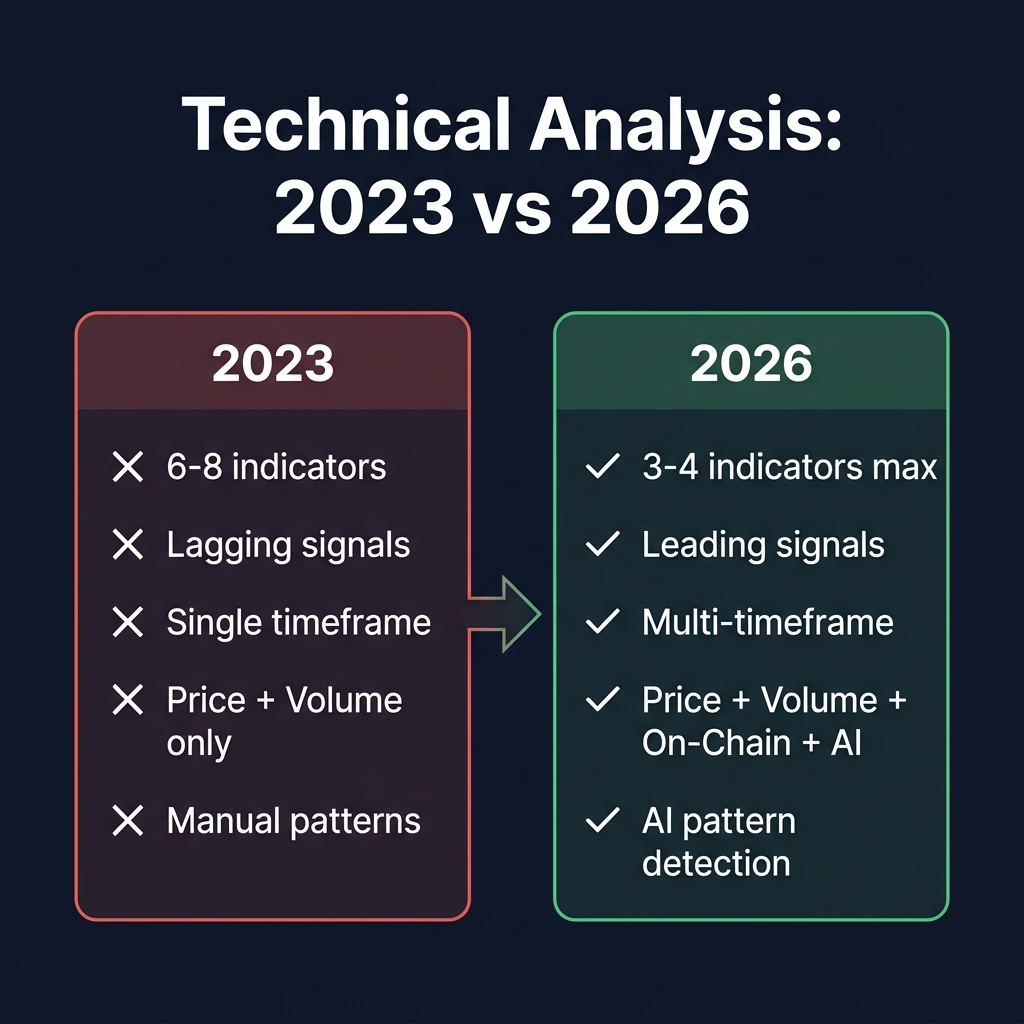
The biggest mindset change in 2026: fewer indicators, better analysis. Profitable traders have moved away from cluttered charts with 8 overlapping indicators. Instead, the modern approach uses:
2023 Approach
2026 Approach
6-8 indicators on one chart
3-4 maximum, each serving a different purpose
Focus on lagging signals
Focus on leading signals (divergence, volume, on-chain)
Single timeframe
Multi-timeframe confirmation
Price and volume only
Price + volume + on-chain + AI scoring
Manual pattern recognition
AI-assisted pattern detection with confidence scores
"Set and forget" parameters
Adaptive parameters based on market regime
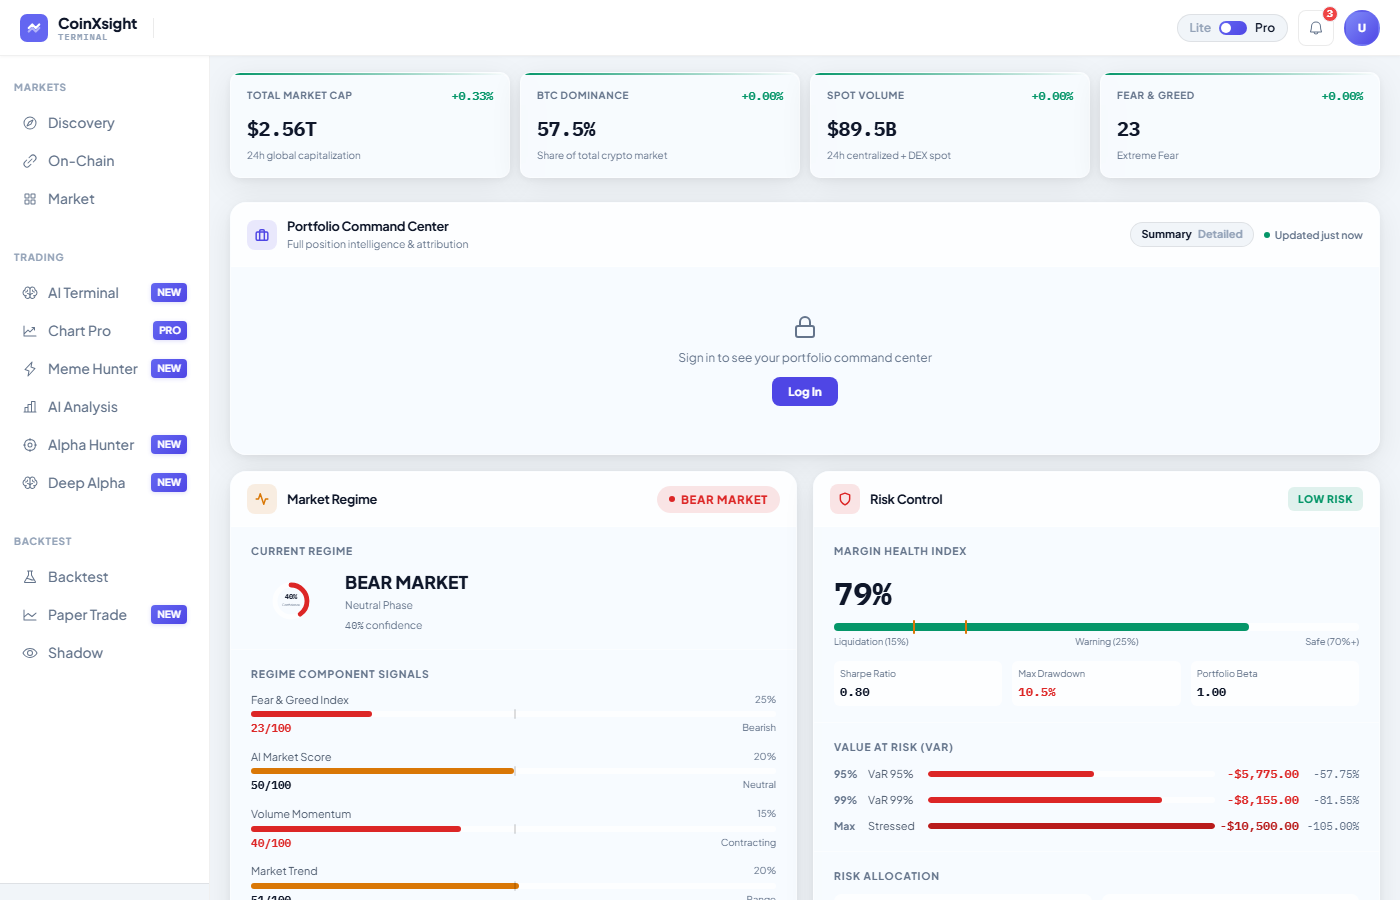
CoinXSight Dashboard (May 30, 2026) — Total Market Cap $2.56T, BTC Dominance 57.5%, Fear & Greed 23 (Extreme Fear), Market Regime: BEAR MARKET at 40% confidence:
The 2026 TA Framework: 5 Layers That Actually Work
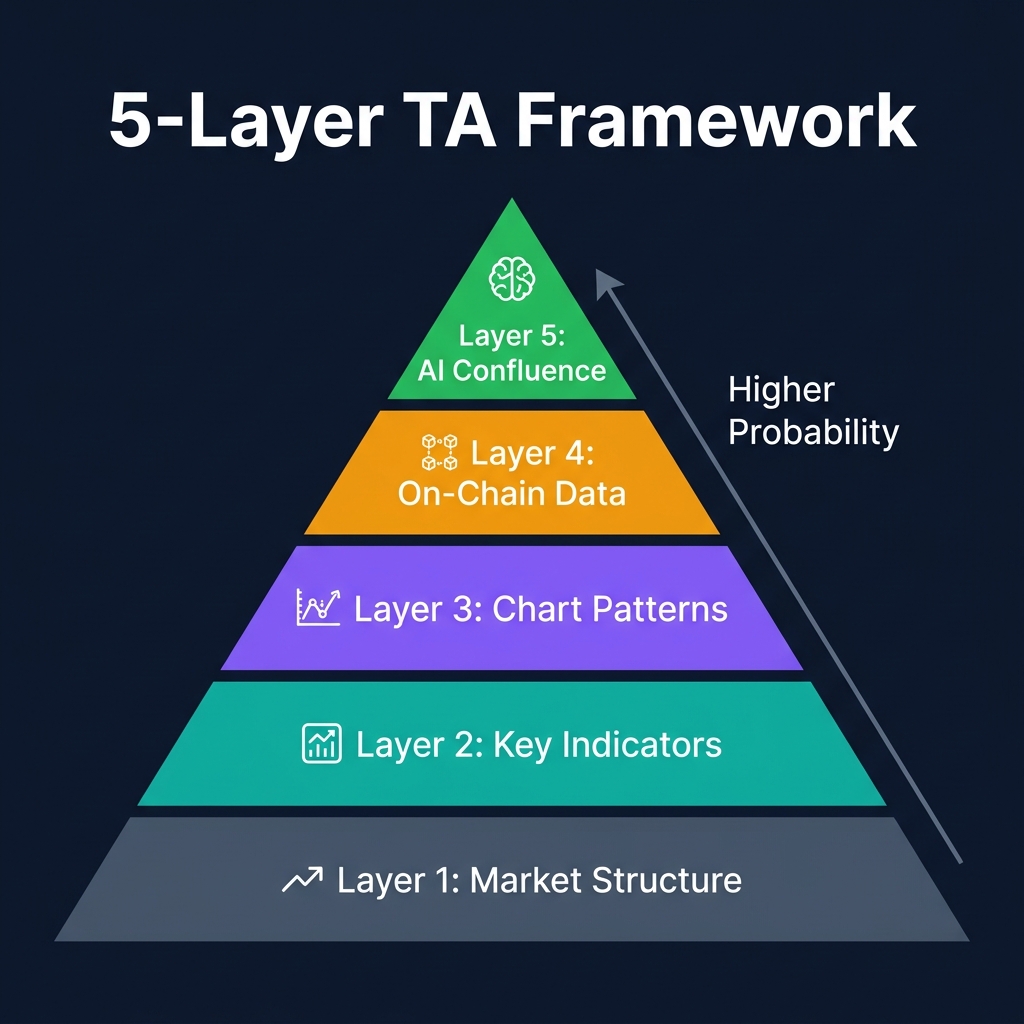
Instead of learning 30 indicators and hoping some work, use this 5-layer framework where each layer serves a specific purpose. Think of it like building a case in court — each layer is a different piece of evidence. The more layers that agree, the stronger your case.
Layer 1: Market Structure and Trend
Before looking at any indicator, answer one question: is price making higher highs and higher lows (uptrend), or lower highs and lower lows (downtrend)?
This is the foundation everything else builds on. Trading against the trend is the most common reason retail traders lose money.
2026 Reality: In institutional-driven markets, market structure is more reliable than in retail-driven markets. When BTC breaks a key high on strong volume, institutions are likely involved — making the breakout more likely to hold.
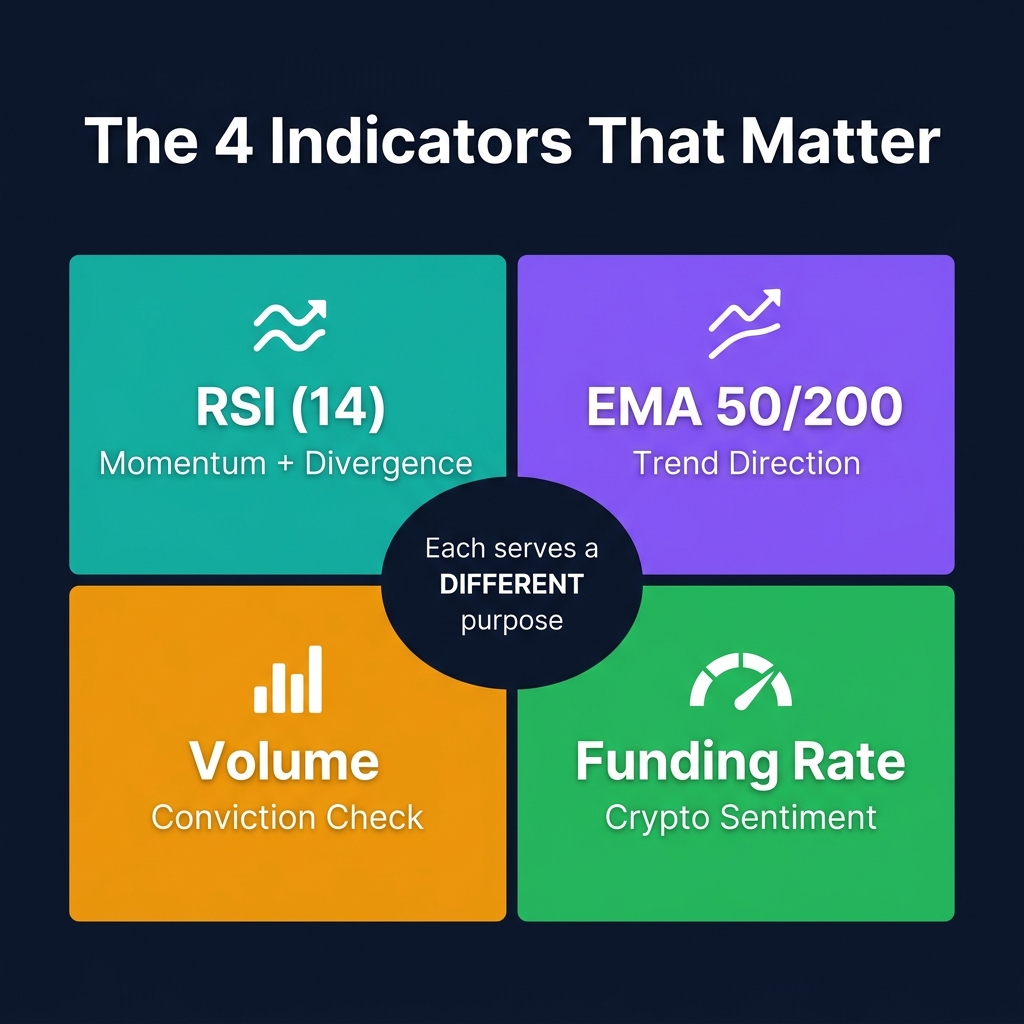
Layer 2: The 4 Indicators That Actually Matter
You don't need 15 indicators. You need 4, each serving a different analytical purpose:
Indicator
Purpose
What to Look For
Deep Dive
RSI (14)
Momentum + Divergence
Divergence is the real signal, not just overbought/oversold
Most beginners learn RSI as "below 30 = oversold, buy." But in strong downtrends, RSI can stay below 30 for weeks. The real power of RSI is divergence — when price makes a new low but RSI makes a higher low. This signals that selling momentum is weakening even as price drops.
CoinXSight's live data shows this in action: COOKIE is currently trading at $0.013 with RSI at 23.3 and a confirmed bullish divergence — price made lower lows but RSI is diverging upward. The AI system flagged this as a BUY with CONFIRMED_BULL strength.
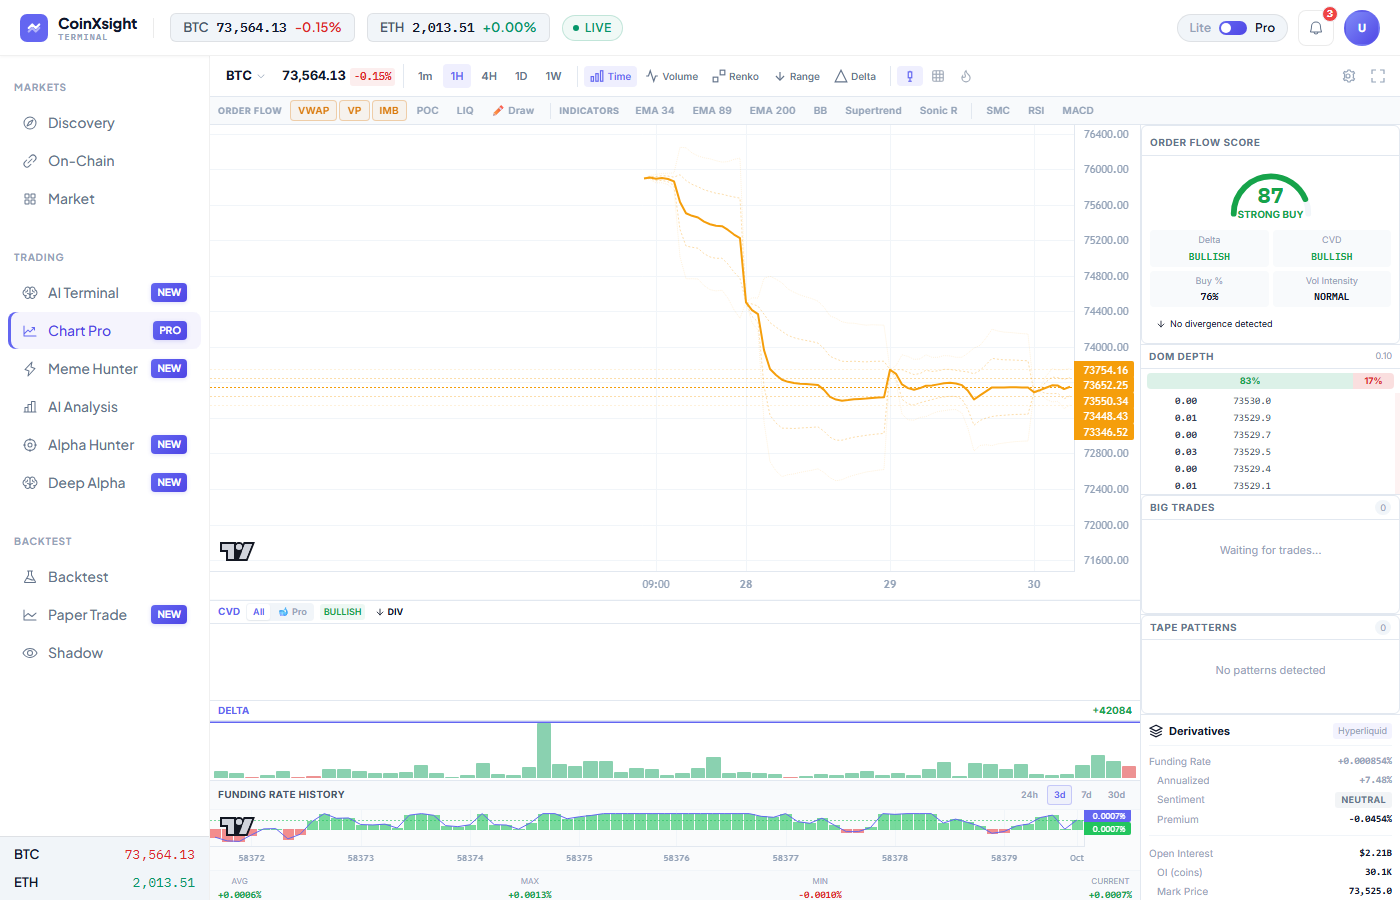
CoinXSight Chart Pro (May 30, 2026) — BTC at $73,564, Order Flow Score 87 STRONG BUY, Delta +42,084 BULLISH, Funding Rate +0.0009%, Open Interest $2.2B:
Layer 3: Chart Patterns with the Highest Win Rate
Not all patterns are created equal. In 2026's institutional market, some patterns have significantly higher success rates when traded with proper risk-reward targets.
[!NOTE]
Understanding Win Rates: Win rates are highly dependent on your target Risk-Reward Ratio (R:R). A high win rate with a poor R:R (e.g., risking $2 to gain $1) is unprofitable. The win rates below represent historical performance when target R:R is set to at least 1:2 in trending market regimes. These probabilities drop significantly during sideways range conditions.
Pattern
Direction
Win Rate (Trending)
Recommended R:R
Key Confirmation
Double Bottom
Bullish reversal
65-70%
1:2
Neckline break on high volume
Head & Shoulders
Bearish reversal
60-65%
1:2
Neckline break + RSI below 50
Bull Flag
Bullish continuation
70-75%
1:2.5
Breakout with 2x volume + funding rate neutral
Fair Value Gap (FVG)
Both directions
55-60%
1:1.5
Price returns to fill gap within 72 hours
Wyckoff Spring
Bullish reversal
60-65%
1:3
Sharp wick below support + immediate recovery
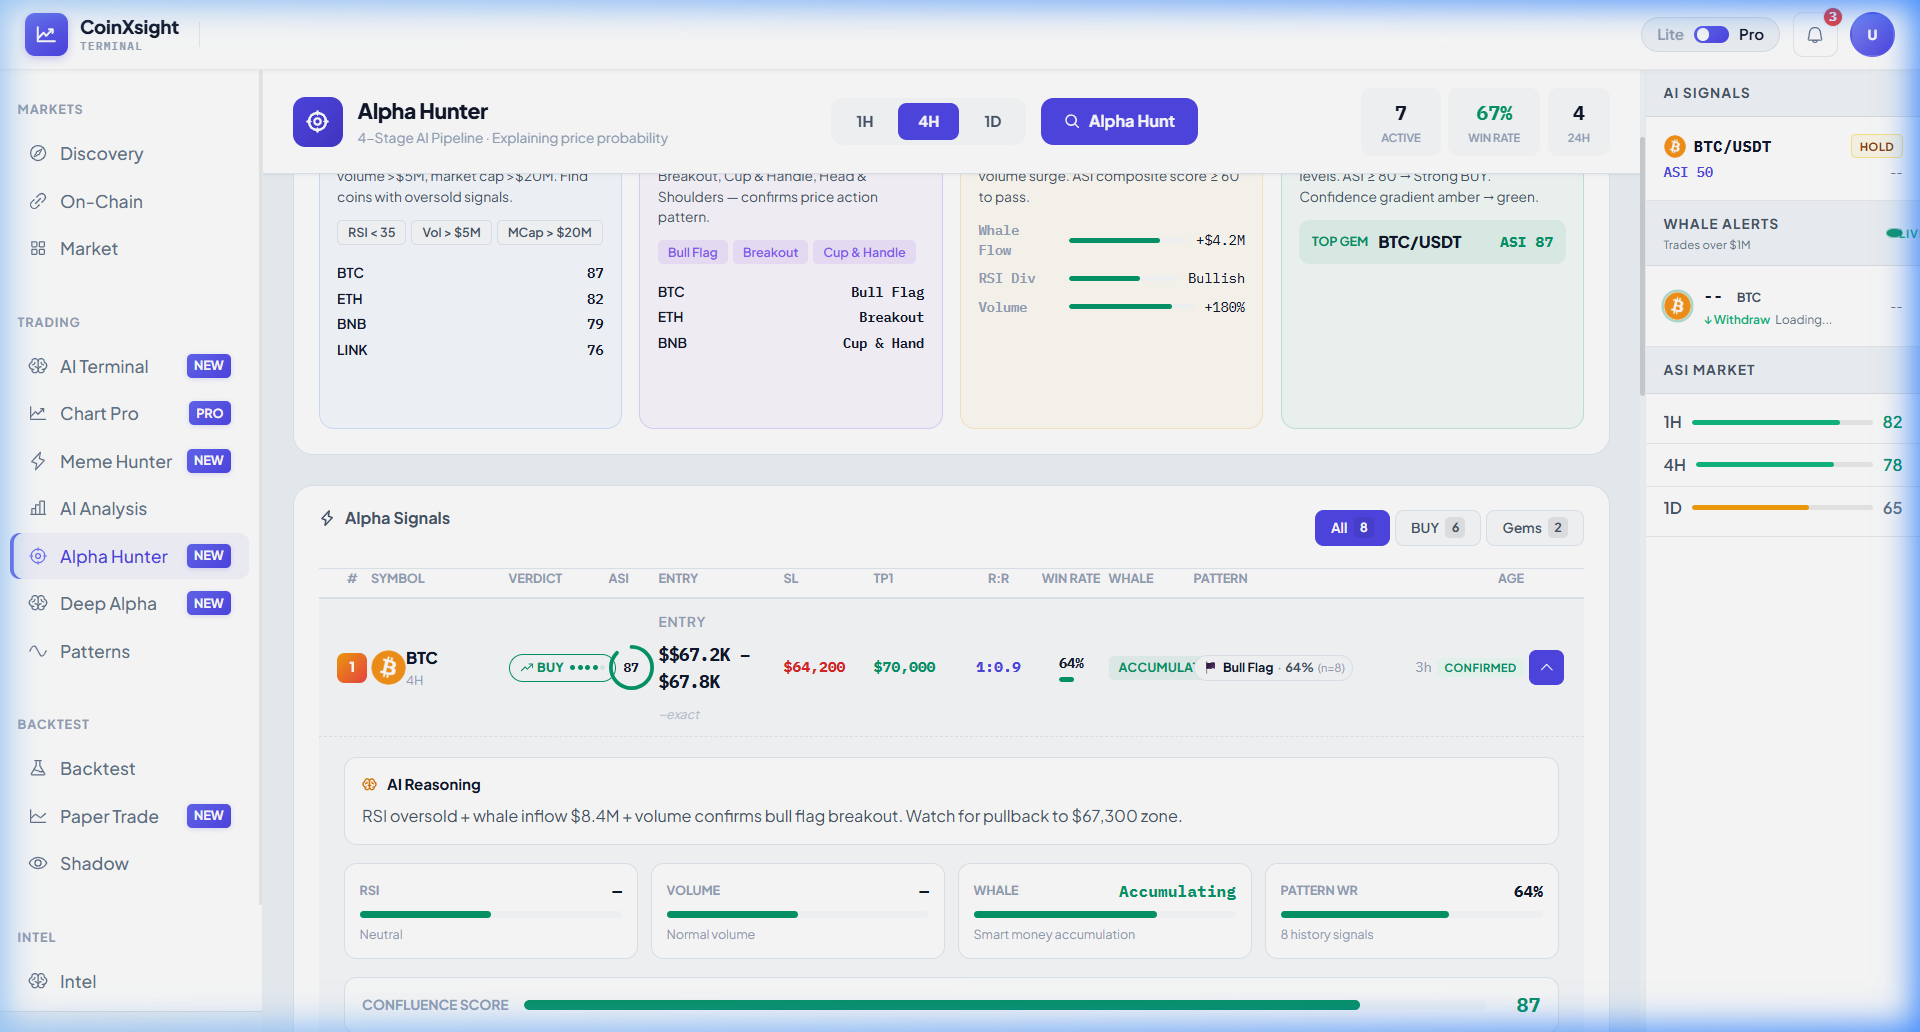
CoinXSight's Alpha Hunter currently shows Wyckoff Spring + No Supply patterns detected on SEI ($0.068, ASI Score 67) and SUI ($0.906, ASI Score 24) — both at Confluence Stage 3 "The Confirmation," meaning multiple independent signals have aligned.
This is where crypto TA has a genuine advantage over stock trading. In traditional markets, you can't see who's buying or selling. In crypto, you can see exactly where coins are moving.
The 3 on-chain signals that matter most for TA:
1. Exchange Netflows
Coins flowing INTO exchanges = selling pressure (bearish). Coins flowing OUT = accumulation (bullish).
Right now, CoinXSight's on-chain data shows:
Bybit: -$155M net outflow (ACCUMULATING) — traders are withdrawing, not selling
Binance: +$1.34B net inflow (DISTRIBUTING) — coins are being deposited to sell
This creates a mixed signal across exchanges — useful context that pure TA would miss entirely. For real-time updates on these exchange flows, you can check institutional tracking feeds like Coinglass Exchange Reserves or CryptoQuant Exchange Flow.
2. Stablecoin Inflows
When USDT and USDC flow into exchanges, it means capital is arriving to buy crypto. This week's data:
USDT: +$200.7M net inflow to exchanges (223 transactions)
USDC: +$93.3M net inflow to exchanges (578 transactions)
Over $294M in stablecoins moved to exchanges this week — that's buying power waiting to deploy.
3. Whale Transactions
Large transactions ($1M+) from smart money wallets often precede significant moves. CoinXSight's Whale Flow module tracks these in real-time.
The final layer ties everything together. Instead of manually checking 4 indicators + market structure + on-chain data (which takes 20+ minutes per coin), AI confluence scoring does it automatically.
How CoinXSight's Confluence System Works:
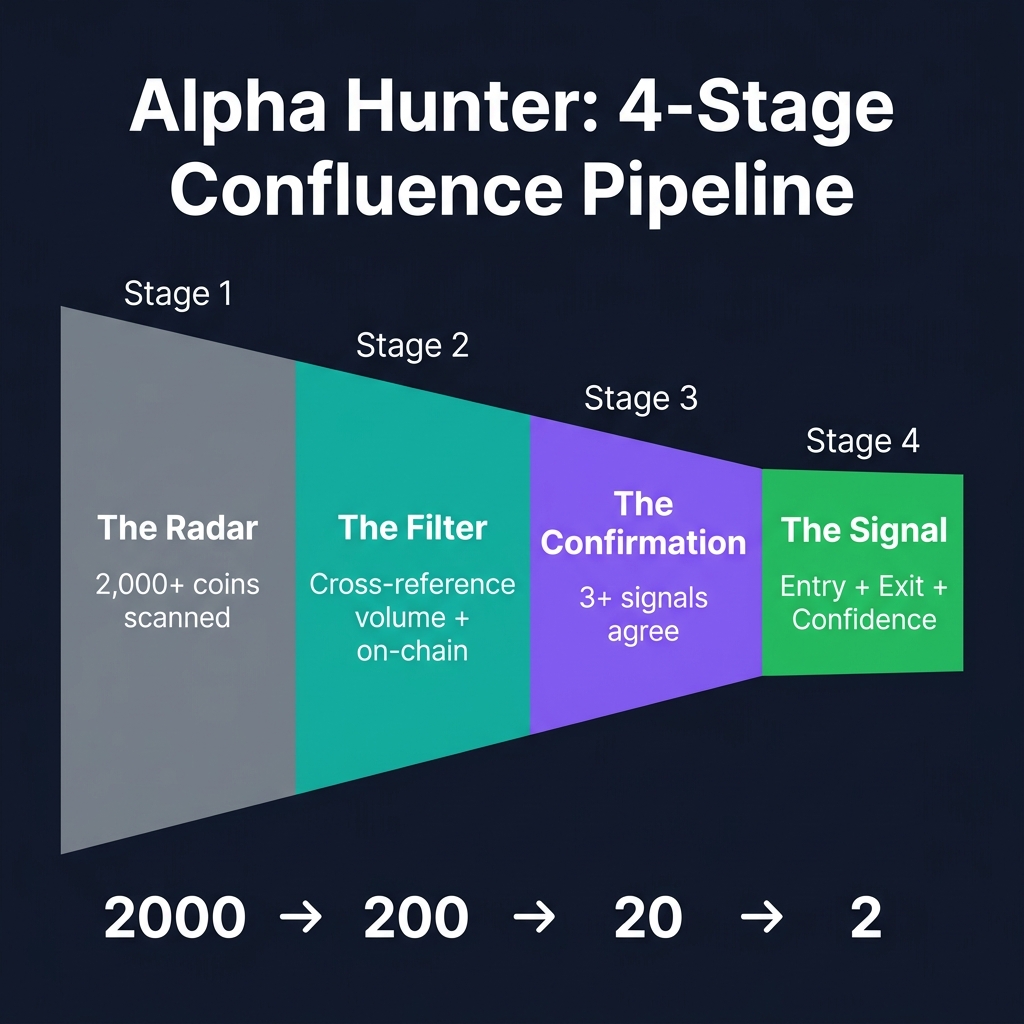
The system uses a multi-stage pipeline:
Stage 1 — The Radar: AI scans 2,000+ coins for initial signals (RSI extremes, MACD crossovers, pattern breakouts)
Stage 2 — The Filter: Signals are cross-referenced with volume, on-chain data, and market structure
Stage 3 — The Confirmation: Only signals with 3+ independent confirmations pass through
Stage 4 — The Signal: Final output with confidence score, direction, and specific entry/exit levels
Currently, only 2 coins have reached Stage 3 (The Confirmation): SEI (Confluence Score 45, ASI 67) and SUI (Confluence Score 35, ASI 24). That's 2 out of 2,000+ — showing how selective the system is.
Identify range: Price is bouncing between clear support and resistance
Spot divergence: Price makes a new low within the range, but RSI makes a higher low (bullish divergence)
Check CoinXSight: The ASI Score is above 50 and the unified signal is "BUY" or "NEUTRAL" (not "SELL")
Confirm on-chain: Exchange outflows increasing or stablecoin inflows rising
Enter near range support. Stop-loss below range low. Target the range high (resistance)
Real example (May 30, 2026): COOKIE shows RSI at 23.3 with confirmed bullish divergence, ASI Score 67 (positive), and a BUY signal with 3 independent confirmations. This matches the strategy criteria perfectly.
Strategy 3: Breakout with AI Pattern Recognition
Best for: Volatile markets, narrative-driven coins
Timeframe: 1H or 4H
Win rate: 45-55% (lower win rate but larger winners)
Setup:
AI detects a pattern: CoinXSight's Pattern Scanner identifies a bull flag, ascending triangle, or Wyckoff Spring
Pattern confidence is 60%+
Wait for breakout: Price breaks above the pattern's resistance line
Volume confirms: Breakout candle has 2x+ the 20-period average volume
Check the pipeline: Signal has reached Stage 2 or Stage 3 in Alpha Hunter
Enter on the breakout candle. Stop-loss below the pattern's last swing low. Trail stops as price moves
Real example (May 30, 2026): SEI shows a Wyckoff Spring + No Supply pattern at 65% confidence, having reached Stage 3 (The Confirmation) in Alpha Hunter with a Confluence Score of 45. This would qualify as a setup worth watching.
The 2026 TA Toolkit
You don't need 10 subscriptions. Here's the efficient stack:
Only trade signals with 3+ confirmations. CoinXSight's confluence system filters this for you
6
Wrong timeframe
Day trading on the 1-minute chart without experience
Start on 4H and Daily. Lower timeframes need faster decisions and generate more false signals
7
No trade journal
"I'll remember" — no, you won't
Record every trade: entry reason, exit reason, result, emotion. Pattern recognition improves with data
The 20-Minute Daily TA Checklist
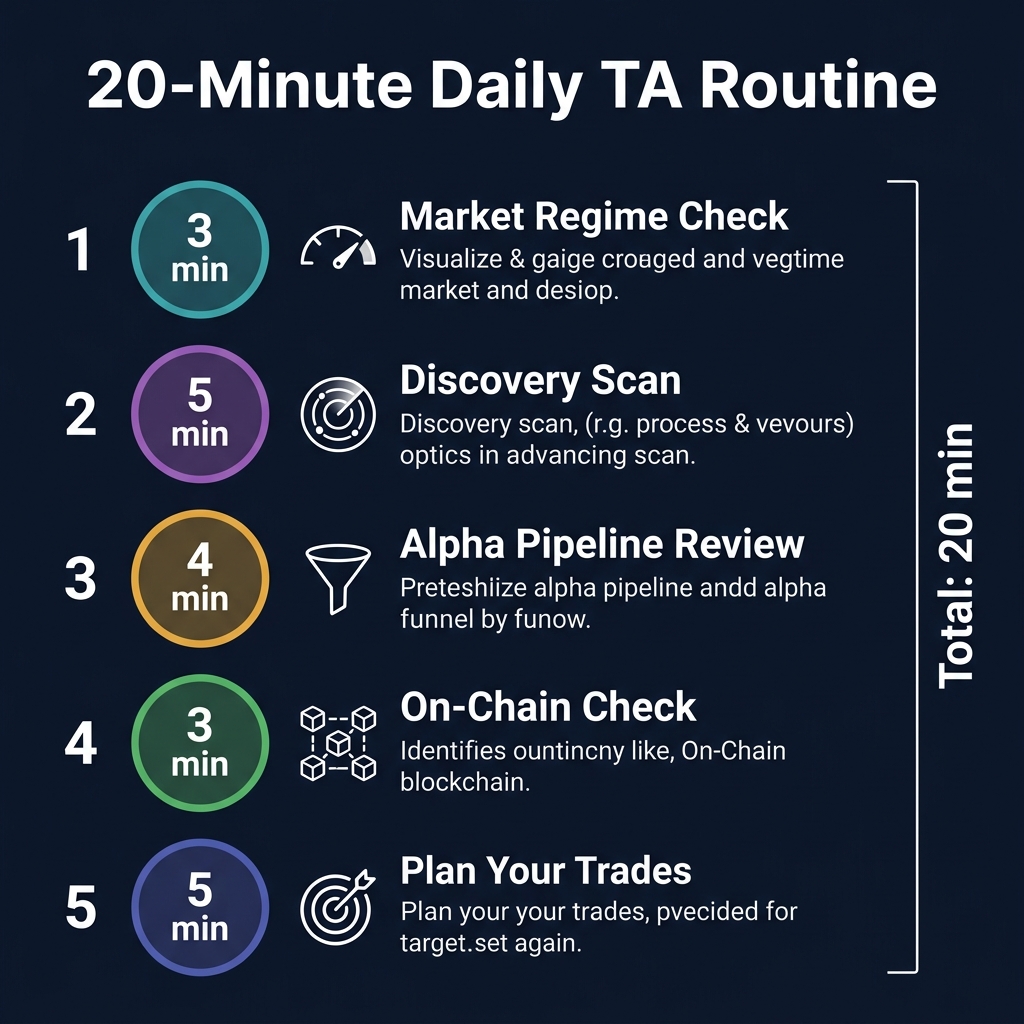
Use this routine every morning before making any trading decisions:
Step
Time
What to Do
CoinXSight Tool
1. Market Regime
3 min
Check BTC and ETH on the daily timeframe. Are we trending, ranging, or volatile? Check ASI scores for macro direction
Dashboard → ASI Market
2. Discovery Scan
5 min
Review top signals from CoinXSight Discovery. Filter for assets with Discovery Score > 30 and Confirmed signals
Discovery → Signal Triage
3. Alpha Pipeline
4 min
Check Alpha Hunter for Stage 2-3 signals. These are the highest-probability setups of the day
Alpha Hunter → Pipeline
4. On-Chain Check
3 min
Review exchange netflows and stablecoin dynamics. Is capital flowing in or out? Are whales buying or selling?
On-Chain → Exchange Flows
5. Plan Trades
5 min
For any signal that passed all checks: define entry, stop-loss, target, and position size BEFORE entering
Deep Alpha → Coin Analysis
Total: 20 minutes. This replaces hours of manual chart checking across dozens of coins.
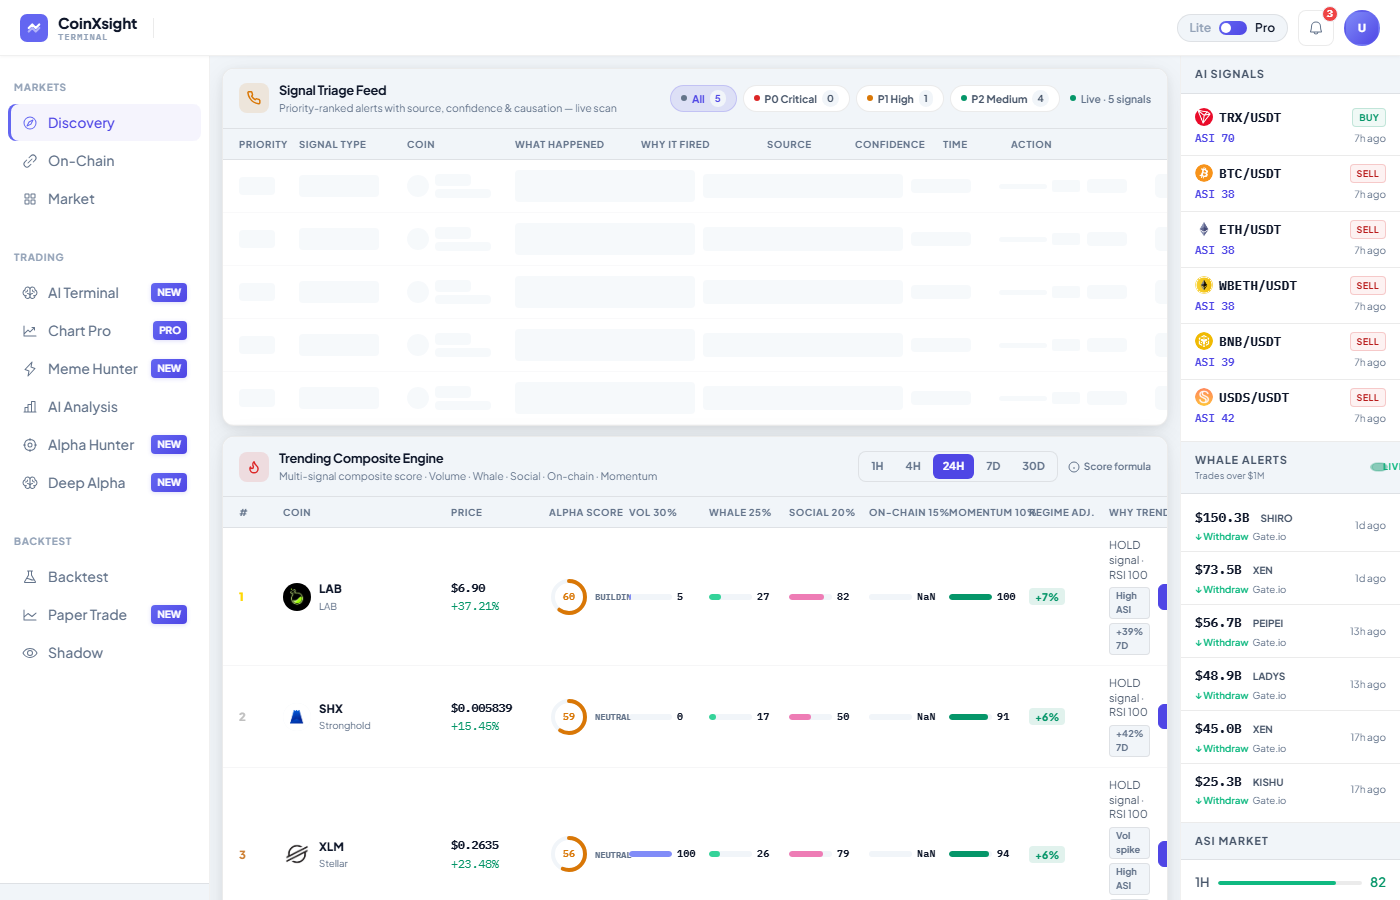
CoinXSight Discovery (May 30, 2026) — AI Signals panel: TRX ASI 70 BUY, BTC ASI 38 SELL, ETH ASI 38 SELL. Trending Composite Engine: LAB $6.90 +37.21% (Alpha Score 68), SHX +15.45%, XLM +23.48%. Whale Alerts: $150.3B SHIRO withdrawal:
Frequently Asked Questions
Does technical analysis actually work for crypto?
Yes, but it's a probability tool, not a crystal ball. TA increases your odds of good timing but never guarantees outcomes. The key is combining multiple signals (confluence) and managing risk so that your winners outweigh your losers over time. CoinXSight's multi-layer approach automates much of this confluence checking.
What are the best indicators for crypto in 2026?
RSI (for divergence), EMA 50/200 (for trend), Volume (for confirmation), and Funding Rate (for sentiment). These four cover different analytical dimensions without overlapping. For detailed guides on each, see our RSI guide, EMA guide, and MACD guide.
How do I identify support and resistance levels?
Look for price levels where price has reversed at least 2-3 times in the past. The more times price bounces off a level, the stronger it is. Volume Profile (available in CoinXSight Chart Pro) shows you where the most trading activity occurred — these high-volume zones act as natural support and resistance. See our Support and Resistance guide.
Which timeframes should I use?
For swing trading: Daily for direction, 4H for entry. For day trading: 4H for direction, 1H for entry. Always use at least 2 timeframes — a higher timeframe for the trend and a lower timeframe for precision entries. See our Multi-Timeframe Analysis guide.
What's the difference between technical and fundamental analysis?
Technical analysis studies price behavior (charts, indicators, patterns). Fundamental analysis studies project value (team, technology, tokenomics). Most professional traders use both: fundamental analysis to choose WHAT to trade, technical analysis to decide WHEN to trade. In 2026, on-chain analysis has emerged as a third category that bridges both.
Can I use the same TA for all cryptocurrencies?
The same principles apply, but parameters should differ. BTC respects support/resistance more reliably due to institutional participation. Altcoins are more volatile and prone to liquidity hunting. Meme coins have almost no reliable TA — they're driven by narrative and social momentum, not technical patterns.
How do I use volume to confirm a breakout?
A genuine breakout should have at least 2x the 20-period average volume. If price breaks resistance but volume is below average, it's likely a false breakout that will reverse. CoinXSight's Discovery Scan automatically flags volume anomalies.
How long does it take to learn technical analysis?
Basic competence: 2-4 weeks of daily practice. Consistent profitability: 6-12 months of trading with a journal and risk management. AI tools like CoinXSight can accelerate this learning by showing you what professional-grade analysis looks like in real-time — but they don't replace the experience of reading charts yourself.
Crypto technical analysis in 2026 isn't about memorizing indicator formulas — it's about building a systematic framework that combines price action, momentum, on-chain evidence, and AI-powered confluence into high-probability trading decisions. The market has evolved. Your analysis should too.
Start building your own 5-layer TA framework today — explore CoinXSight's free analytics tools and see how AI-enhanced technical analysis works with real market data.
[!WARNING]
Financial Disclaimer: Trading cryptocurrencies involves substantial risk and may not be suitable for every investor. The high volatility of crypto assets can result in significant financial losses. The information provided in this guide is for educational purposes only and does not constitute financial, investment, or trading advice. Always conduct your own research, practice proper risk management, and consult with a licensed financial advisor before making any investment decisions.
About the Author
Sarah Mitchell is a Technical Analysis Specialist at CoinXSight, focusing on combining traditional chart patterns with modern on-chain metrics and machine learning algorithms. With over seven years of active trading experience, she specializes in swing trading strategies and trend-following frameworks. Connect with her on LinkedIn or follow her latest market updates on Twitter/X.
Master every cryptocurrency technical analysis indicator with this complete guide. Covers 27 indicators across trend, momentum, volume, volatility, and crypto-native…