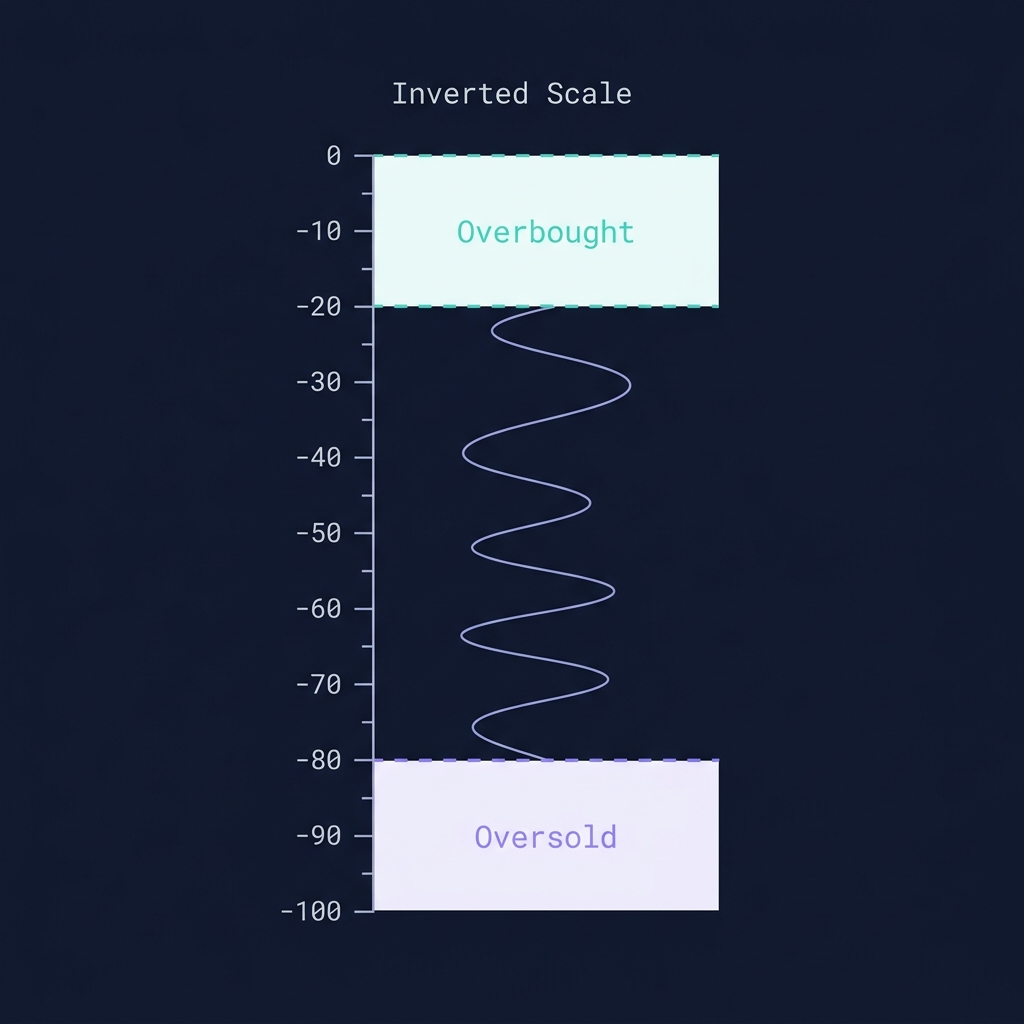
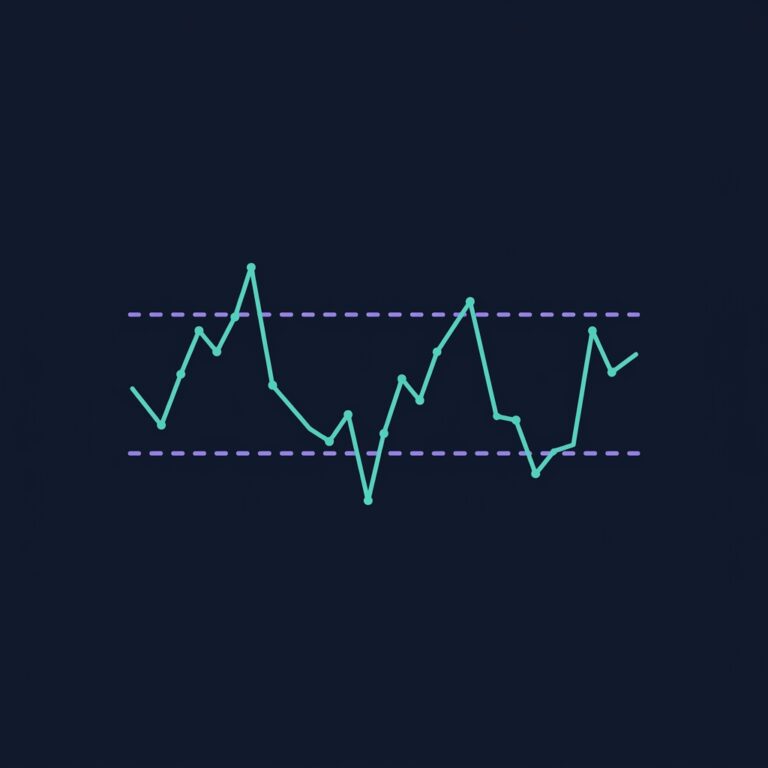
Williams %R (Williams Percent Range) is a momentum oscillator that measures where the current close sits relative to the highest high and lowest low of a lookback period. It ranges from 0 to -100 — yes, always negative. This inverted scale confuses beginners but becomes intuitive once you understand it:
%R = 0: Price closed at the highest high of the period — maximum bullish pressure
%R = -100: Price closed at the lowest low — maximum bearish pressure
%R = -50: Price is exactly in the middle of its range
Williams %R was created by Larry Williams, the legendary trader who turned $10,000 into $1.1 million in a single year during the 1987 World Cup Trading Championship. For a complete overview of all crypto indicators and how they work together, see our Cryptocurrency Technical Analysis Indicators guide.
💡 Williams %R is mathematically similar to Stochastic Oscillator but inverted. Where Stochastic %K reads 80 (overbought), Williams %R reads -20 (overbought). The signals are identical — the scale is just flipped.
How Williams %R Is Calculated
Williams %R = ((Highest High(N) - Close) / (Highest High(N) - Lowest Low(N))) × -100

Where:
  N = Lookback period (default: 14)
  Highest High = Highest high in last N periods
  Lowest Low = Lowest low in last N periods
The formula measures the distance from the current close to the top of the range, expressed as a negative percentage. When close equals the highest high, the numerator is 0, so %R = 0. When close equals the lowest low, the numerator equals the range, so %R = -100.
Default period: 14 (same as RSI, matching Wilder's standard lookback).
How to Read Williams %R — The 4 Key Signals
Signal 1: Overbought and Oversold Zones
%R Reading
Zone
Meaning
0 to -20
Overbought
Price at top of its range — watch for pullback
-20 to -50
Bullish momentum
Price in upper half of range
-50 to -80
Bearish momentum
Price in lower half of range
-80 to -100
Oversold
Price at bottom of its range — watch for bounce
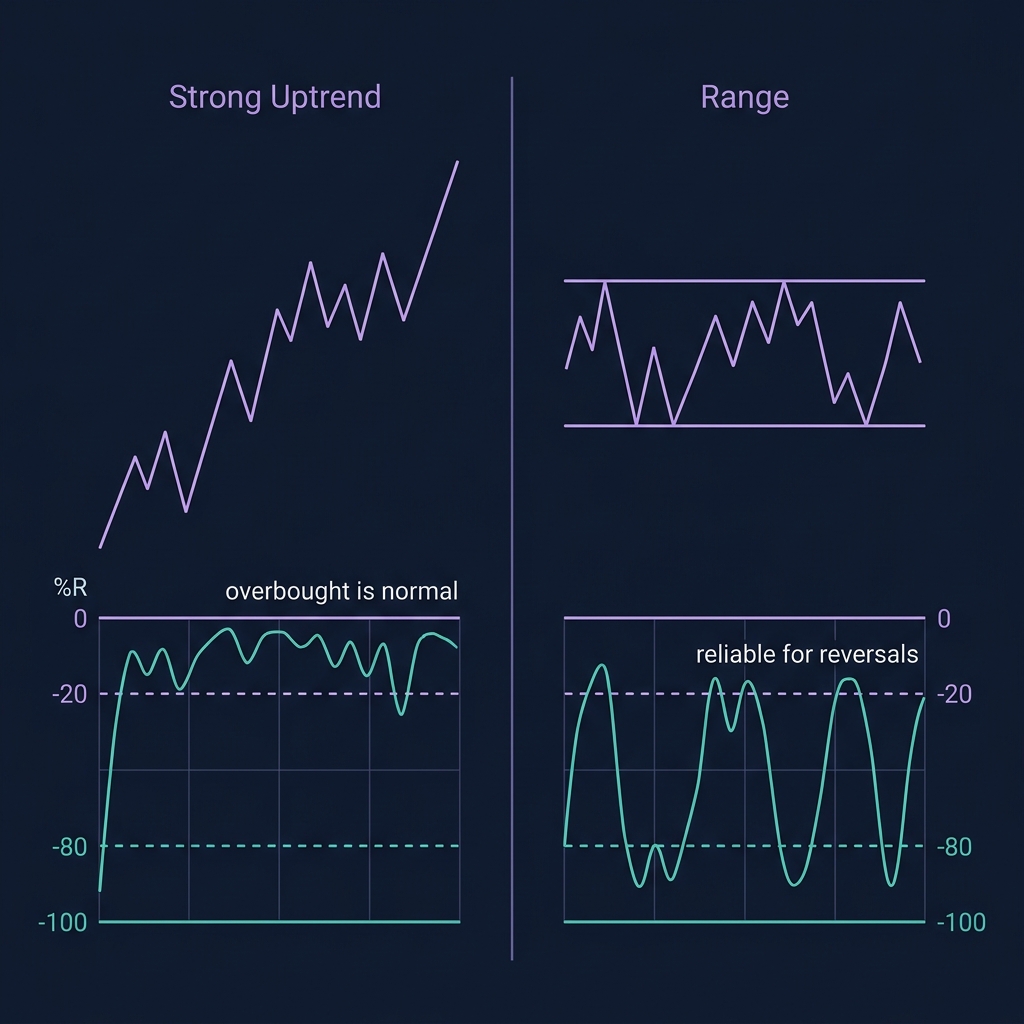
Critical rule: Overbought doesn't mean "sell." In strong uptrends, %R can stay in the 0 to -20 zone for weeks. Only treat overbought as a sell signal when the trend is weakening (ADX declining) or at known resistance levels.
Signal 2: Failure Swing
A %R failure swing is a high-probability reversal signal:
%R enters overbought (above -20)
Pulls back below -20
Rallies again but fails to reach -20
Drops below the pullback low → Sell signal
The mirror image applies for bullish failure swings from oversold territory.
Signal 3: Divergence
Like all momentum oscillators, divergence between price and %R signals momentum exhaustion:
Price makes higher high, %R makes lower high: Bearish divergence (trend weakening)
Price makes lower low, %R makes higher low: Bullish divergence (selling exhausting)
Signal 4: Zero-Line and -100 Extreme Touches
%R touching exactly 0 means price closed at the period's high — extreme momentum. %R touching -100 means price closed at the period's low. These extreme readings are rare and often mark short-term exhaustion points.
3 Real Trading Scenarios with Williams %R
Scenario 1: BTC %R Oversold at Support — March 16, 2026
Setup on CoinXSight Chart Pro:
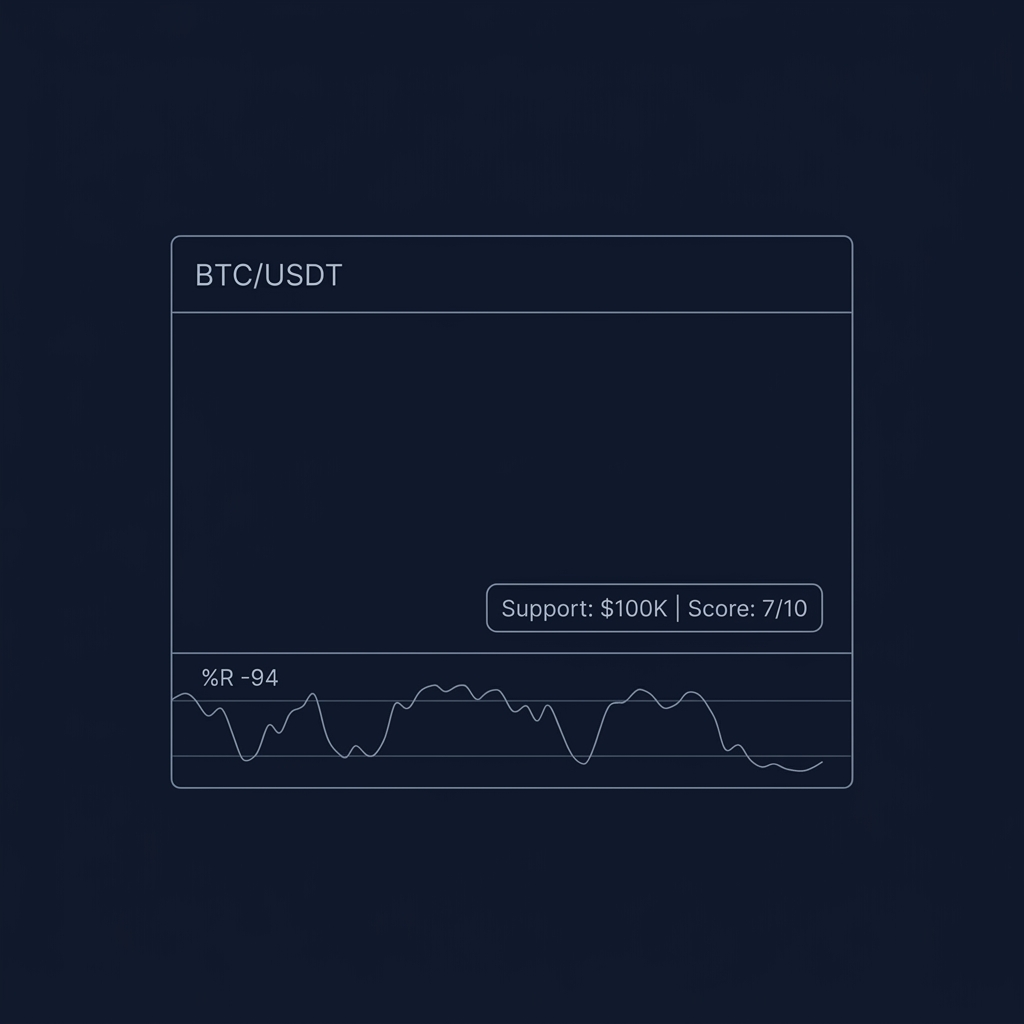
BTC dropped to $99,800, testing the critical $100K support level. Williams %R (14) on the 4H chart hit -94 — extreme oversold. RSI: 28. StochRSI: 0.05. The Confluence Score had dropped to 3/10 during the sell-off but was starting to tick up as volume declined.
Action: Long entry at $100,200 with stop at $98,500. Target: $106,000 (previous high).
Result: BTC bounced to $106,200 in 8 days (+6%). %R at -94 combined with multi-oscillator oversold alignment at a major support level was a textbook entry.
Scenario 2: ETH %R Divergence Warning — April 28, 2026
Setup:
ETH made a new high at $2,700 on April 28. Williams %R was -8 (overbought). But the previous high at $2,650 (April 15) saw %R at -2. Lower %R high despite higher price = bearish divergence.
Confluence Score: Declining from 7/10 to 5/10. MACD histogram was also declining.
Action: Tightened stop to $2,620 (below recent swing low). Took 50% profit at $2,690.
Result: ETH dropped from $2,700 to $2,520 within the next week (-6.7%). The %R divergence provided a 2-day early warning before RSI confirmed the reversal.
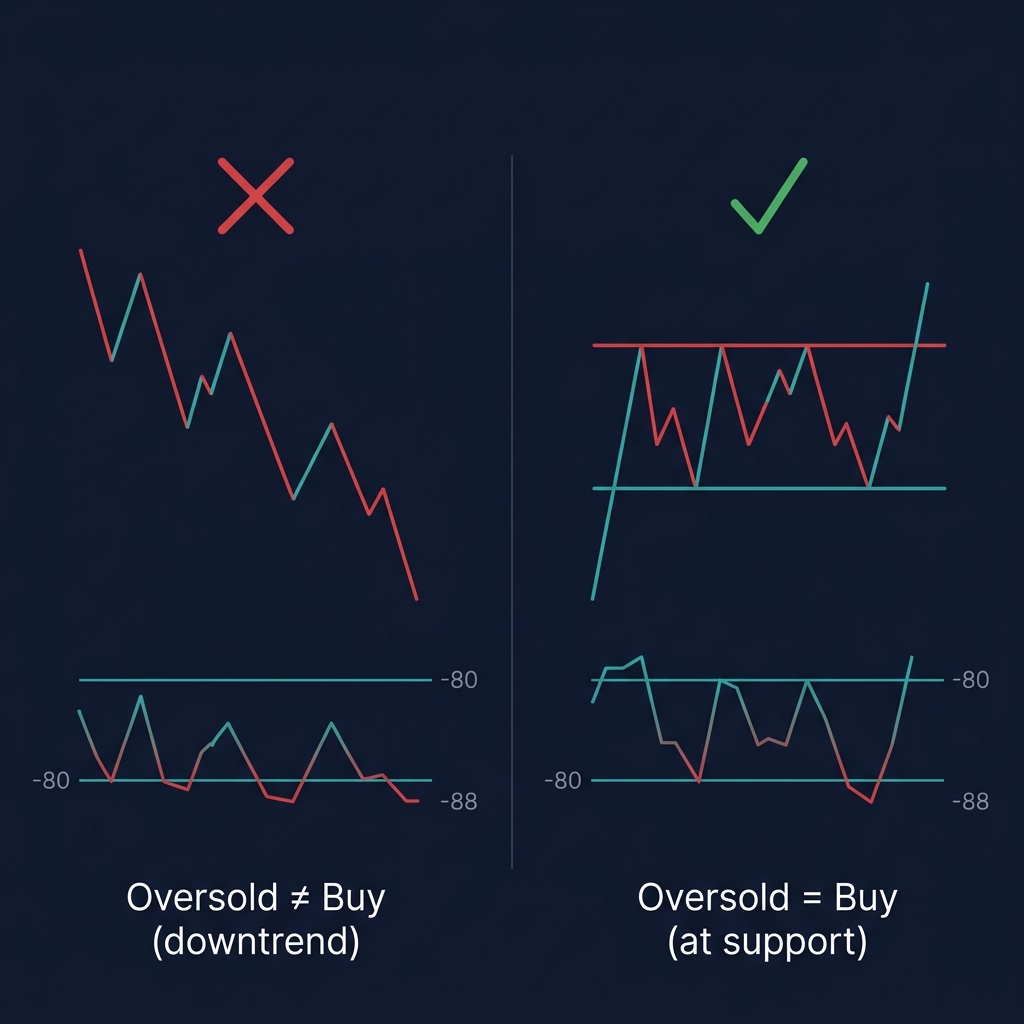
Scenario 3: SOL %R False Oversold in Downtrend — March 2026
SOL/USDT daily chart was in a clear downtrend (EMA 9 < 21 < 50, all declining):
%R reached -88 — oversold territory
But the trend was bearish (ADX at 32, declining DI+)
Confluence Score: 3/10 — no bullish confluence
Action: No trade. Oversold readings in a downtrend are not buy signals — they're just confirming selling pressure.
Result: SOL continued dropping another 8% before finding a real bottom. The oversold %R was just "oversold and getting more oversold."
Lesson: %R overbought/oversold only generates reliable reversal signals in ranging or weakly trending markets. In strong trends, use %R for pullback entries in the direction of the trend, not counter-trend reversals.
Use Williams %R when you need fast, raw reversal timing without the smoothing that RSI applies. It's the most responsive of the three — catching reversals earliest but with more noise.
Williams %R in the CoinXSight System
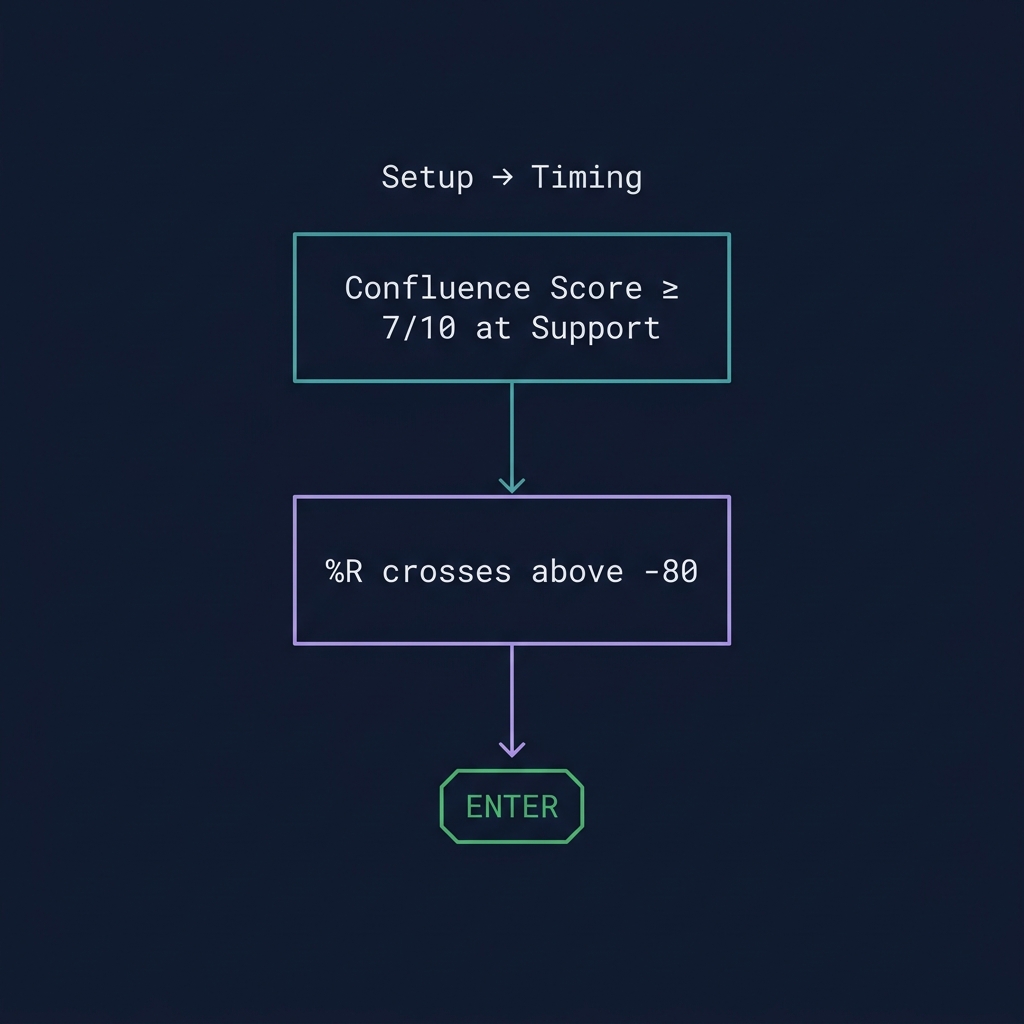
Williams %R serves as a timing refinement tool on Chart Pro. After the Confluence Score identifies a high-probability setup (≥ 7/10), use %R to time the exact entry:
Confluence Score hits 7/10 at a support level → Alert fires
Wait for %R to reach oversold (-80 or below) → Buyers exhausted
Enter when %R crosses back above -80 → Momentum shifting
Stop below the support level, target at resistance
This two-step process (Confluence for setup, %R for timing) reduces early entries that test your patience and stop-loss.
⚠️ Limitation: Williams %R is noisy on timeframes below 1H. The raw price-based calculation without smoothing means it oscillates rapidly on short timeframes. Stick to 4H or daily charts for reliable signals. For shorter timeframes, use StochRSI which applies additional smoothing.
How to Use Williams %R on CoinXSight
CoinXSight provides a crypto analytics platform where you can apply these concepts with real-time data:
Identify setups: %R entering oversold (-80) at support levels
Confirm with Confluence Score on Deep Alpha (require ≥ 6/10)
Enter when %R crosses back above -80 (momentum shifting)
Watch for %R divergence as a position management signal
Whether you want to buy Bitcoin, buy Ethereum, or trade altcoins, this indicator helps you time entries on any crypto exchange with data-driven confidence.
FAQ
What is Williams %R in simple terms?
Williams %R measures where price closed relative to its recent range. Reading near 0 means price closed at the top of its range (overbought). Reading near -100 means it closed at the bottom (oversold).
Why is Williams %R always negative?
The formula multiplies by -100, making all readings negative by design. Think of it as an inverted scale: -20 = overbought (like RSI 80), -80 = oversold (like RSI 20).
What is the best Williams %R setting for crypto?
Default 14-period works well for 4H and daily charts. For faster signals on 1H charts, try 10-period. For smoother daily signals, use 21-period.
How does Williams %R compare to Stochastic RSI?
Both are fast oscillators, but StochRSI applies the stochastic formula to RSI (double smoothing), while %R uses raw price data (no smoothing). %R is faster but noisier; StochRSI is slightly slower but cleaner.
Which crypto analytics platform offers the best williams %r tools?
CoinXSight provides williams %r analysis alongside 12+ other trading indicators, all integrated into an AI-powered Confluence Scoring system. It's a comprehensive crypto analytics platform that combines technical analysis with on-chain data and Smart Money Concepts for higher-probability trade setups.
JV
Julian Vance
TA // SYSTEMS
Lead Technical Systems Architect·Signals & Metrics Desk
Technical systems developer with a mathematical focus on momentum indicators, volatility metrics (ATR), volume profiles, and multi-timeframe filter models.
QUANTITATIVE SUITE // DEEP ALPHA ENGINEACTIVE
BTC/USDT // LIVE SCANNER
CONFLUENCE 77
LIVE SPOT PRICE$83,669.23MODERATE_BUY
TP2
$89,021.25
+7.04%
TP1
$85,510.14
+2.81%
ENTRY
$83,169.41
ZONE
SL
$81,999.04
-1.41%
Auto-detect Order Blocks, Fair Value Gaps and risk-adjusted DCA ladders in < 5s.
Master Stochastic RSI for crypto trading. Learn StochRSI formula, overbought/oversold zones, crossover signals, and how CoinXSight uses it in Confluence…
Master every cryptocurrency technical analysis indicator with this complete guide. Covers 27 indicators across trend, momentum, volume, volatility, and crypto-native…