Keltner Channels are volatility-based envelopes plotted above and below a moving average. They look similar to Bollinger Bands but behave differently because of how the bands are calculated:
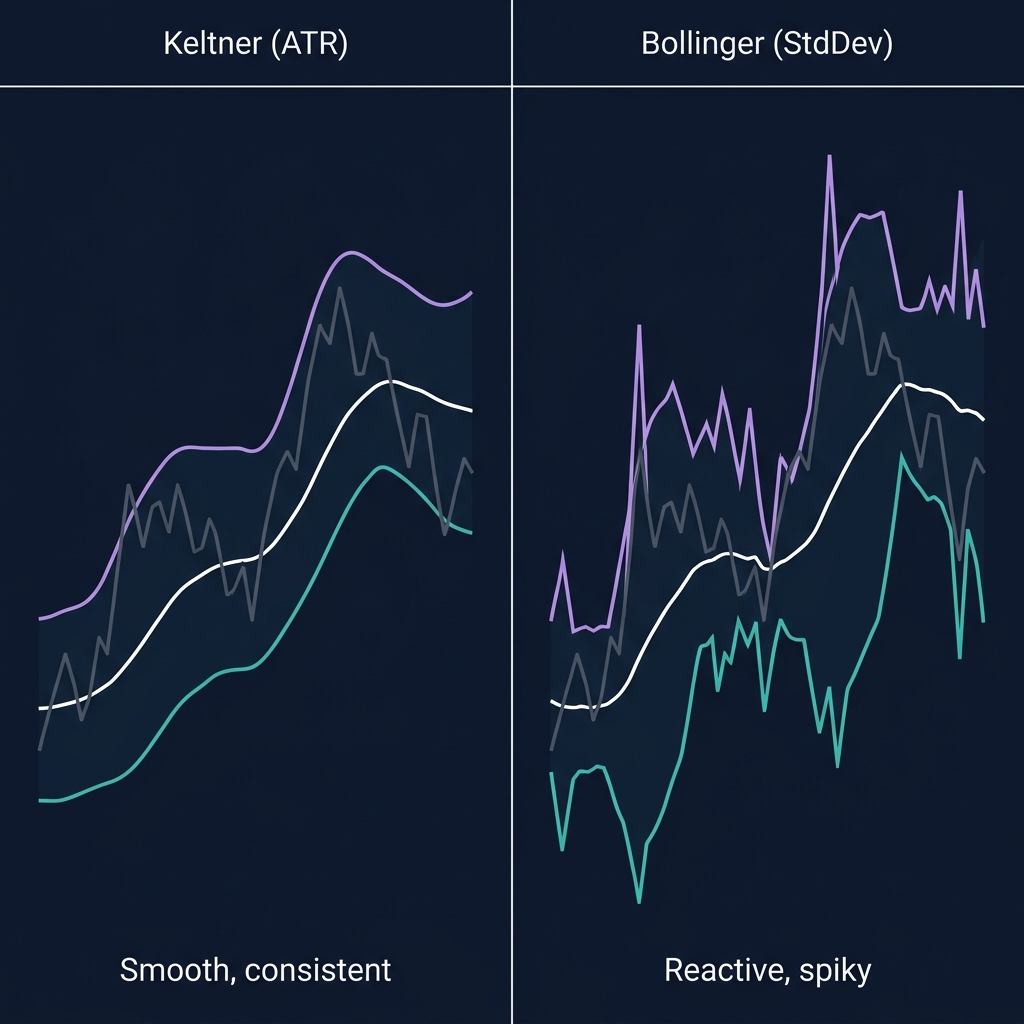
Bollinger Bands use standard deviation (statistical volatility)
This difference matters. ATR-based bands produce smoother channels that don't expand and contract as violently as Bollinger Bands during sudden spikes. Keltner Channels give you a cleaner read on whether price has genuinely left its normal range. For a complete overview of all crypto indicators and how they work together, see our Cryptocurrency Technical Analysis Indicators guide.
The original Keltner Channel was developed by Chester Keltner in 1960. The modern version, using EMA and ATR, was refined by Linda Raschke — a legendary floor trader and fund manager.
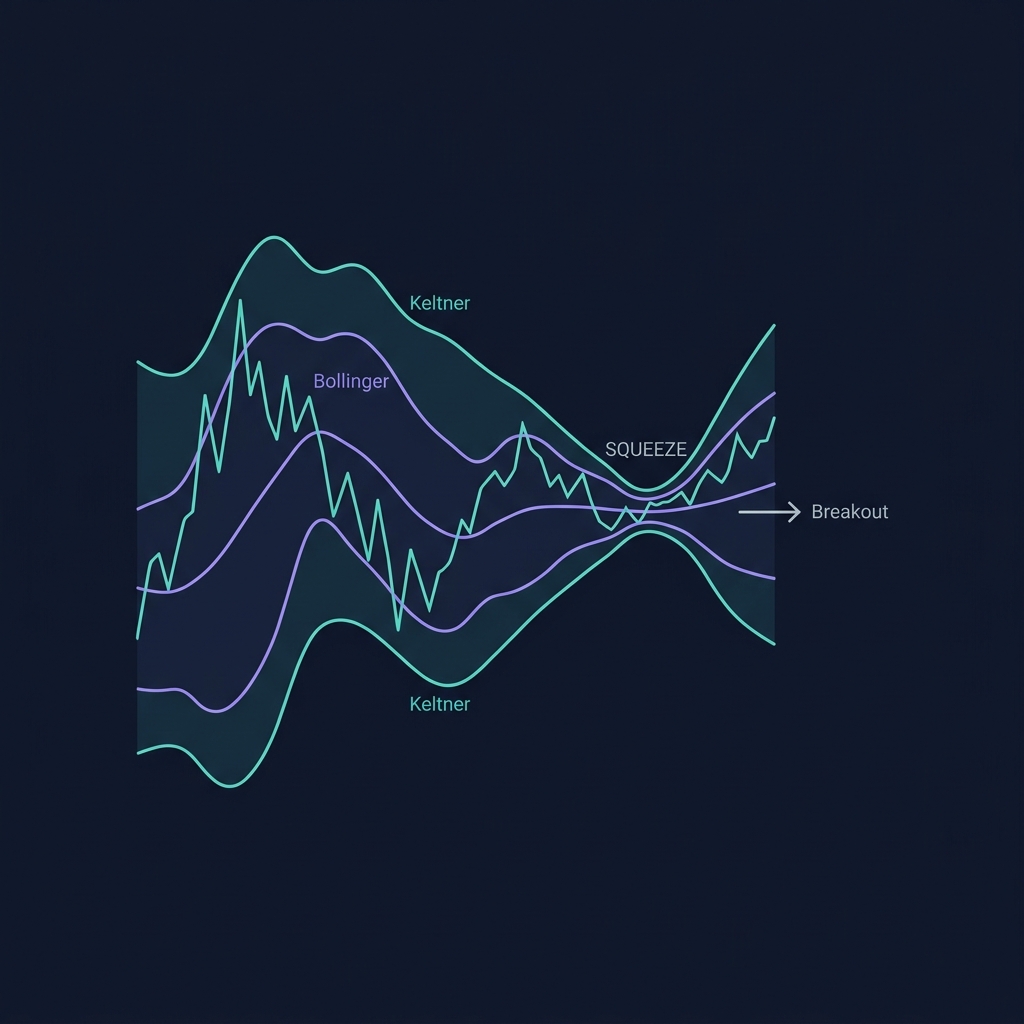
💡 The most powerful technique using Keltner Channels isn't the channels alone — it's the Bollinger-Keltner Squeeze setup, where Bollinger Bands contract inside Keltner Channels. This squeeze reliably precedes explosive breakouts. CoinXSight Chart Pro supports both indicators simultaneously for easy squeeze detection.
How Keltner Channels Are Calculated
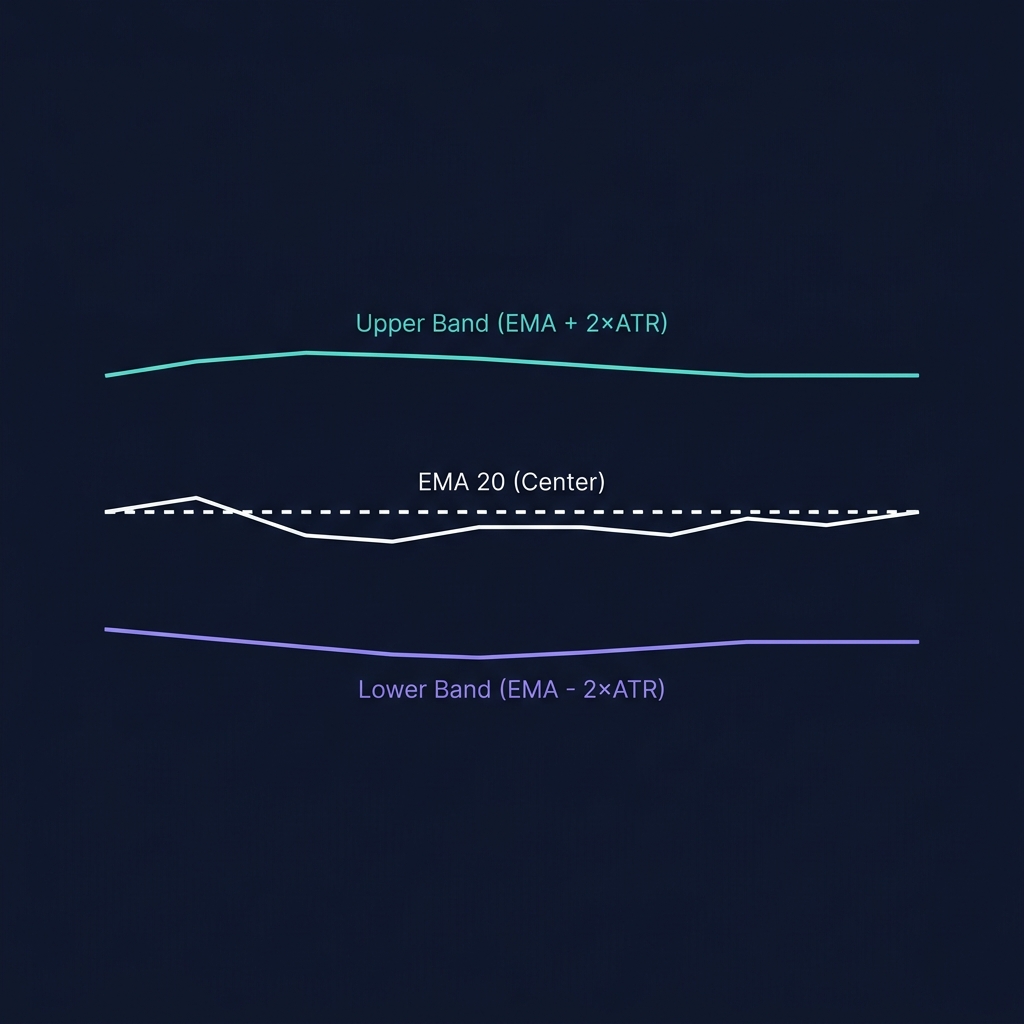
Middle Line = EMA(Close, 20)
Upper Band = EMA(Close, 20) + ATR(10) × 2.0
Lower Band = EMA(Close, 20) - ATR(10) × 2.0

Where:
  EMA = Exponential Moving Average
  ATR = Average True Range
  Default: EMA period = 20, ATR period = 10, Multiplier = 2.0
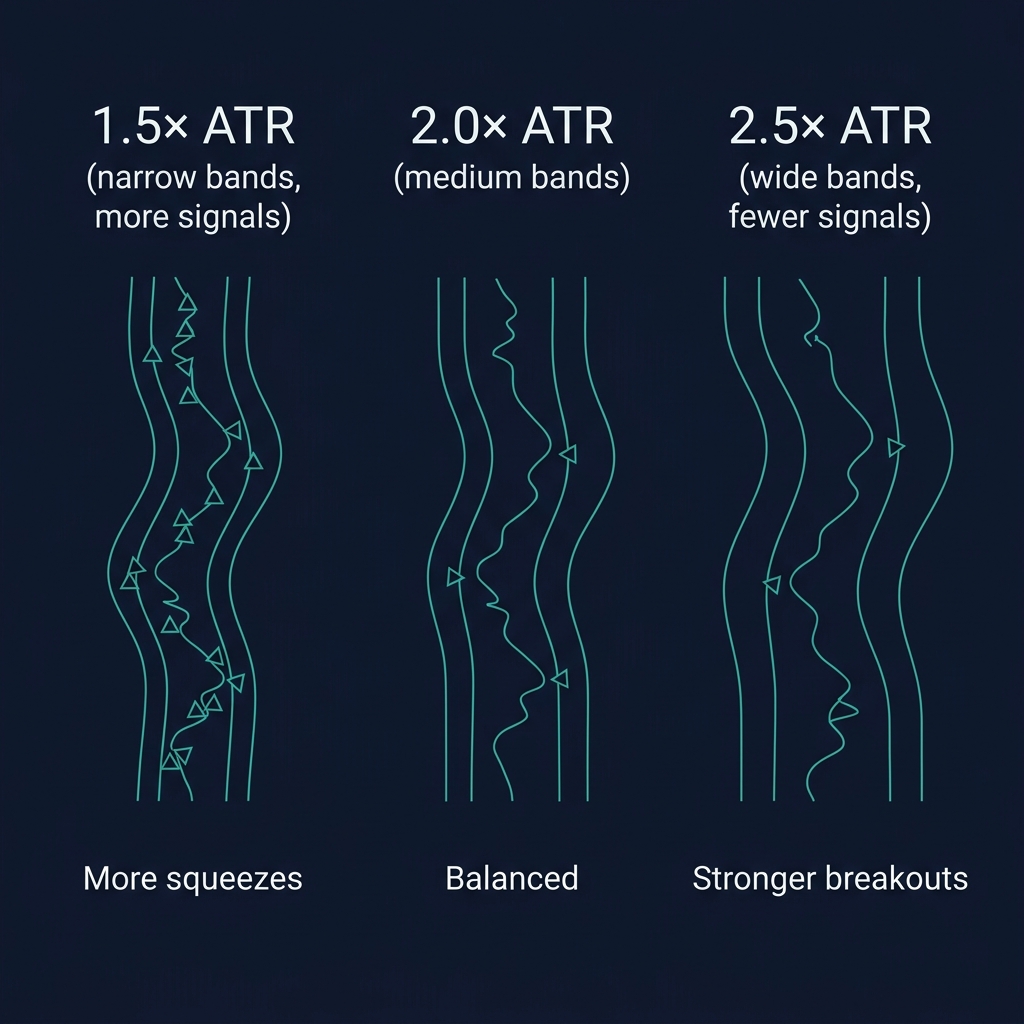
The ATR multiplier determines band width. A multiplier of 2.0 means the bands are placed 2× ATR above and below the EMA. Wider multipliers (2.5 or 3.0) produce wider bands with fewer breakout signals but higher reliability per signal.
Why ATR Instead of Standard Deviation?
Standard deviation (Bollinger Bands) can spike dramatically on a single large candle. ATR smooths over multiple candles, so Keltner Channels don't overreact to one-off price spikes. This makes Keltner better for detecting sustained breakouts vs noise.
How to Read Keltner Channels — The 5 Key Signals
Signal 1: Channel Breakout (Momentum Signal)
When price closes above the upper band, it has exceeded 2× ATR from its average — a statistically significant move. This signals strong momentum:
In a confirmed trend, the EMA (20) centerline acts as dynamic support (uptrend) or resistance (downtrend). Pullbacks to the centerline in a trending market are high-probability entry zones — similar to EMA pullback entries.
Signal 5: The Bollinger-Keltner Squeeze (TTM Squeeze)
This is the highest-value Keltner Channel setup. It occurs when:
Bollinger Bands contract inside the Keltner Channels
This means standard deviation has dropped below ATR — volatility is extremely compressed
When Bollinger Bands expand back outside Keltner Channels, the squeeze "fires"
The breakout direction often produces a 5-15% move in crypto
3 Real Trading Scenarios with Keltner Channels
Scenario 1: BTC Keltner Breakout — February 2026
Setup on CoinXSight Chart Pro:
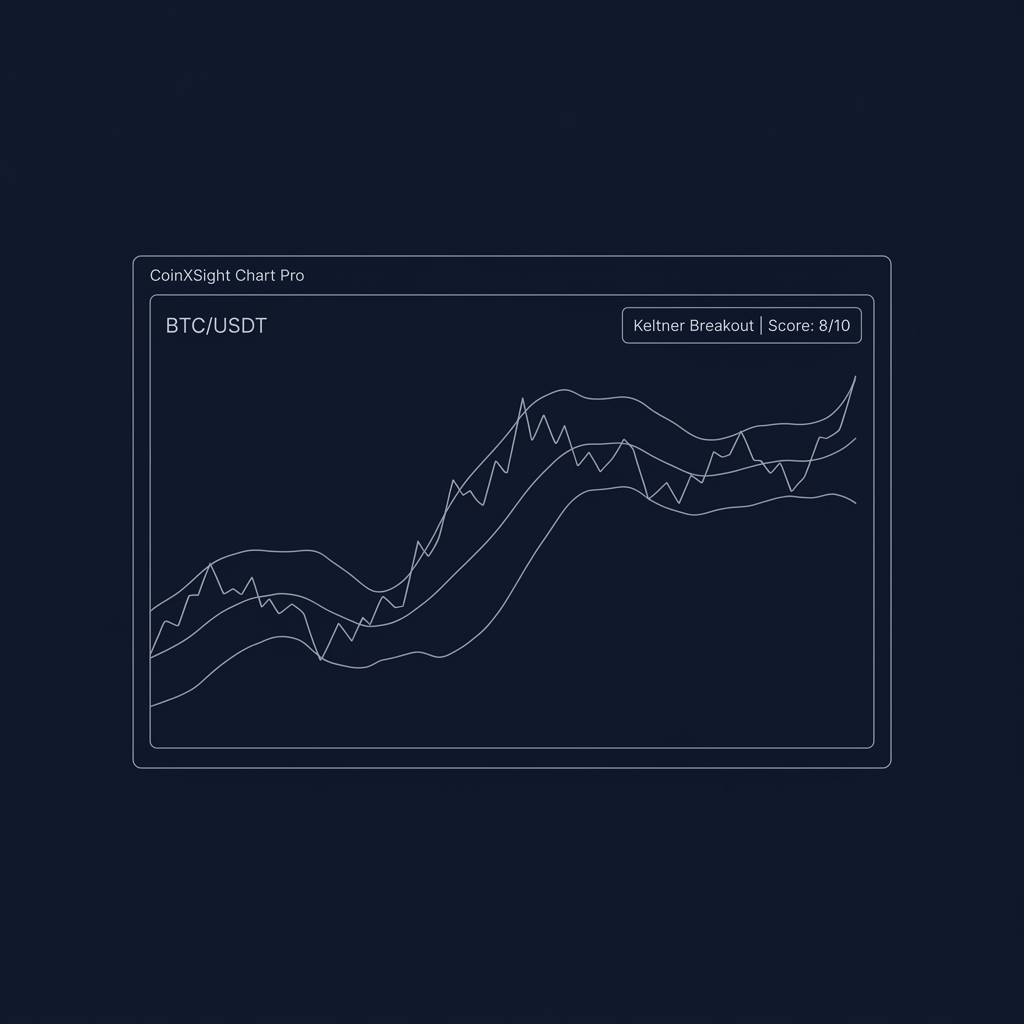
BTC/USDT daily chart: After 2 weeks of consolidation near $97,000, BTC closed above the upper Keltner Channel at $98,200 on February 1. The close was $99,500 — clearly above the upper band. ADX: 28 and rising. Moving average crossover: 9 EMA just crossed above 21 EMA. Confluence Score: 8/10.
Action: Long entry at $99,500 with stop at the EMA centerline ($96,800). Target: 2× ATR above entry ($104,500).
Result: BTC trended to $108,500 over 5 weeks. The Keltner breakout was the earliest signal — it fired 2 days before the Golden Cross.
Scenario 2: ETH Bollinger-Keltner Squeeze — March 2026
Setup:
ETH 4H chart: Bollinger Bands (20,2) contracted inside Keltner Channels (20, 2.0) for 3 days (March 7-10). ETH was ranging between $2,480-$2,520 — extremely tight. This squeeze pattern in crypto typically resolves with a 5-10% move.
ATR: At its lowest reading in 30 days — confirming extreme compression.
Action: Set breakout alerts at $2,530 (long) and $2,470 (short). Waited for the squeeze to fire.
Result: ETH broke upward on March 10, hitting $2,530 with expanding Bollinger Bands. Moved to $2,680 over the next 5 days (+6.4%). The squeeze-and-fire pattern provided an early entry with a tight stop ($2,470).
Scenario 3: SOL Keltner Mean Reversion — April 2026
Action: Long at $163 with stop at $158 (below the lower band). Target: EMA centerline at $170.
Result: SOL bounced to $172 within 3 days (+5.5%). In ranging markets, Keltner Channel lower band + oscillator oversold = reliable bounce setup.
Keltner Channel Settings for Crypto
Trading Style
EMA Period
ATR Period
ATR Multiplier
Best Timeframe
Swing trading
20
10
2.0
4H-1D
Day trading
20
10
1.5
1H-4H
Squeeze detection
20
10
1.5
4H (optimal)
Positional
50
14
2.5
1D-1W
For squeeze detection, many traders use Keltner ATR multiplier of 1.5 (tighter bands) so the squeeze fires more frequently. For pure breakout trading, 2.0 or 2.5 provides fewer but more reliable signals.
⚠️ Limitation: Keltner Channel breakouts in crypto can fail during low-volume periods (weekends, holidays). A price candle poking above the upper band on thin volume is unreliable. Always confirm breakouts with above-average volume and check the Volume Profile for validation. The squeeze setup is more reliable than raw breakout signals.
Keltner Channels in the CoinXSight System
Use Keltner Channels on Chart Pro as a volatility overlay complementing the Confluence Score:
Scenario
Keltner Signal
Confluence Use
Price above upper band + Confluence ≥ 7
Strong breakout — enter or add
High-conviction trend entry
Squeeze detected + Confluence ≥ 6
Set breakout alerts
Pre-position for the move
Price at lower band + Confluence ≥ 6
Mean reversion bounce
Range-trading entry
Price at EMA centerline in uptrend
Pullback buy zone
Trail stop adjustment
How to Use Keltner Channels on CoinXSight
CoinXSight provides a crypto analytics platform where you can apply these concepts with real-time data:
When Bollinger Bands contract inside Keltner → Squeeze alert
Wait for breakout direction, confirm with Confluence Score ≥ 6/10
Enter on the breakout candle, stop at the opposite channel band
Whether you want to buy Bitcoin, buy Ethereum, or trade altcoins, this indicator helps you time entries on any crypto exchange with data-driven confidence.
FAQ
What is the difference between Keltner Channels and Bollinger Bands?
Keltner uses ATR (smoothed range), Bollinger uses standard deviation (statistical). Keltner produces smoother, more consistent bands. Bollinger reacts faster to sudden spikes. Both are available on CoinXSight Chart Pro.
What is the Bollinger-Keltner Squeeze?
When Bollinger Bands contract inside Keltner Channels, volatility is extremely compressed. The subsequent breakout (when Bollinger expands back outside Keltner) often produces strong directional moves. This is also called the TTM Squeeze.
What are the best Keltner Channel settings for crypto?
EMA 20, ATR 10, multiplier 2.0 on 4H or daily charts works well for most crypto swing trading. For squeeze detection, use multiplier 1.5 for more frequent signals.
Can Keltner Channels predict crypto breakouts?
Keltner Channels don't predict direction, but the squeeze setup identifies when a breakout is imminent. Combined with ADX and Confluence Score, you can time entries as the breakout begins rather than chasing after the move.
Which crypto analytics platform offers the best keltner channels tools?
CoinXSight provides keltner channels analysis alongside 12+ other trading indicators, all integrated into an AI-powered Confluence Scoring system. It's a comprehensive crypto analytics platform that combines technical analysis with on-chain data and Smart Money Concepts for higher-probability trade setups.
JV
Julian Vance
TA // SYSTEMS
Lead Technical Systems Architect·Signals & Metrics Desk
Technical systems developer with a mathematical focus on momentum indicators, volatility metrics (ATR), volume profiles, and multi-timeframe filter models.
QUANTITATIVE SUITE // DEEP ALPHA ENGINEACTIVE
BTC/USDT // LIVE SCANNER
CONFLUENCE 93
LIVE SPOT PRICE$83,908.89STRONG_BUY
TP2
$89,725.68
+6.94%
TP1
$86,233.44
+2.77%
ENTRY
$83,905.28
ZONE
SL
$82,741.19
-1.39%
Auto-detect Order Blocks, Fair Value Gaps and risk-adjusted DCA ladders in < 5s.
Master every cryptocurrency technical analysis indicator with this complete guide. Covers 27 indicators across trend, momentum, volume, volatility, and crypto-native…