Multi-Timeframe Analysis: The Framework Pro Traders Use to Time Every Entry
Master multi-timeframe analysis for crypto trading. Learn the 3-timeframe rule, top-down analysis flow, timeframe alignment signals, and how to combine HTF bias with LTF precision for high-probability entries.
JV
Julian VanceLead Technical Systems Architect·May 22, 2026 · 14 min read · Updated Oct 6
Here's the scenario: You see a beautiful bullish setup on the 15-minute chart. RSI divergence, Order Block retest, volume increasing. You enter long. Five minutes later, the 4-hour downtrend resumes and you're stopped out.
This is the #1 reason traders lose money. They trade a lower timeframe signal that CONFLICTS with the higher timeframe trend.
Multi-Timeframe Analysis (MTA) solves this by giving you a systematic way to align your trades with the dominant trend. The rule is simple: the higher timeframe always wins. For a complete overview of all crypto indicators and how they work together, see our Cryptocurrency Technical Analysis Indicators guide.
The 3-Timeframe Rule
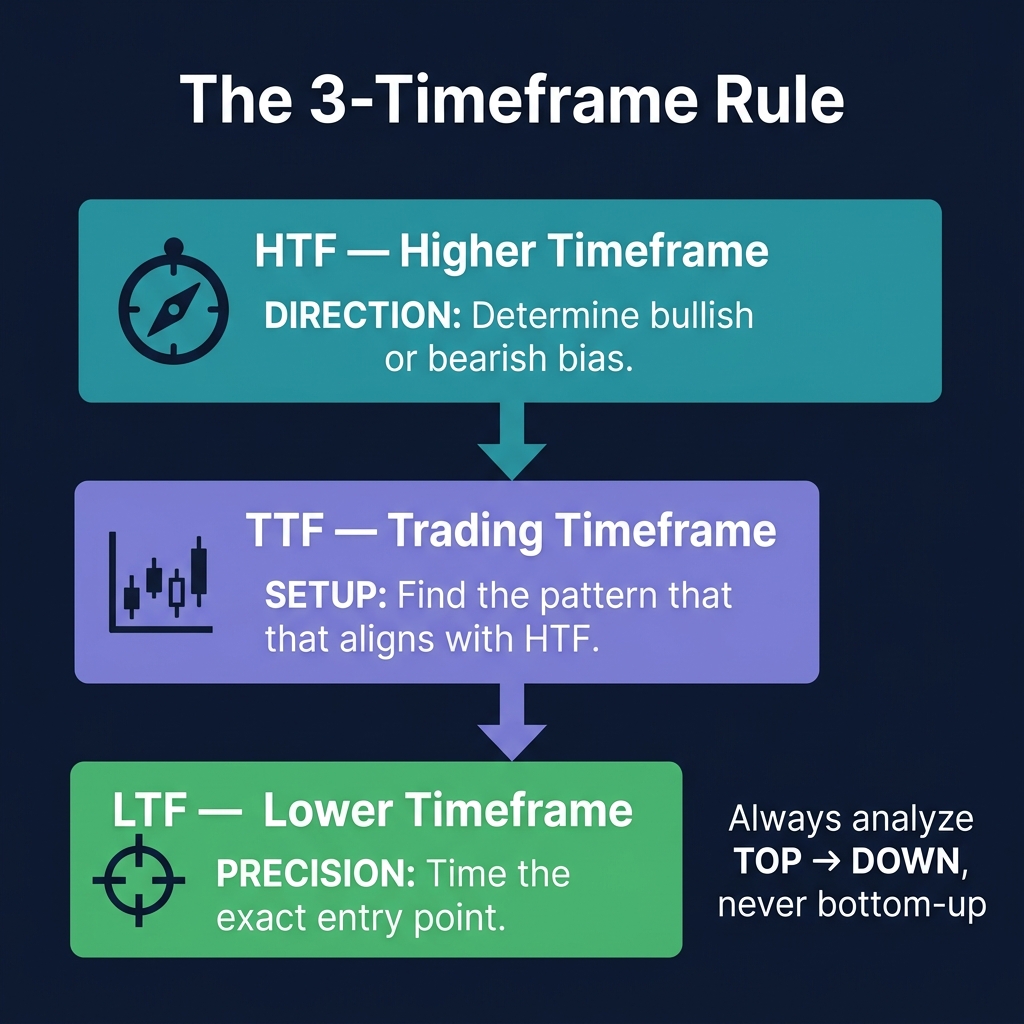
Every trade should be analyzed across exactly three timeframes. Not one. Not five. Three.
Timeframe
Role
What You Look For
Higher Timeframe (HTF)
Direction
Overall trend, major S/R, bias (bullish/bearish/neutral)
Trading Timeframe (TTF)
Setup
Pattern formation, signal confirmation, entry trigger
Lower Timeframe (LTF)
Precision
Exact entry point, stop placement, early confirmation
Timeframe Combinations by Trading Style
Trading Style
HTF (Bias)
TTF (Setup)
LTF (Entry)
Scalping
1H
15M
5M or 1M
Day Trading
4H
1H
15M or 5M
Swing Trading
Daily
4H
1H or 15M
Position Trading
Weekly
Daily
4H or 1H
The multiplier rule: Each timeframe should be roughly 4-6× larger than the next. This creates enough separation to see different market dynamics without redundancy.
Bad example: Using 5M, 10M, 15M — these are too close together and show the same information.
Good example: Using 4H, 1H, 15M — each shows genuinely different market structure.
The Top-Down Analysis Flow
Modern crypto analytics platforms integrate these signals with additional data layers — combining trading indicators, on-chain metrics, and AI analysis for higher-probability entries.
Always start from the highest timeframe and work DOWN. Never start from the lower timeframe — that's how you get trapped trading against the trend.
Step 1: HTF — Determine the Bias
Open your highest timeframe and answer ONE question: Is this bullish, bearish, or neutral?
Bullish bias criteria (all must be true):
Price is above the 50 EMA
Market structure shows higher highs and higher lows
No major resistance directly overhead
Bearish bias criteria (all must be true):
Price is below the 50 EMA
Market structure shows lower highs and lower lows
No major support directly below
Neutral/Range criteria:
Price is chopping around the 50 EMA
No clear HH/HL or LH/LL pattern
Price is between major S/R levels
If the HTF is neutral → SKIP. No trade. Neutral HTF means no edge, regardless of how good the lower timeframe setup looks.
Step 2: TTF — Find the Setup
Once you have a clear HTF bias, drop to your trading timeframe. Here you're looking for a specific setup that ALIGNS with the HTF direction.
Once the TTF shows a valid setup, drop to the lower timeframe for precise entry timing:
Wait for the LTF trend to align — If you're looking for a long on the TTF, wait for the LTF to show bullish structure (CHoCH from bearish to bullish)
Place your entry — At the LTF Order Block or FVG that caused the structure shift
Set your stop — Below the LTF swing low (for longs) or above LTF swing high (for shorts)
Set your target — Based on the TTF structure (next TTF resistance/support level)
Timeframe Alignment: The Confluence Multiplier
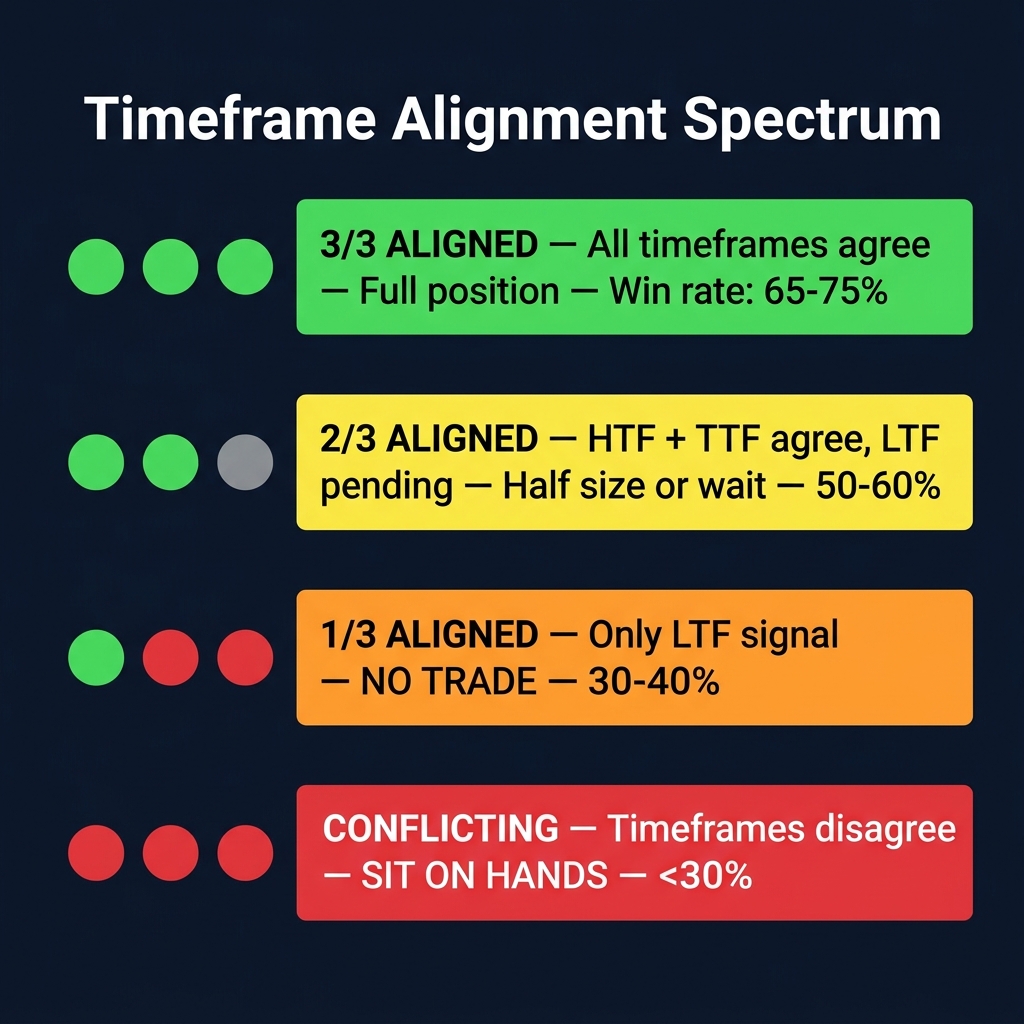
The probability of a trade increases dramatically when multiple timeframes agree.
The Alignment Spectrum
Alignment
Description
Win Rate Estimate
Action
3/3 Aligned
HTF + TTF + LTF all bullish (or bearish)
65-75%
Full position size
2/3 Aligned
HTF + TTF agree, LTF not yet aligned
50-60%
Wait for LTF confirmation or half size
1/3 Aligned
Only LTF shows signal, HTF/TTF disagree
30-40%
NO TRADE
0/3 — Conflicting
Timeframes contradict each other
<30%
NO TRADE — sit on hands
Reading the Alignment
Full alignment example (LONG):
Weekly (HTF):  Bullish — HH/HL, above 50 EMA, no resistance nearby
Daily (TTF):   Pullback to 21 EMA — bullish candle forming at support
4H (LTF):     CHoCH from bearish to bullish — Order Block entry available

→ ALL THREE AGREE: TAKE THE LONG with full conviction
Misalignment example (SKIP):
Weekly (HTF):  Bearish — LH/LL, below 50 EMA, in downtrend
Daily (TTF):   RSI oversold, potential bounce setup
4H (LTF):     Bullish divergence forming

→ TTF and LTF suggest long, but HTF is bearish
→ SKIP — you'd be trading against the dominant trend
→ At best, this is a counter-trend scalp (reduced size + tight stop)
Indicator Behavior Across Timeframes
The same indicator gives DIFFERENT signals on different timeframes. Here's how to interpret them:
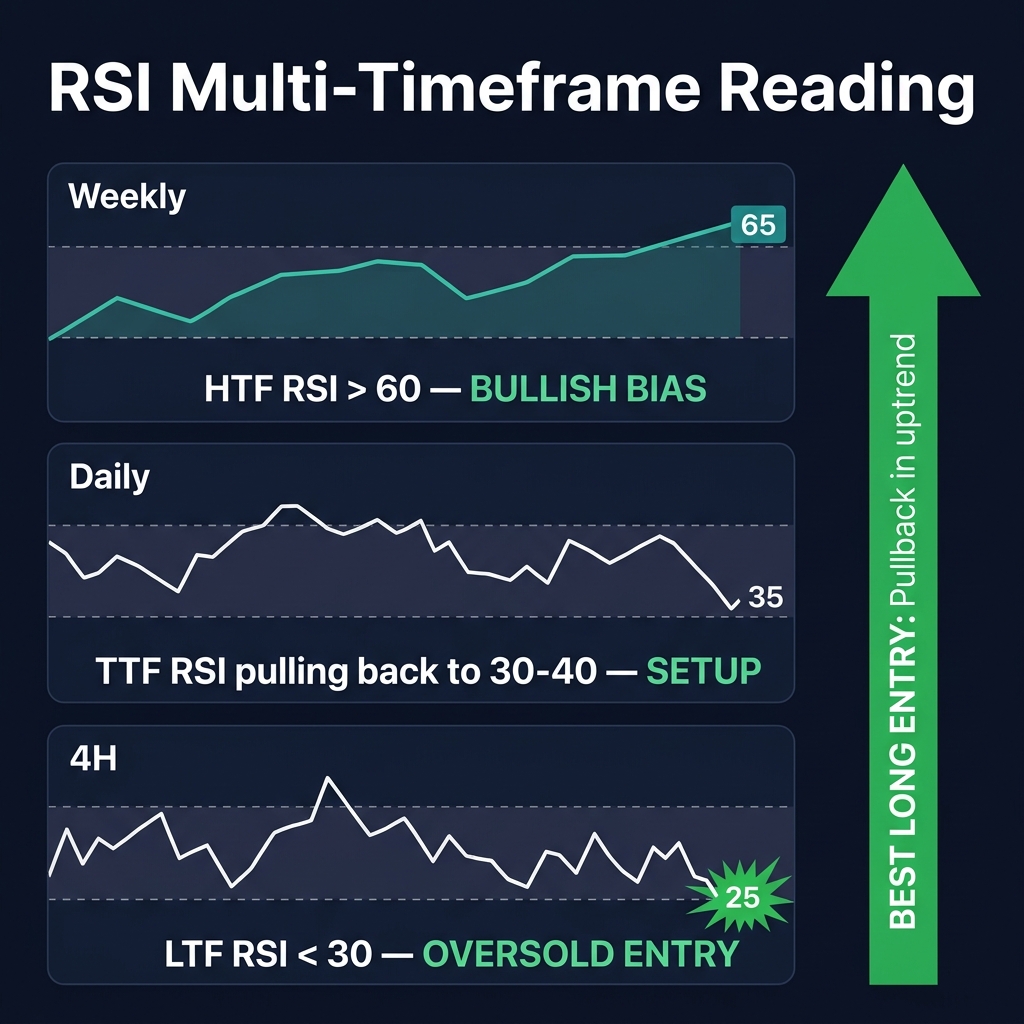
RSI Multi-Timeframe Reading
HTF RSI
TTF RSI
LTF RSI
Interpretation
>60 (bullish)
30-40 (pulling back)
<30 (oversold)
Best long entry — pullback in uptrend
>60 (bullish)
>70 (overbought)
>80 (extreme)
Take profit — overextended in uptrend
<40 (bearish)
60-70 (rallying)
>70 (overbought)
Best short entry — rally in downtrend
40-60 (neutral)
Any
Any
No trade — no HTF trend to ride
EMA Multi-Timeframe Reading
HTF EMAs
TTF EMAs
Signal
Price above 50 EMA
Price pulling back to 21 EMA
Buy the dip — trend pullback
Price above 50 EMA
Price above all EMAs
Late entry — wait for pullback
21 crossing above 50
Price above both
Golden cross — new trend confirmed
Price below 50 EMA
Price rallying to 50 EMA
Sell the rally — trend resistance
MACD Multi-Timeframe Reading
HTF MACD
TTF MACD
Signal
Above zero + rising
Histogram turning positive
Strong buy — momentum aligning
Above zero + rising
Histogram turning negative
Hold/wait — short-term pullback in uptrend
Below zero + falling
Histogram turning negative
Strong sell — momentum aligning bearish
Diverging from price
Any
Reversal warning — prepare for trend change
The "Fractal" Nature of Markets
Markets are fractal — the same patterns appear on every timeframe. A Wyckoff accumulation on the daily chart is made up of dozens of smaller accumulations on the hourly chart.
Why this matters:
A daily level is STRONGER than an hourly level because it represents more time and volume
When a daily level and an hourly level overlap at the same price → maximum confluence
The HTF always overrides the LTF when they conflict
Nested Support/Resistance
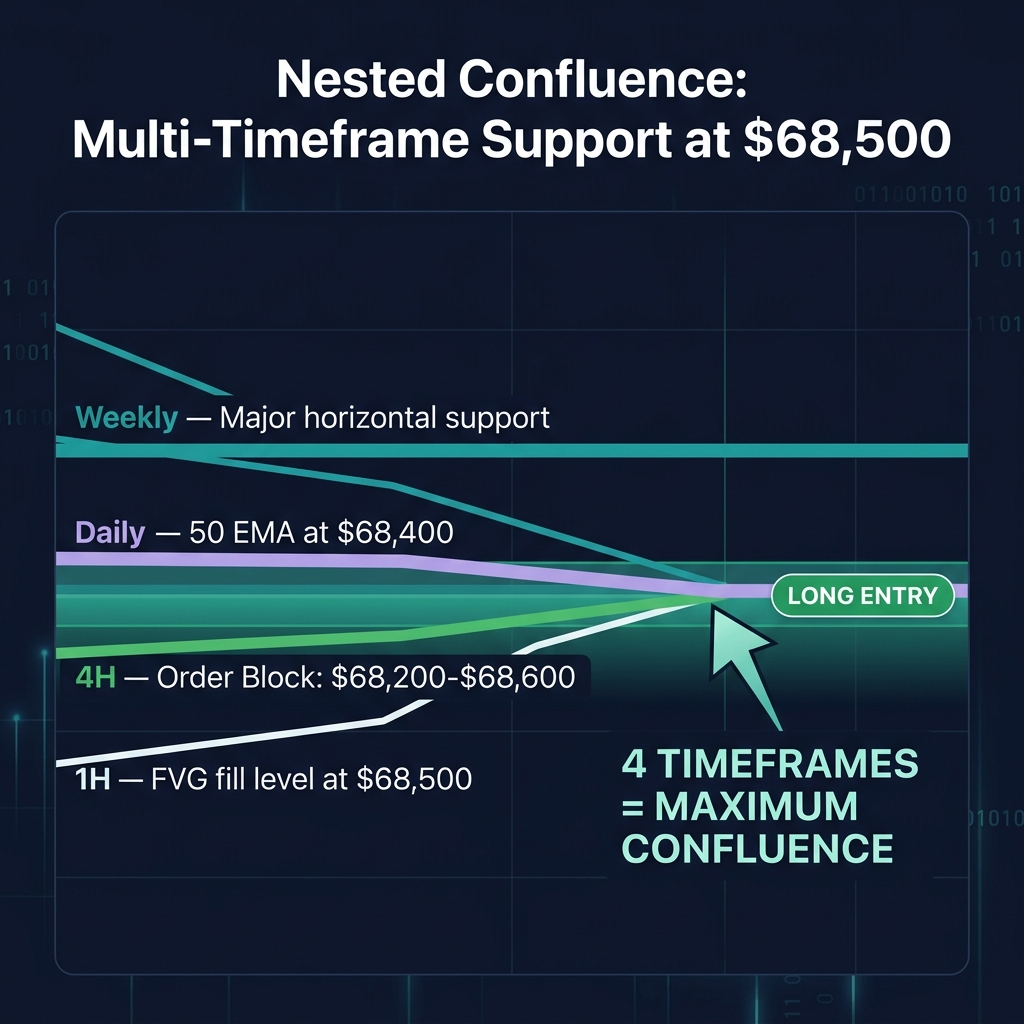
The strongest levels are where multiple timeframe supports/resistances converge:
Example: BTC at $68,500

Weekly:  Major horizontal support from January
Daily:   50 EMA sitting at $68,400
4H:      Order Block zone: $68,200 - $68,600
1H:      FVG fill level at $68,500

→ Four timeframes all show support at the same zone
→ This is an EXTREMELY high-probability long entry
When CoinXSight's ASI Score confirms bullish at this nested confluence zone, the probability increases further.
Practical MTA Workflow
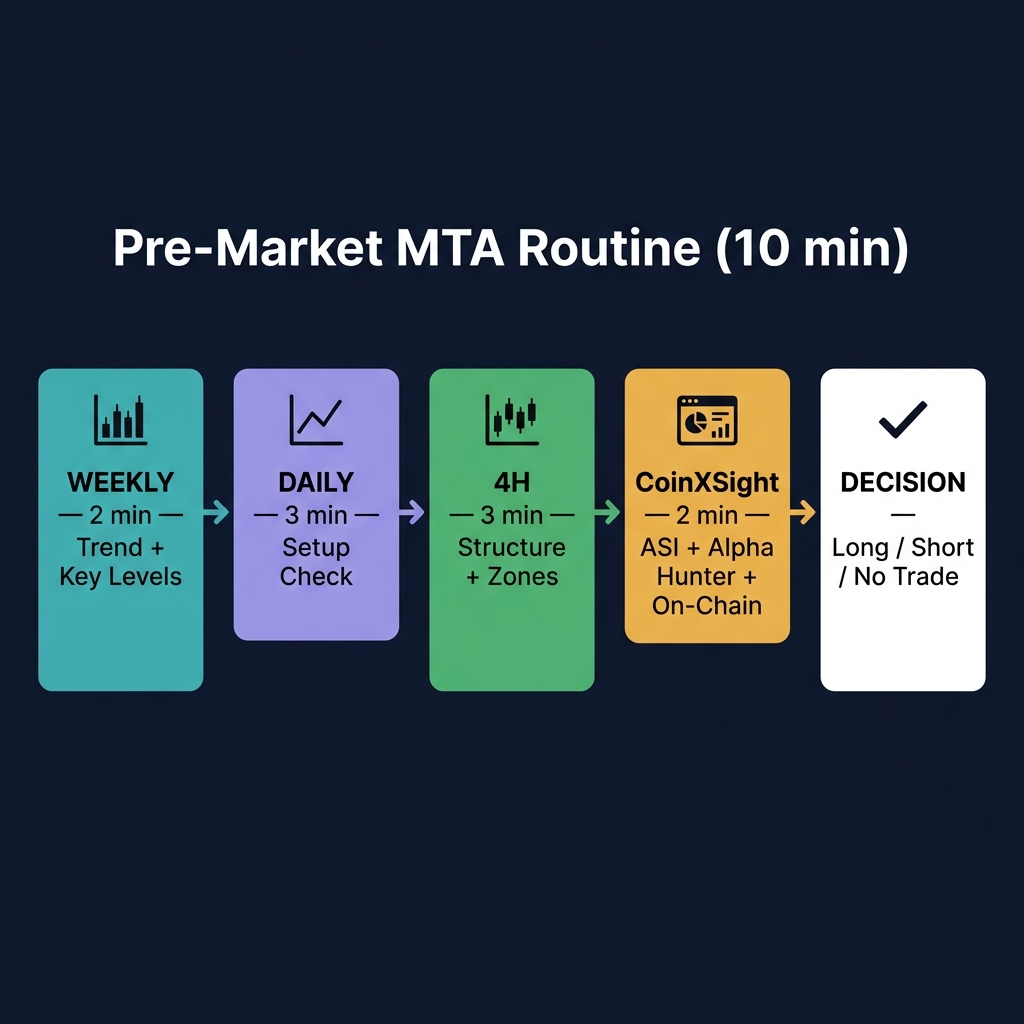
Pre-Market Routine (10-15 minutes)
Daily routine:

1. WEEKLY CHART (2 min)
   - Trend direction: ___
   - Key levels: ___
   - Bias: Bullish / Bearish / Neutral

2. DAILY CHART (3 min)
   - Is price at a key level? Y/N
   - Any setup forming? Y/N
   - Today's bias: ___

3. 4H CHART (3 min)
   - Current structure: HH/HL or LH/LL
   - Nearest OB/FVG zones: ___
   - Active setup? Y/N

4. CHECK COINXSIGHT (2 min)
   - ASI Score trend: Rising / Falling / Flat
   - Alpha Hunter signals: Any HIGH confidence?
   - On-chain anomalies: Any whale activity?

5. DECISION
   - Trade today? Y/N
   - Direction: Long / Short / No trade
   - Watchlist levels: ___
Entry Execution Flow
When TTF setup triggers:

1. Drop to LTF (15M or 5M)
2. Wait for LTF CHoCH in your direction
3. Mark the OB that caused the CHoCH
4. Set limit order at OB zone
5. Stop loss: Beyond the LTF swing point
6. Target: Next TTF-level resistance/support
7. R/R check: Must be ≥ 1:2 minimum
8. Size: Based on HTF alignment (full or half)
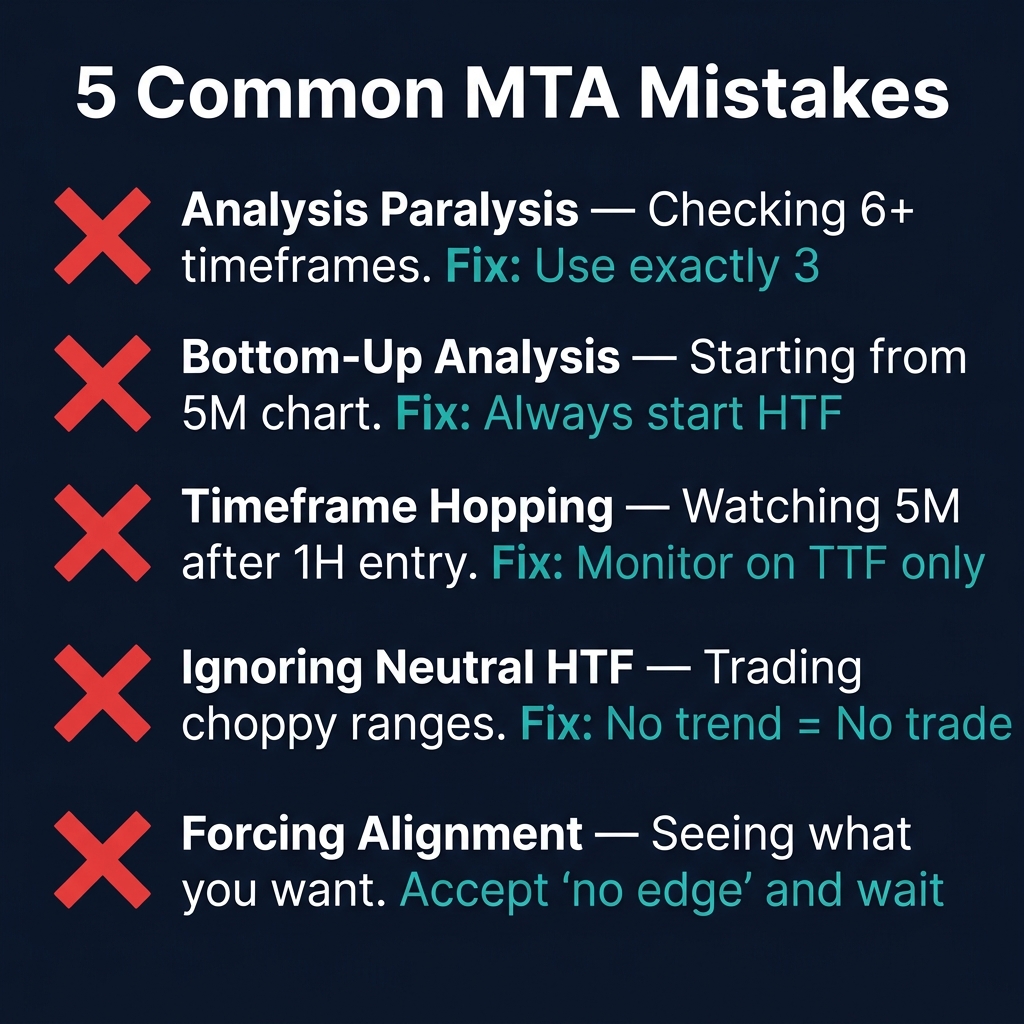
Common MTA Mistakes
1. Analysis Paralysis
Checking 6 timeframes before every trade. Stick to exactly 3. More timeframes = more conflicting information = no trade ever taken.
2. Bottom-Up Analysis
Starting from the 5M chart and working up. This guarantees you'll find compelling setups that are against the trend. Always start from the HTF.
3. Timeframe Hopping After Entry
You entered on the 1H setup. Now you're watching the 5M chart and panicking at every red candle. Rule: After entry, monitor on your TTF only. Check the LTF only if your TTF stop is close to being hit.
4. Ignoring HTF Neutral
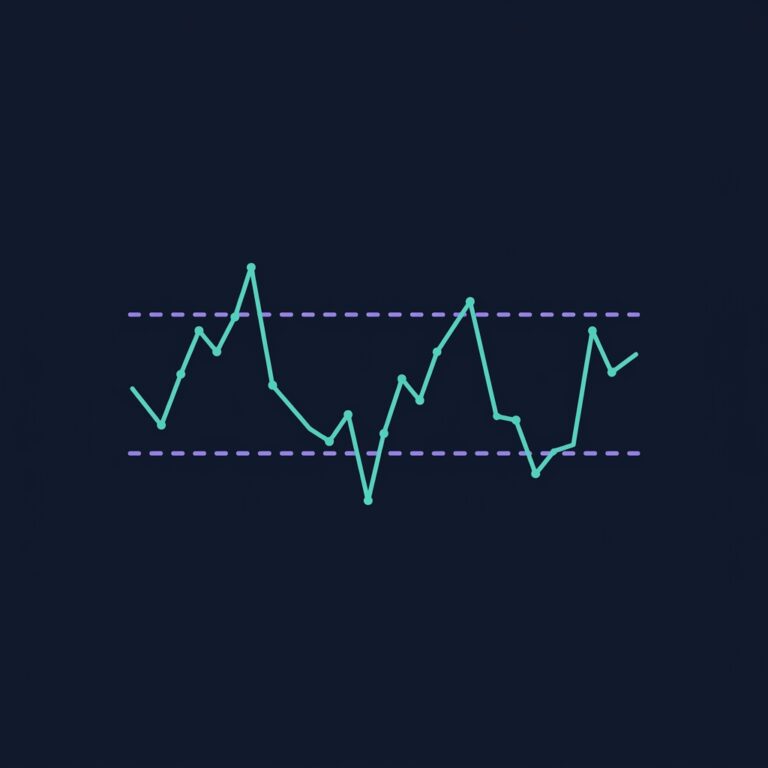
When the HTF is range-bound, the best strategy is NO strategy. Range-bound HTFs create choppy, unreliable signals on lower timeframes. Wait for the HTF to establish a trend, then trade.
5. Forcing Alignment
Sometimes timeframes genuinely conflict. That's the market telling you: no edge exists right now. The ability to sit on your hands when alignment isn't there separates profitable traders from gamblers.
MTA + CoinXSight: Multi-Timeframe Intelligence
Chart Pro Multi-Timeframe View
CoinXSight's Chart Pro allows you to view multiple timeframes simultaneously, with indicators synced across all views. Set up a 3-panel layout (Daily + 4H + 1H) to see alignment at a glance.
Alpha Hunter: Pre-Filtered MTA
The Alpha Hunter module already performs multi-timeframe analysis on 500+ tokens. When Alpha Hunter shows HIGH confidence, it means the HTF trend, TTF setup, and volume/on-chain data all align — saving you hours of manual chart analysis.
ASI Score: Quantitative Alignment
The ASI Score synthesizes data across multiple timeframes and data sources into one number. When ASI aligns with your manual MTA reading, you have both qualitative (chart) and quantitative (data) confirmation.
Multi-timeframe analysis isn't complicated — it's disciplined. The framework is simple: determine direction on the HTF, find setups on the TTF, time entries on the LTF. The hard part isn't understanding it. The hard part is having the patience to wait for all three timeframes to agree before putting money at risk.
Lead Technical Systems Architect·Signals & Metrics Desk
Technical systems developer with a mathematical focus on momentum indicators, volatility metrics (ATR), volume profiles, and multi-timeframe filter models.
QUANTITATIVE SUITE // DEEP ALPHA ENGINEACTIVE
BTC/USDT // LIVE SCANNER
CONFLUENCE 93
LIVE SPOT PRICE$83,908.89STRONG_BUY
TP2
$89,725.68
+6.94%
TP1
$86,233.44
+2.77%
ENTRY
$83,905.28
ZONE
SL
$82,741.19
-1.39%
Auto-detect Order Blocks, Fair Value Gaps and risk-adjusted DCA ladders in < 5s.