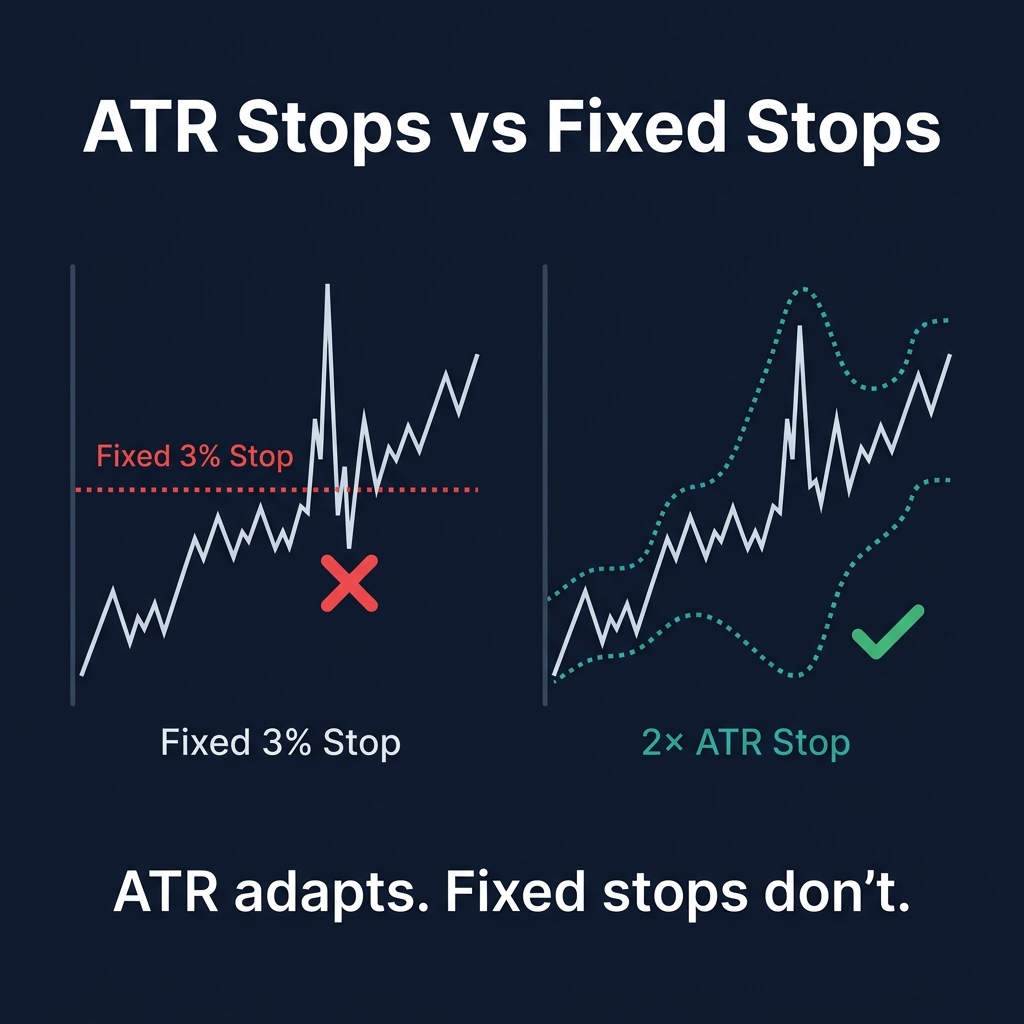
Most traders use fixed percentage stops — "I'll always use a 3% stop loss." The problem: a 3% stop on BTC during a quiet Sunday is very different from a 3% stop during a volatile FOMC day.
On a low-volatility day, 3% might be too wide. On a high-volatility day, 3% might be too tight — you get stopped out by normal price noise.
The solution: ATR — a stop loss that adapts to the market's current volatility. For a complete overview of all crypto indicators and how they complement ATR, see our Cryptocurrency Technical Analysis Indicators guide.
What Is ATR?
ATR (Average True Range) measures the average price movement over a given period. It doesn't tell you direction — it tells you how much the price typically moves.
How ATR Is Calculated
True Range is the MAX of: Current High minus Low, absolute value of High minus Previous Close, or absolute value of Low minus Previous Close. ATR = the simple average of True Range over N periods (typically 14).
Reading ATR Values
ATR Value
Market State
Trading Implication
ATR rising
Volatility expanding
Trends accelerating, widen stops
ATR falling
Volatility contracting
Consolidation, tighten stops
ATR at historical highs
Extreme volatility
Reduce position size
ATR at historical lows
Extreme compression
Breakout imminent
ATR-Based Stop Losses
This is where crypto technical analysis becomes practical — a quality crypto analytics platform will display these signals in real time, helping you act on setups as they form.
The Chandelier Exit
The most popular ATR stop method. It trails from the highest high (for longs) or lowest low (for shorts).
Long stop = Highest High (N periods) minus (Multiplier × ATR). Short stop = Lowest Low (N periods) plus (Multiplier × ATR). Standard: N = 22, Multiplier = 3.
ATR Stop Multipliers
Multiplier
Tightness
Best For
1.0× ATR
Very tight
Scalping
1.5× ATR
Tight
Day trading
2.0× ATR
Standard
Swing trading
3.0× ATR
Wide
Position trading
The golden rule: Your stop should be at least 1.5× ATR from entry. Anything tighter and you're getting stopped out by noise.
Key insight: When volatility doubles, your position size halves automatically. Same dollar risk, but smaller position with wider stop. This is how professionals survive volatile markets.
Volatility Squeeze: The Breakout Predictor
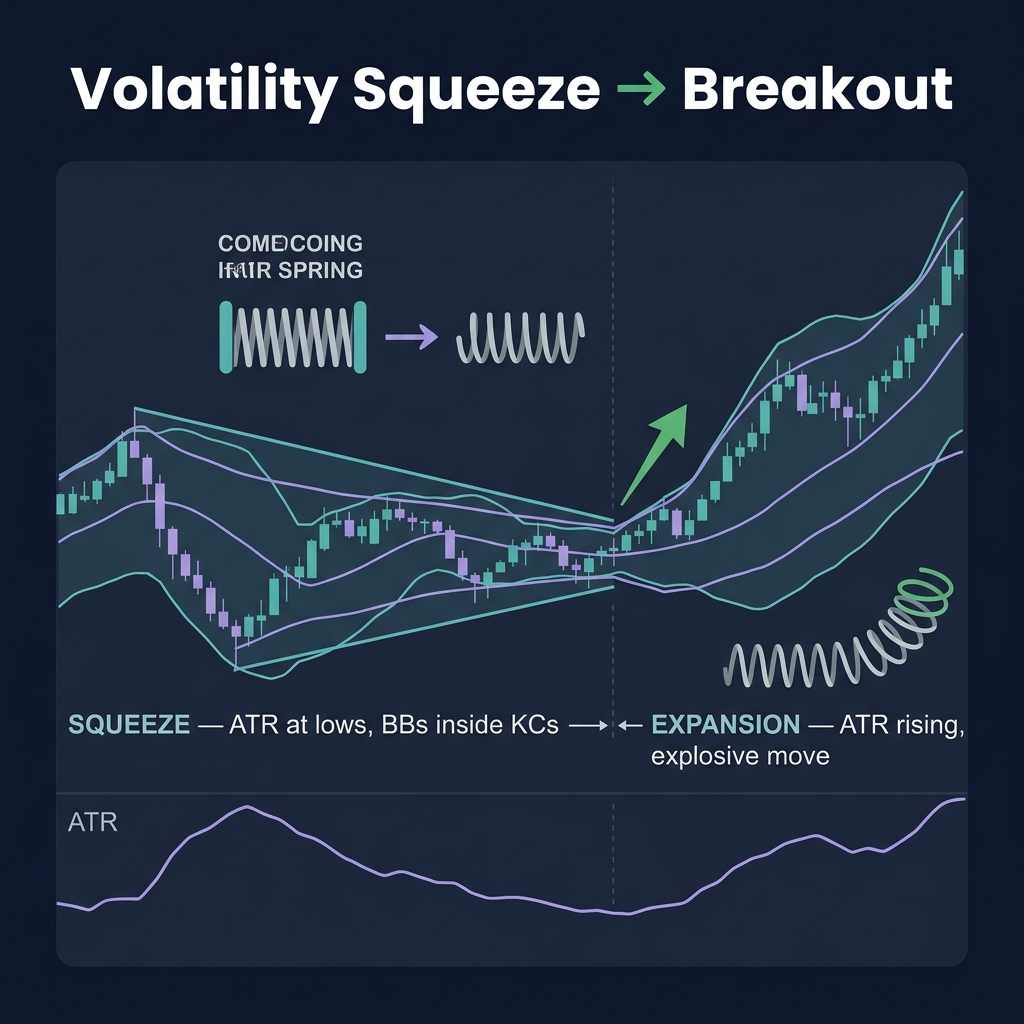
When ATR drops to historically low levels, the market is compressing energy like a spring. This compression ALWAYS resolves with an explosive move.
Identifying a Squeeze
ATR is in the bottom 20% of its 100-period range
Bollinger Bands are inside Keltner Channels
Daily range is less than 50% of the 20-day average
Volume is declining
Any 2 of these 4 = squeeze confirmed. All 4 = major breakout imminent.
Trading the Squeeze
Identify the squeeze — ATR at historical lows
Mark the range — High and low of compression
Wait for expansion — ATR starts rising, price breaks range
Enter on breakout — Long above range, short below
Stop — Opposite side of compression range
Target — Range width × 2-3 (measured move)
Warning: Don't predict direction before breakout. Wait for it.
Keltner Channels
Keltner Channels = EMA ± (ATR × Multiplier). Dynamic bands that adapt to volatility.
Upper = 20 EMA + (2 × ATR). Middle = 20 EMA. Lower = 20 EMA – (2 × ATR).
Price Action
Signal
Above upper channel
Strong uptrend breakout
Between middle and upper
Bullish — pullback to middle
At middle line
Decision point
Between middle and lower
Bearish — rally to middle
Below lower channel
Strong downtrend
Keltner + Bollinger Squeeze
When Bollinger Bands contract INSIDE Keltner Channels = extreme compression. When BBs expand OUTSIDE KCs = squeeze fires. Most reliable breakout signal in TA.
Volatility Regime Detection
Regime
ATR Behavior
Strategy
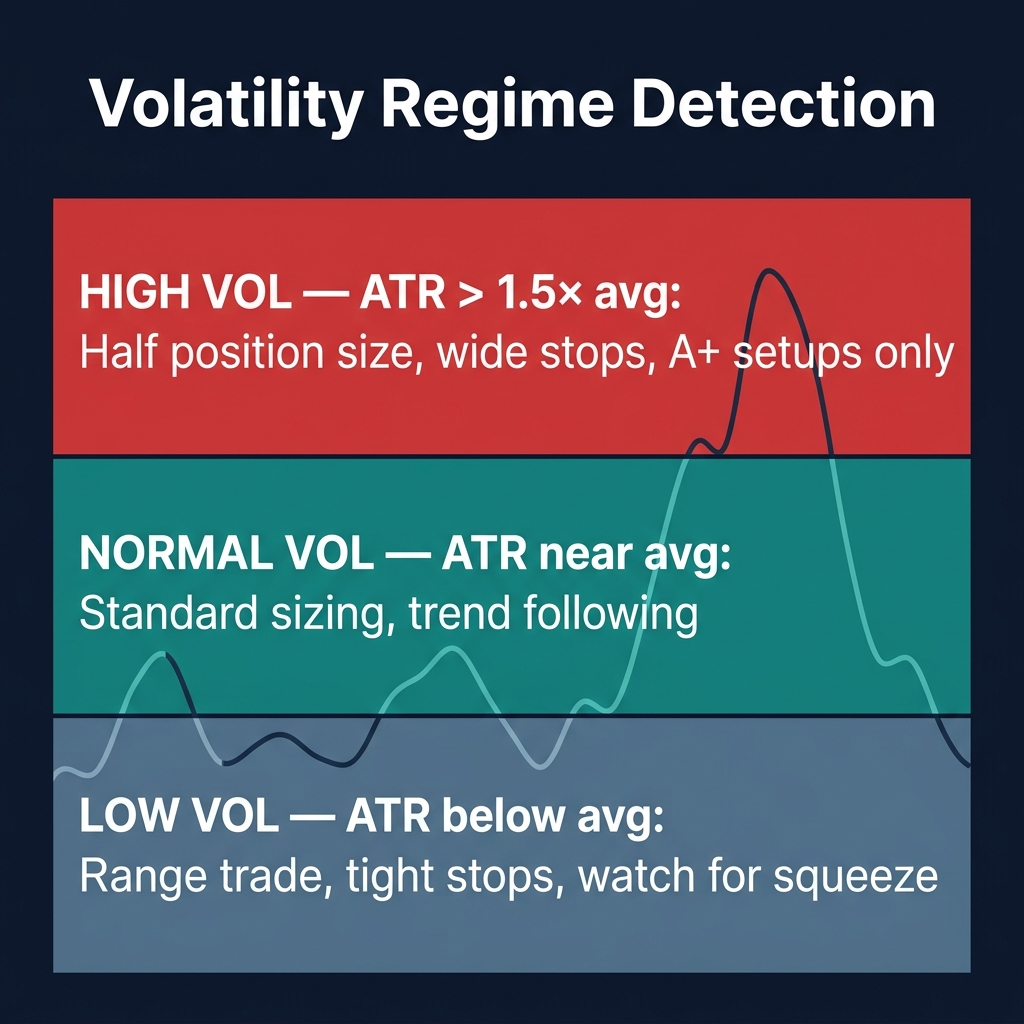
Low vol
ATR below 20-period avg
Range trade, tight stops, small targets
Normal vol
ATR near 20-period avg
Trend follow, standard sizing
High vol
ATR > 1.5× avg
Half size, wide stops, A+ setups only
CoinXSight Integration
Chart Pro ATR Overlay
CoinXSight Chart Pro includes ATR with Chandelier Exit trails. Apply to any timeframe for dynamic stop levels.
Alpha Hunter: Volatility Scoring
Alpha Hunter incorporates ATR-based volatility scoring. Signals during squeezes receive higher confidence because expected moves are larger.
Backtest: ATR Optimization
Use Backtest to compare fixed % stops vs. ATR stops, and optimize ATR multipliers and periods for your strategy.
ATR doesn't predict where price will go. It tells you how much price typically moves — and that transforms your stop placement, position sizing, and regime detection. The best traders don't fight volatility. They measure it and adapt.
Lead Technical Systems Architect·Signals & Metrics Desk
Technical systems developer with a mathematical focus on momentum indicators, volatility metrics (ATR), volume profiles, and multi-timeframe filter models.
QUANTITATIVE SUITE // DEEP ALPHA ENGINEACTIVE
BTC/USDT // LIVE SCANNER
CONFLUENCE 93
LIVE SPOT PRICE$83,908.89STRONG_BUY
TP2
$89,725.68
+6.94%
TP1
$86,233.44
+2.77%
ENTRY
$83,905.28
ZONE
SL
$82,741.19
-1.39%
Auto-detect Order Blocks, Fair Value Gaps and risk-adjusted DCA ladders in < 5s.
Master multi-timeframe analysis for crypto trading. Learn the 3-timeframe rule, top-down analysis flow, timeframe alignment signals, and how to combine…