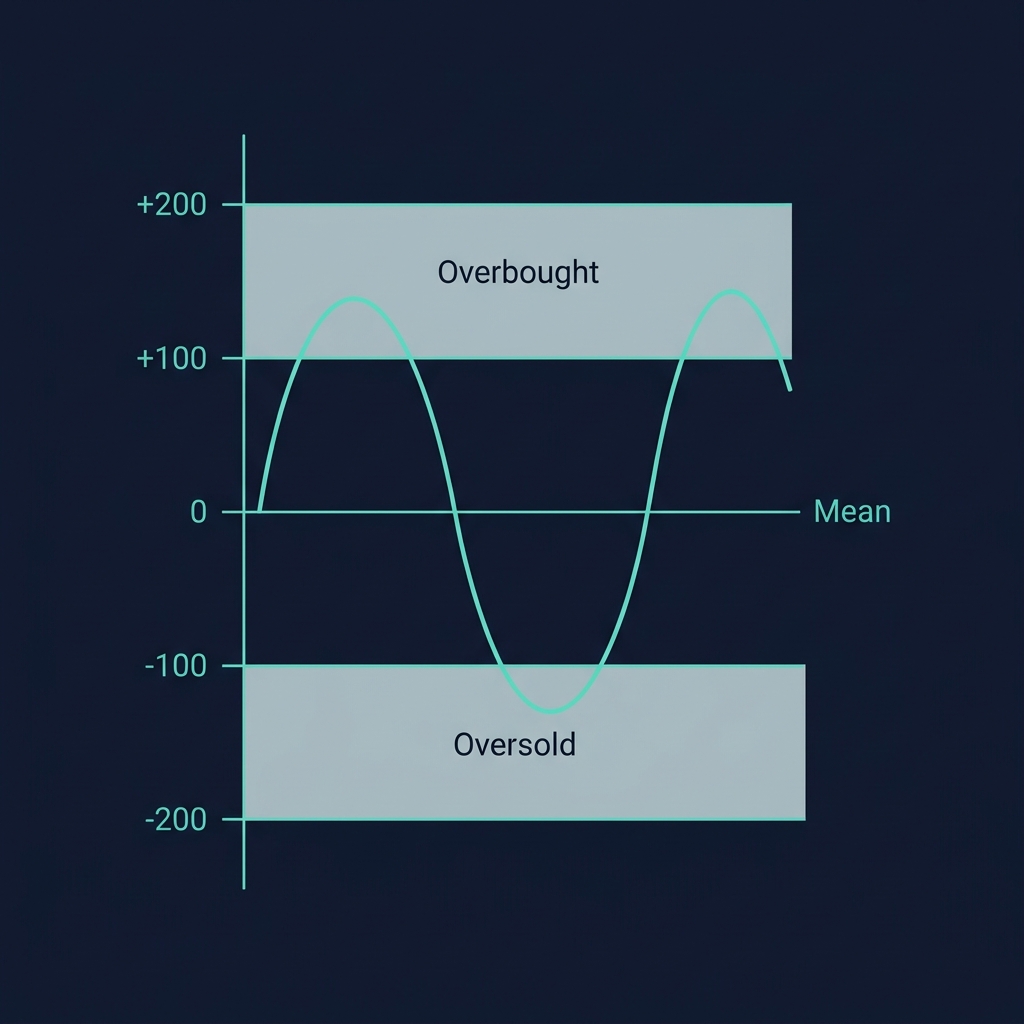
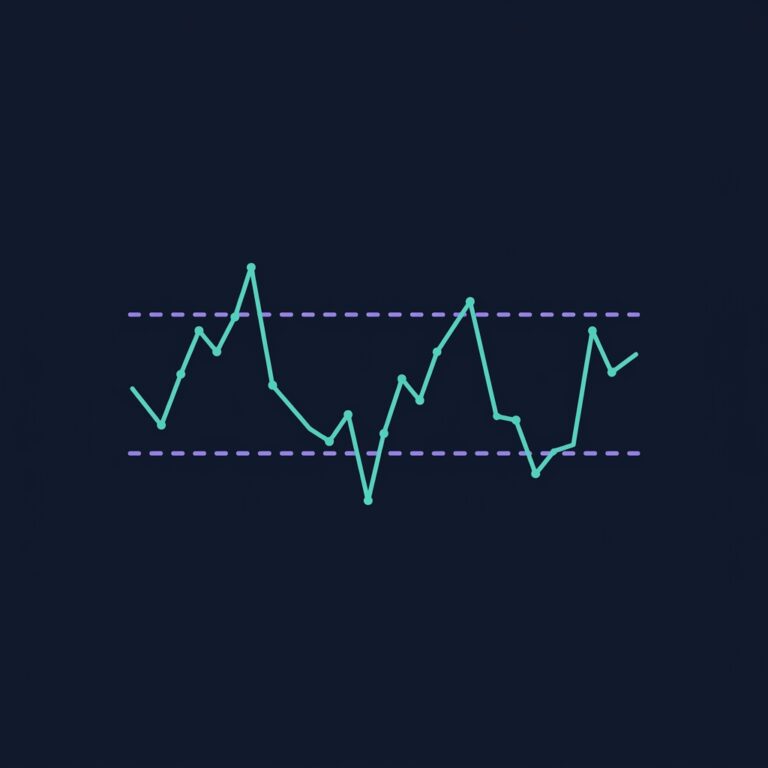
CCI (Commodity Channel Index) measures how far the current price deviates from its statistical average. Unlike RSI which is bounded between 0-100, CCI oscillates without limits — readings of +200, +300, or even -400 are possible during extreme moves. This unbounded nature makes CCI particularly useful for detecting extreme momentum that bounded oscillators miss.
CCI was developed by Donald Lambert in 1980 and published in Commodities magazine. Despite the "commodity" name, CCI works on any market with sufficient liquidity — including crypto. For a complete overview of all crypto indicators and how they work together, see our Cryptocurrency Technical Analysis Indicators guide.
CCI answers the question: "How abnormal is the current price relative to its recent average?"
CCI > +100: Price is abnormally high relative to average — overbought territory
CCI < -100: Price is abnormally low relative to average — oversold territory
CCI near 0: Price is at its statistical average — no extreme
💡 CCI complements Bollinger Bands on CoinXSight — both measure deviation from average, but CCI gives you a single number while Bollinger Bands give you visual channels. Use CCI for precise readings and Bollinger Bands for visual context.
How CCI Is Calculated
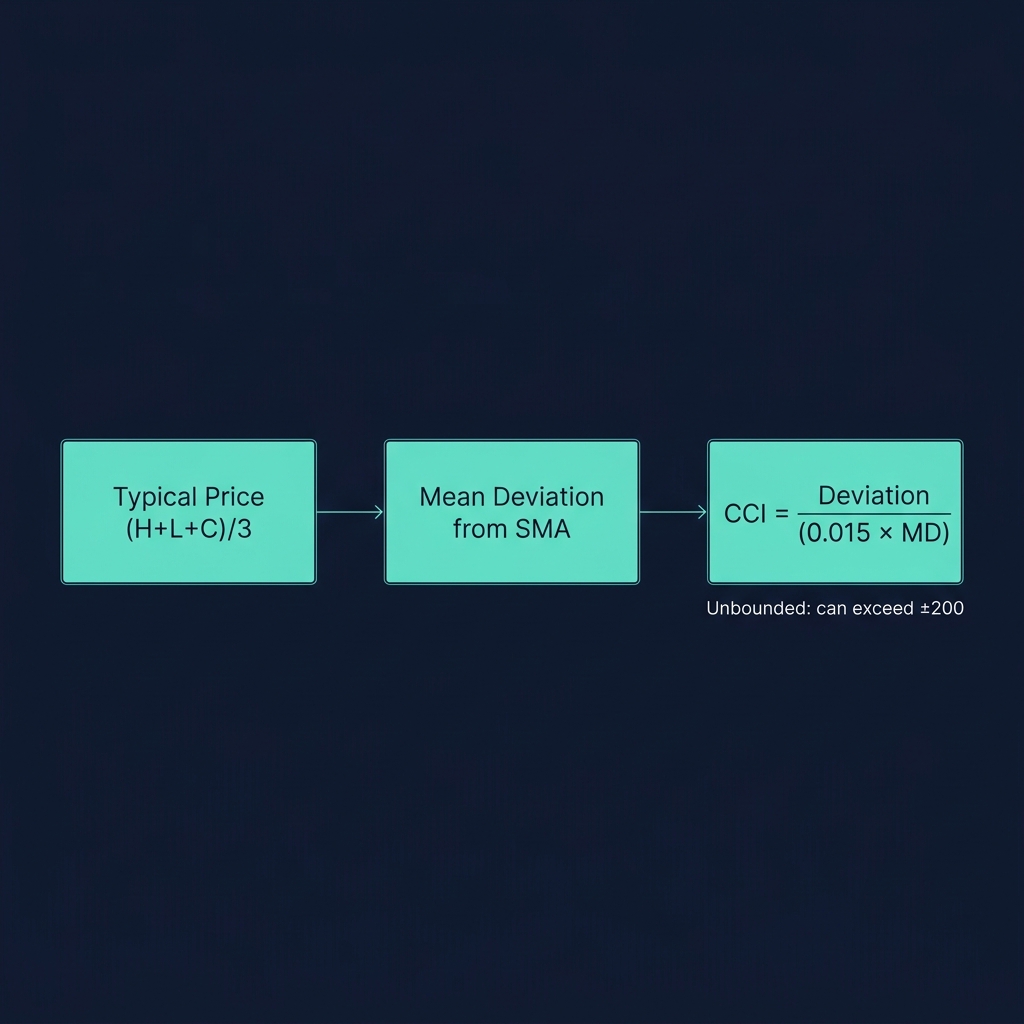
Step 1: Typical Price (TP) = (High + Low + Close) / 3

Step 2: Simple Moving Average of TP over N periods (default N = 20)

Step 3: Mean Deviation = Average of |TP - SMA(TP)| over N periods

Step 4: CCI = (TP - SMA(TP)) / (0.015 × Mean Deviation)
The constant 0.015 was chosen by Lambert to ensure that approximately 70-80% of CCI readings fall between -100 and +100 during normal conditions. Readings outside this range represent statistically unusual price action.
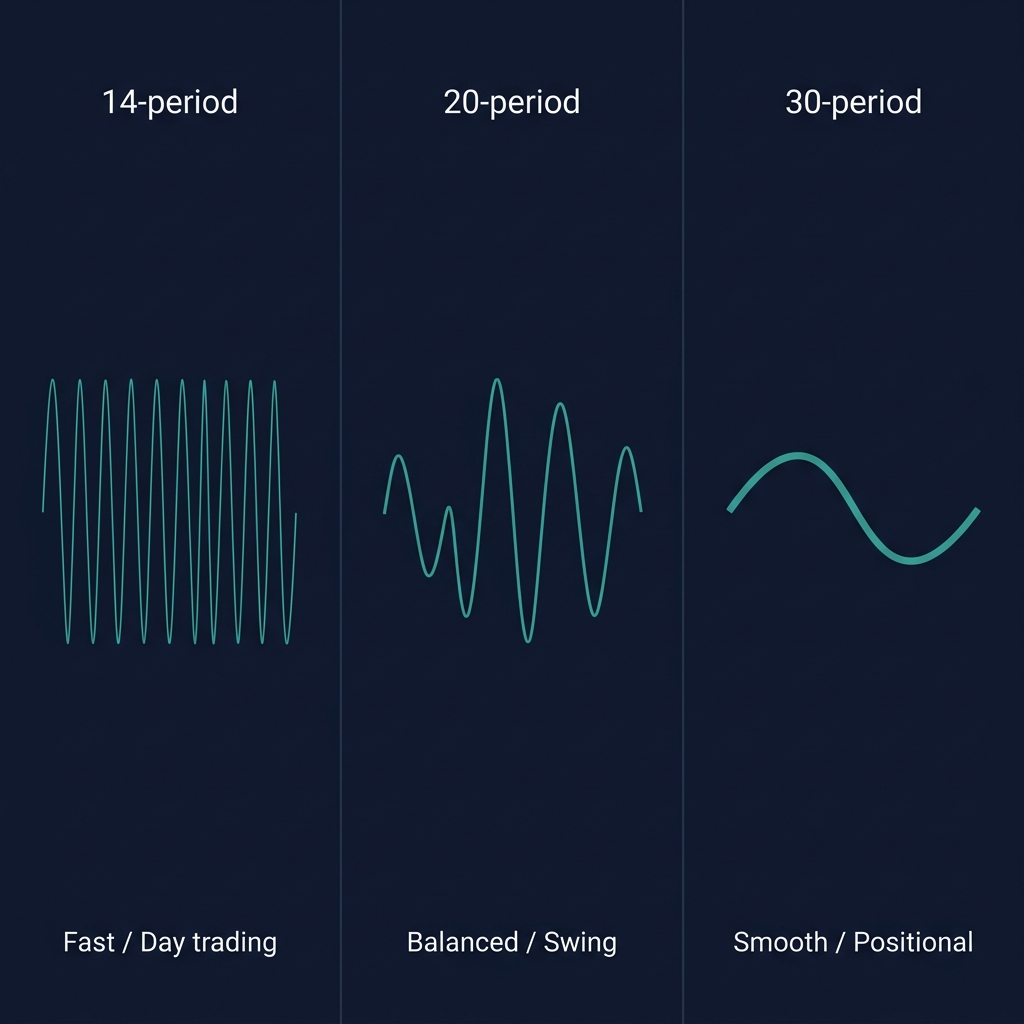
Default period: 20 (vs RSI's 14). CCI uses a longer lookback because it's measuring statistical deviation, not momentum direction.
How to Read CCI — The 4 Key Signals
Modern crypto analytics platforms integrate these signals with additional data layers — combining trading indicators, on-chain metrics, and AI analysis for higher-probability entries.
Signal 1: Extreme Zone Entries
CCI Reading
Market State
Action
> +200
Extremely overbought
High reversal risk — take profits on longs
+100 to +200
Overbought, strong momentum
Trail stops, don't add new longs
0 to +100
Mild bullish
Normal conditions
-100 to 0
Mild bearish
Normal conditions
-100 to -200
Oversold, weak momentum
Watch for bounce signals
< -200
Extremely oversold
High bounce probability — prepare longs
Signal 2: Zero-Line Crossover
When CCI crosses above 0, short-term price is above its average — bullish bias. When it crosses below 0, bearish bias. This is a gentler signal than extreme zone entries, useful for trend confirmation rather than reversal trading.
Signal 3: CCI Divergence
Like all oscillators, CCI divergence is powerful:
Bearish divergence: Price makes higher high, CCI makes lower high → momentum fading
Bullish divergence: Price makes lower low, CCI makes higher low → selling exhausting
CCI divergence is particularly effective because CCI's unbounded nature makes divergence patterns more pronounced than with bounded indicators like RSI.
Signal 4: CCI Trend Strength
In a strong uptrend, CCI stays above 0 and makes periodic dips that don't breach -100. When CCI consistently drops below -100 during pullbacks, the trend is weakening — the "normal" pullback depth is increasing.
3 Real Trading Scenarios with CCI
Scenario 1: BTC CCI Extreme Overbought — February 22, 2026
Setup on CoinXSight Chart Pro:
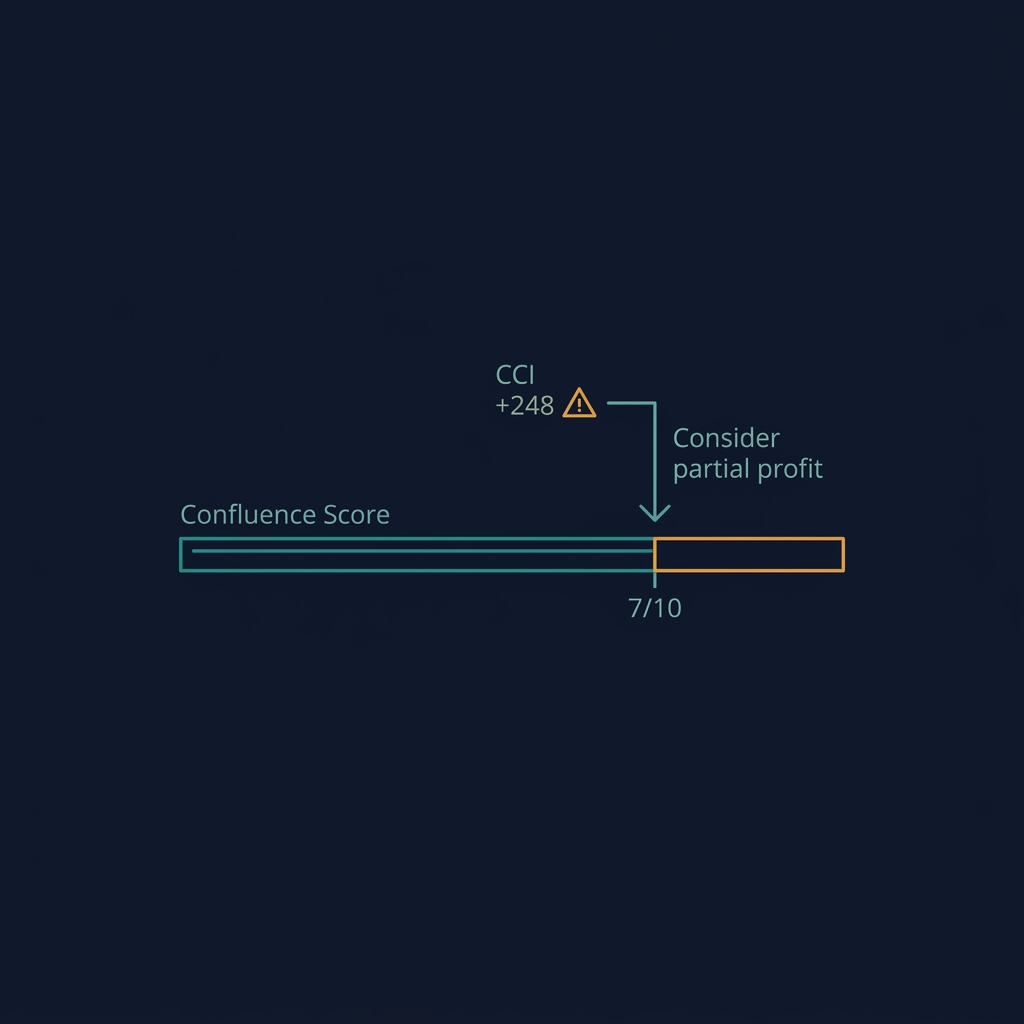
BTC/USDT reached $106,000 on February 22, 2026. CCI (20) hit +248 — well into extreme territory. RSI was at 74 (overbought but not extreme by RSI standards). MFI was 82. The Confluence Score was dropping from 8/10 to 6/10 as momentum indicators peaked.
Action: Took 50% profit on the long position. Moved stop to breakeven on the remainder.
Result: BTC consolidated between $103,000-$108,500 for 2 weeks before the March correction. The CCI extreme reading (+248) correctly identified that price was "stretched" too far from its mean — a mean reversion pullback was likely.
Scenario 2: ETH CCI Oversold Bounce — April 3, 2026
Setup:
ETH dropped to $2,280. CCI hit -215 — deeply oversold. This was the most extreme CCI reading for ETH in 3 months. Bollinger Bands confirmed: price was below the lower band. Confluence Score: 7/10 at the support level.
Action: Long entry at $2,290 with stop at $2,230 (below the support zone).
Result: ETH bounced +11.4% to $2,550 over 2 weeks. CCI below -200 with Bollinger Band penetration is a high-probability bounce setup.
Scenario 3: SOL CCI Divergence — May 2026
SOL/USDT 4H chart:
Price: New high at $188 on May 3 (prev high: $185 on April 28)
CCI: +142 at the new high vs +198 at the previous high — bearish divergence
RSI: 67 (no extreme reading — CCI caught the divergence first)
Confluence Score: 5/10 — declining
Action: Closed remaining long position at $186. Set alert for CCI crossing below 0.
Result: SOL dropped to $172 within 5 days. CCI divergence preceded the reversal by 2 days before RSI confirmed.
Lesson: CCI's unbounded nature makes its divergence signals more visible than RSI divergence. A drop from +198 to +142 is more obvious than RSI moving from 72 to 67.
CCI Settings by Trading Style
Style
Period
Extreme Zones
Timeframe
Swing trading
20 (default)
±100
4H-1D
Day trading
14
±100
1H-4H
Scalping
9
±150 (wider to avoid noise)
15m-1H
Positional
30
±100
1D-1W
⚠️ Limitation: CCI's unbounded nature means extreme readings can become MORE extreme. CCI at +200 doesn't guarantee a reversal — in parabolic crypto rallies, CCI can reach +400 or higher before price actually reverses. Always combine with support/resistance levels and volume confirmation. Never short solely because CCI is "too high."
CCI in the CoinXSight Confluence System
CCI isn't directly in the Confluence Score formula, but it supplements the Momentum Layer as a deviation check:
CCI > +200 while Confluence ≥ 7/10: The trend is strong but stretched. Consider partial profits.
CCI < -200 while Confluence ≤ 3/10: Maximum pessimism. Watch for reversal signals.
CCI divergence: Use as an early warning that the Momentum Layer score may be about to drop.
Add CCI on Chart Pro alongside the automated Confluence Score for a more complete picture of momentum extremes.
Monitor for extreme readings: CCI > +200 (overbought) or < -200 (oversold)
Check for CCI divergence when price makes new highs/lows
Cross-reference with the Confluence Score on Deep Alpha
Use CCI extremes for profit-taking, CCI divergences for reversal warnings
Whether you want to buy Bitcoin, buy Ethereum, or trade altcoins, this indicator helps you time entries on any crypto exchange with data-driven confidence.
FAQ
What is the difference between CCI and RSI?
RSI is bounded (0-100) and measures momentum speed. CCI is unbounded and measures price deviation from statistical average. CCI better detects extreme moves, while RSI better identifies standard overbought/oversold levels.
What CCI reading is overbought in crypto?
CCI above +100 is standard overbought. Above +200 is extreme overbought — a strong mean reversion signal. However, in parabolic trends, CCI can exceed +300 before reversing.
Can CCI predict crypto crashes?
CCI can't predict crashes, but extreme CCI readings (+300 or higher) combined with bearish divergence provide early warning. These conditions preceded the March 2026 BTC correction by 3-5 days.
How does CCI compare to Bollinger Bands?
Both measure deviation from average. CCI gives a single number for precise thresholds. Bollinger Bands give visual channels on the price chart. Use CCI for alerts and Bollinger Bands for chart context — both available on CoinXSight Chart Pro.
Which crypto analytics platform offers the best cci indicator tools?
CoinXSight provides cci indicator analysis alongside 12+ other trading indicators, all integrated into an AI-powered Confluence Scoring system. It's a comprehensive crypto analytics platform that combines technical analysis with on-chain data and Smart Money Concepts for higher-probability trade setups.
JV
Julian Vance
TA // SYSTEMS
Lead Technical Systems Architect·Signals & Metrics Desk
Technical systems developer with a mathematical focus on momentum indicators, volatility metrics (ATR), volume profiles, and multi-timeframe filter models.
QUANTITATIVE SUITE // DEEP ALPHA ENGINEACTIVE
BTC/USDT // LIVE SCANNER
CONFLUENCE 93
LIVE SPOT PRICE$83,908.89STRONG_BUY
TP2
$89,725.68
+6.94%
TP1
$86,233.44
+2.77%
ENTRY
$83,905.28
ZONE
SL
$82,741.19
-1.39%
Auto-detect Order Blocks, Fair Value Gaps and risk-adjusted DCA ladders in < 5s.
Master Stochastic RSI for crypto trading. Learn StochRSI formula, overbought/oversold zones, crossover signals, and how CoinXSight uses it in Confluence…
Master every cryptocurrency technical analysis indicator with this complete guide. Covers 27 indicators across trend, momentum, volume, volatility, and crypto-native…