Wyckoff Method for Crypto: Reading Institutional Accumulation and Distribution
Master the Wyckoff Method to identify when institutions are accumulating or distributing crypto. Learn the 4 phases, key schematics, volume analysis, and how to combine Wyckoff with on-chain data for high-probability entries.
JV
Julian VanceLead Technical Systems Architect·May 22, 2026 · 16 min read · Updated Oct 6
Richard Wyckoff developed his method in the 1930s. It was designed to read one thing: what institutions are doing before the rest of the market catches on.
In 2026, nothing has changed. Bitcoin and altcoin markets are dominated by whales, market makers, and institutional desks. They accumulate positions quietly over weeks, then let retail chase the breakout. They distribute into strength while retail buys the "dip."
The Wyckoff Method gives you a framework to read this behavior in real-time — using price action and volume alone. When combined with on-chain data (which Wyckoff didn't have), it becomes devastatingly effective. For a complete overview of all crypto indicators and how they work together, see our Cryptocurrency Technical Analysis Indicators guide.
The 3 Wyckoff Laws
Everything in Wyckoff analysis flows from three fundamental laws:
Law 1: Supply and Demand
Price moves because supply and demand are imbalanced. When demand exceeds supply, price rises. When supply exceeds demand, price falls. When they're balanced, price consolidates.
This sounds obvious, but the key insight is: volume reveals which side is dominant. High volume on up moves = demand. High volume on down moves = supply. Low volume on down moves during consolidation = supply is being absorbed (bullish).
Law 2: Cause and Effect
Every significant price move (the "effect") requires a period of preparation (the "cause"). The longer the accumulation/distribution phase, the larger the subsequent trend.
Practical rule: If BTC consolidates for 3 weeks in a tight range, expect a move roughly proportional to that time. If it consolidates for 3 months, expect a much larger trend.
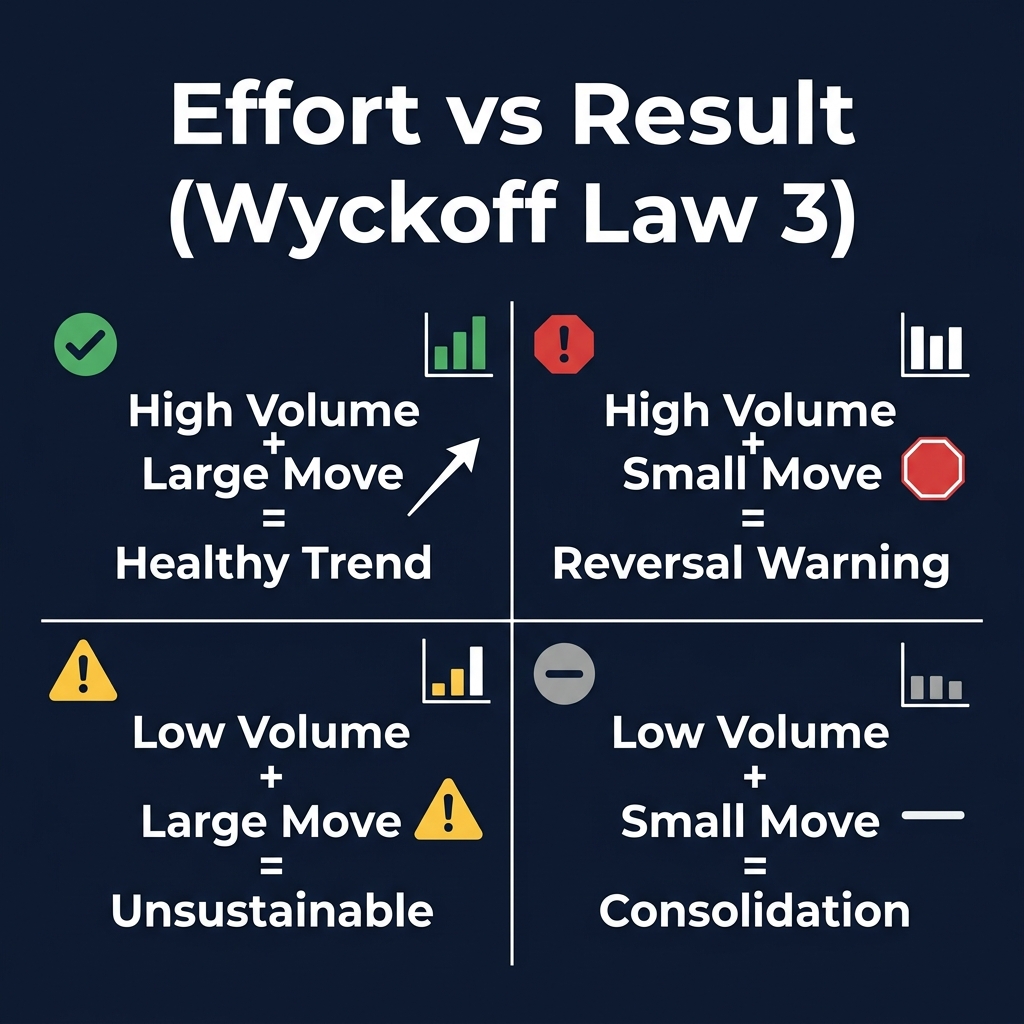
Law 3: Effort vs. Result
Volume is the "effort." Price movement is the "result." They should be in harmony:
Effort (Volume)
Result (Price)
Interpretation
High volume
Large price move
Healthy trend — supply/demand aligned
High volume
Small price move
Reversal warning — opposition is strong
Low volume
Large price move
Unsustainable — likely to reverse
Low volume
Small price move
Consolidation — waiting for catalyst
This is the most powerful Wyckoff concept. When you see high volume but no price progress, smart money is either accumulating (absorbing selling) or distributing (absorbing buying).
The 4 Market Phases
This is where crypto technical analysis becomes practical — a quality crypto analytics platform will display these signals in real time, helping you act on setups as they form.
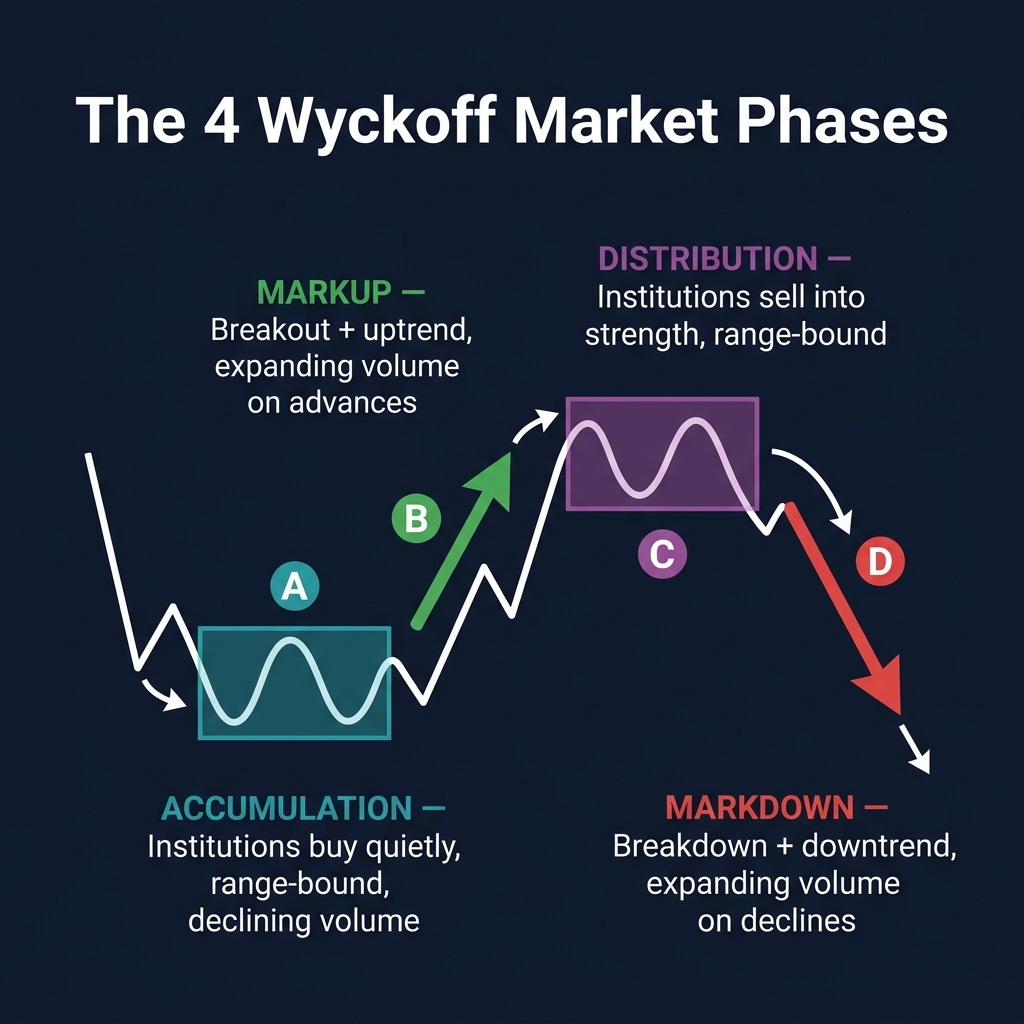
Wyckoff identified four phases that repeat in every market, every asset, every timeframe:
Phase A: Accumulation
Institutions quietly buy while price moves sideways or drifts down. Retail traders are bored or scared. Volume spikes on down moves are absorbed — the price doesn't make new lows despite heavy selling.
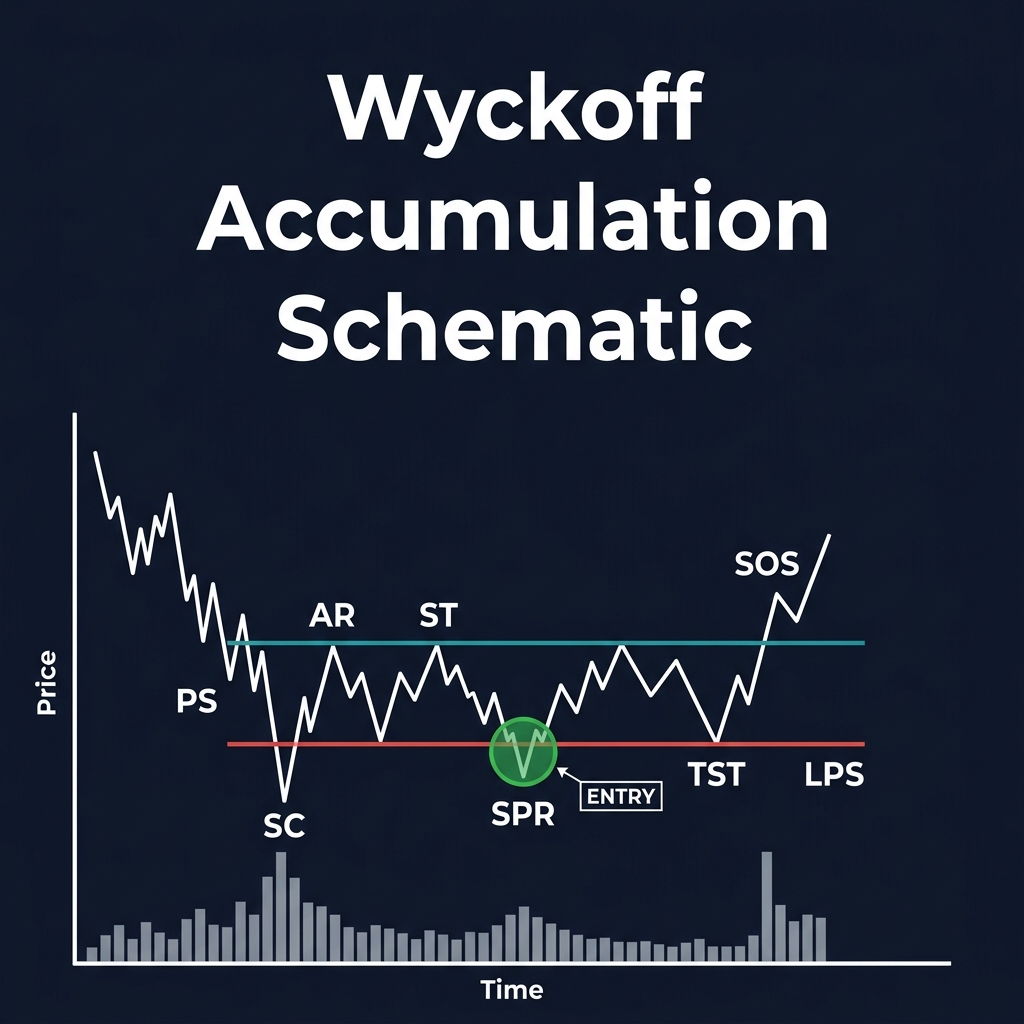
Key events in accumulation:
Event
Abbreviation
What Happens
Volume
Preliminary Support
PS
First buying appears after a downtrend
High
Selling Climax
SC
Panic selling, price spikes down sharply
Very high
Automatic Rally
AR
Sharp bounce from SC — relief rally
High
Secondary Test
ST
Price retests SC area on lower volume
Low
Spring
SPR
False breakdown below SC — shakeout
Medium
Test of Spring
TST
Price retests spring on very low volume
Very low
Sign of Strength
SOS
First breakout above resistance
High
Last Point of Support
LPS
Pullback to resistance-turned-support
Low
The Spring is the golden entry. It's a deliberate push below support designed to trigger stop-losses and scare retail traders into selling. Institutions buy this liquidity. When price recovers above support on the same or next candle, the spring is confirmed.
Phase B: Markup
After accumulation is complete, price breaks out and trends upward. Volume expands on up moves and contracts on pullbacks. This is where most retail traders finally enter — late, but there's still profit if you caught the accumulation phase.
Characteristics:
Higher highs and higher lows
Volume expands on advances
Pullbacks are shallow (25-38% Fibonacci retracements)
Moving averages fan out bullishly
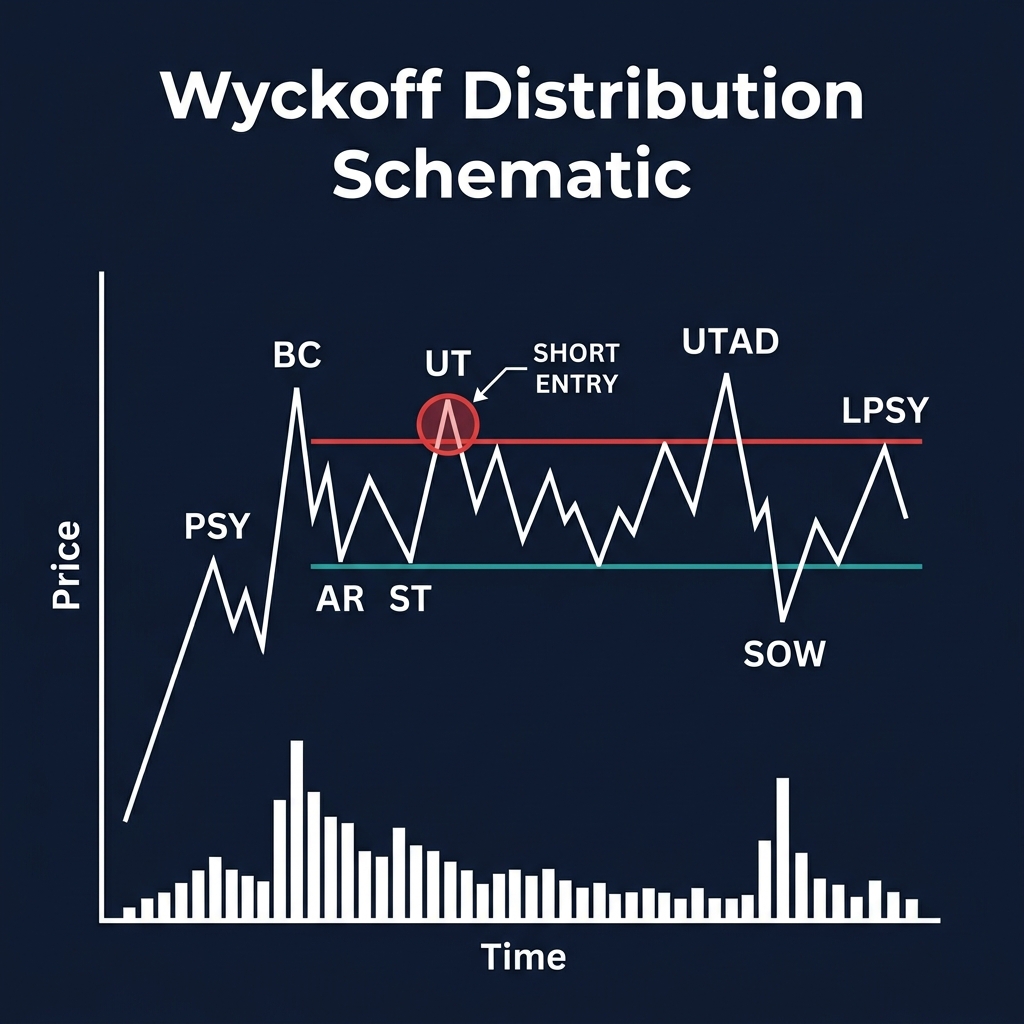
Phase C: Distribution
Mirrors accumulation but in reverse. Institutions sell into strength while retail traders buy, thinking the uptrend will continue.
Key events in distribution:
Event
Abbreviation
What Happens
Volume
Preliminary Supply
PSY
First selling appears at top
High
Buying Climax
BC
Euphoric buying, price spikes up
Very high
Automatic Reaction
AR
Sharp drop from BC
High
Secondary Test
ST
Price retests BC area on lower volume
Low
Upthrust
UT
False breakout above BC — bull trap
Medium-high
Upthrust After Distribution
UTAD
Stronger false breakout
High
Sign of Weakness
SOW
First breakdown below support
High
Last Point of Supply
LPSY
Rally fails to reach previous highs
Low
The Upthrust is the golden short entry. It's the opposite of the Spring — a deliberate push above resistance to trigger short stop-losses and lure breakout buyers. When price reverses below resistance, distribution is confirmed.
Phase D: Markdown
After distribution is complete, price breaks down and trends downward. Volume expands on down moves. Retail traders are trapped holding from the distribution zone — creating selling pressure as they exit at a loss.
Wyckoff in Crypto: What's Different
Crypto markets amplify Wyckoff patterns because:
24/7 markets — No overnight gaps, so accumulation/distribution ranges are cleaner
Transparent order books — You can see large bids/asks directly
On-chain data — Wyckoff's missing piece. Now you can literally watch whale wallets accumulate
Higher volatility — Springs and upthrusts are more dramatic, making them easier to identify
Funding rates — Perpetual futures add a new data layer showing crowd positioning
On-Chain + Wyckoff = Edge Multiplier
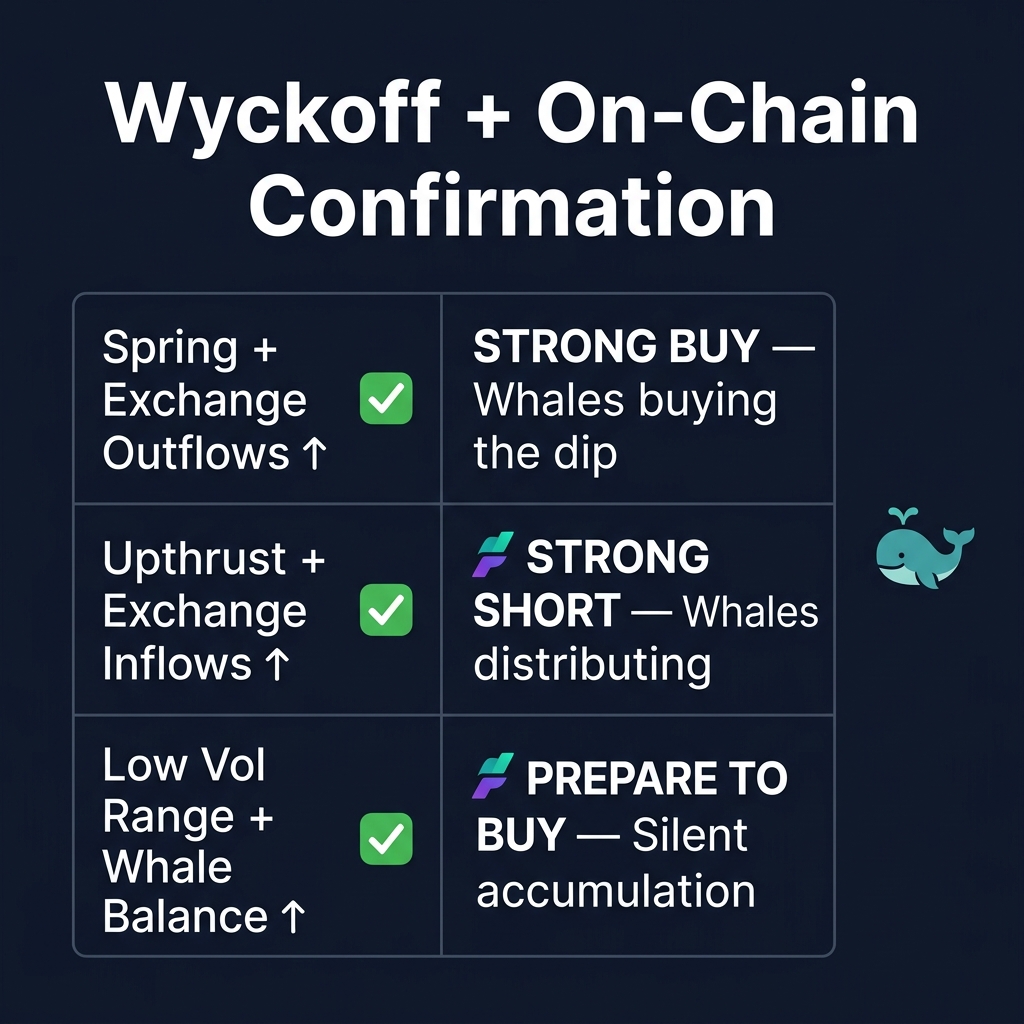
Wyckoff tells you the WHAT (accumulation is happening). On-chain tells you the WHO (which wallets are accumulating).
Wyckoff Signal
On-Chain Confirmation
Combined Interpretation
Spring (false breakdown)
Exchange outflows spike
✅ Whales buying the dip — STRONG BUY
Spring (false breakdown)
Exchange inflows spike
❌ More selling incoming — WAIT
Upthrust (false breakout)
Exchange inflows spike
✅ Whales distributing — STRONG SHORT
Upthrust (false breakout)
Exchange outflows continue
❌ Accumulation still happening — WAIT
Low volume consolidation
Whale wallet balances increasing
✅ Silent accumulation — PREPARE TO BUY
Low volume consolidation
No change in whale wallets
⚠️ Genuine indecision — NO TRADE
CoinXSight's Alpha Hunter automatically detects unusual exchange flows and whale transactions. Cross-referencing Alpha Hunter alerts with your Wyckoff chart analysis creates a powerful confluence system.
How to Trade Wyckoff: Step-by-Step
Step 1: Identify the Range
Look for a period where price moves sideways with clear support and resistance. The range should have at least 3-4 tests of support and resistance.
Checklist:
[ ] Clear horizontal support level (tested 2+ times)
[ ] Range duration: minimum 2 weeks for 4H charts, 2 months for daily charts
[ ] Volume declining overall during the range (= selling pressure exhausting)
Step 2: Classify as Accumulation or Distribution
Clue
Accumulation
Distribution
Preceding trend
Downtrend into range
Uptrend into range
Volume on tests of support
Decreasing (supply drying up)
Increasing (selling pressure)
Volume on tests of resistance
Increasing (demand building)
Decreasing (buying drying up)
Range drift
Slight upward drift
Slight downward drift
News sentiment
Negative/neutral (retail scared)
Positive/euphoric (retail buying)
Step 3: Wait for the Spring or Upthrust
This is the patience test. You MUST wait for the false breakout.
Spring criteria (accumulation):
Price breaks below support
Volume is NOT extremely high (if volume is massive, it might be genuine selling)
Price recovers above support within 1-3 candles
Subsequent test of spring area shows VERY low volume
Upthrust criteria (distribution):
Price breaks above resistance
Volume may be high initially but fails to sustain
Price falls back below resistance within 1-3 candles
Subsequent rally fails to reach upthrust high
Step 4: Enter on Confirmation
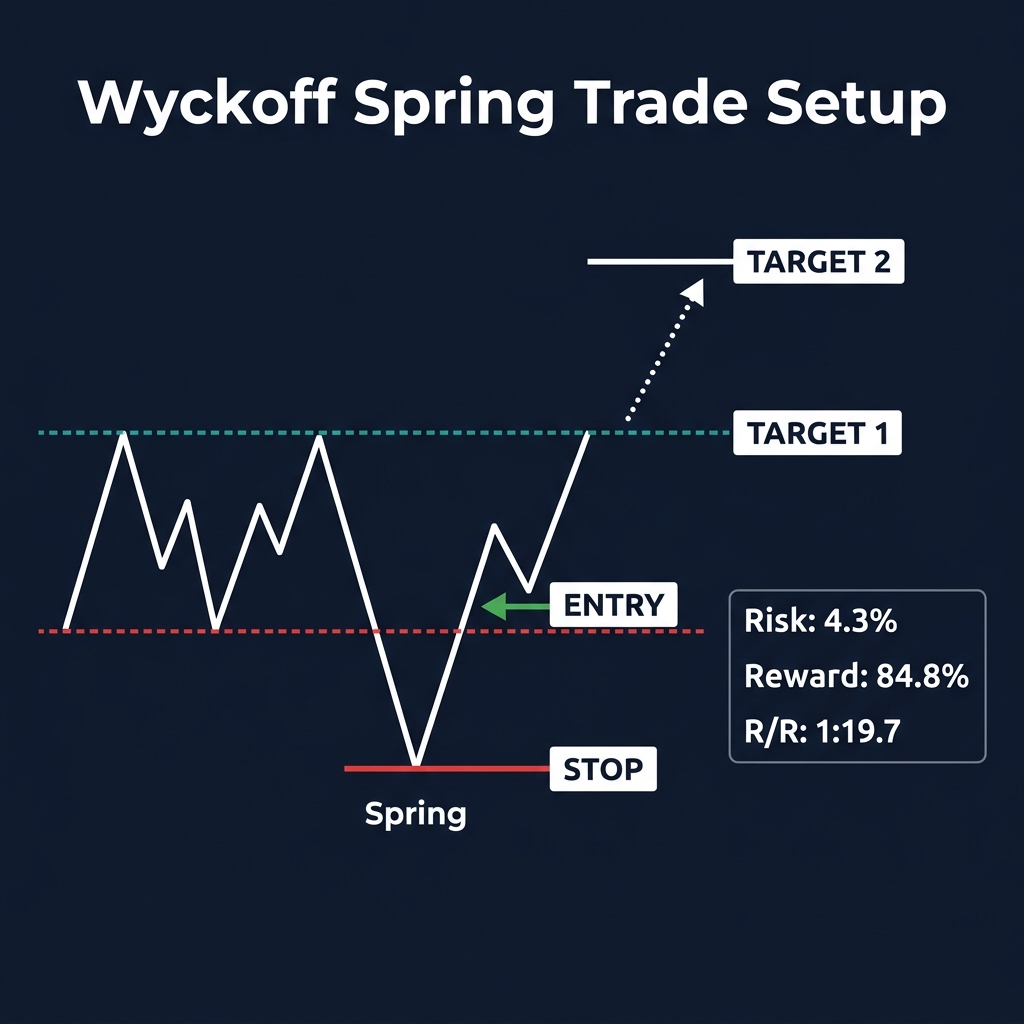
For accumulation (long entry):
Entry: After Spring test confirms (low volume retest of spring area)
Stop: Below the spring low (the absolute low of the false breakdown)
Target 1: Top of the accumulation range (resistance)
Target 2: Measured move = range height projected above resistance
For distribution (short entry):
Entry: After Upthrust confirms (failed rally back to resistance)
Stop: Above the upthrust high
Target 1: Bottom of the distribution range (support)
Target 2: Measured move = range height projected below support
Step 5: Manage the Trend
Once the trend begins (markup or markdown), use trailing stops:
Trailing stop strategy:
- Initial stop: Below spring/above upthrust
- After SOS/SOW: Move stop to LPS/LPSY level
- During trend: Trail using 20 EMA on the trading timeframe
- At target: Take 50% profit, let rest run with wider trail
Real Crypto Wyckoff Examples
BTC 2024 Accumulation ($38K-$48K Range)
Bitcoin's accumulation between November 2023 and January 2024 was textbook Wyckoff:
Selling Climax: Drop to ~$38,500 on high volume (late November)
Automatic Rally: Bounce to ~$44,700 (December)
Secondary Test: Retest of $40,500 area on lower volume
Spring: Brief dip to $38,800 on January 3rd — recovered within hours
Sign of Strength: Break above $48,000 on massive volume
Markup: Rally from $48K to $73K over the next 2 months
Traders who identified the spring at $38,800 and entered with a stop below $38,000 had:
Entry: ~$39,500
Stop: $37,800 (risk: 4.3%)
Target: $73,000 (reward: 84.8%)
Risk/reward: 1:19.7
SOL Distribution Example ($190-$210 Range)
Solana's distribution in early 2025 showed classic Wyckoff distribution:
Buying Climax: Spike to $210 on euphoric volume
Automatic Reaction: Drop to $185
Secondary Test: Rally back to $207 on lower volume (failed to make new high)
Upthrust: Brief spike to $215 on January 19th — reversed same day
Sign of Weakness: Break below $185 on heavy volume
Markdown: Decline from $185 to $120 over next 6 weeks
Combining Wyckoff with CoinXSight Tools
Volume Profile + Wyckoff
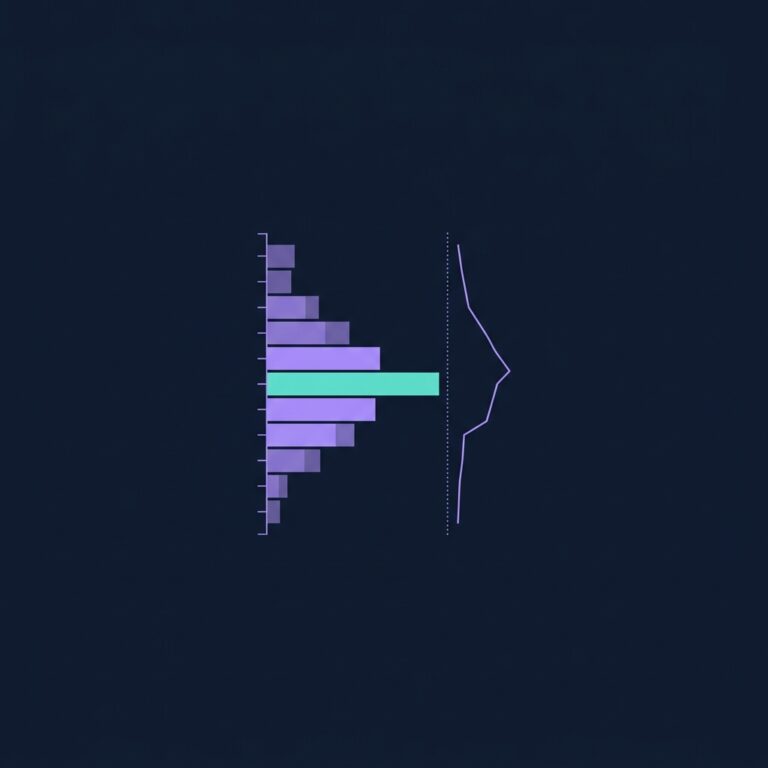
Use Volume Profile to identify the Point of Control (POC) within accumulation/distribution ranges. If the POC is near the bottom of the range, institutions were buying heavily at lower prices (bullish). If near the top, they were selling (bearish).
RSI Divergence + Wyckoff
During accumulation, look for bullish RSI divergence — price makes equal or lower lows while RSI makes higher lows. This confirms buying pressure is building beneath the surface.
VWAP + Wyckoff
VWAP acts as an institutional reference point within the range. If price consistently reclaims VWAP after dips during accumulation, institutions are defending the price level.
ASI Score + Wyckoff
CoinXSight's ASI Score aggregates 12+ indicators into one metric. When ASI score rises during a Wyckoff spring, it confirms that the quantitative data aligns with the price action — a high-probability entry.
Common Wyckoff Mistakes
1. Seeing Wyckoff Everywhere
Not every consolidation is Wyckoff accumulation/distribution. Sometimes price moves sideways because there's genuinely no interest. Look for:
Volume evidence: Volume patterns must match the schematic
Context: There should be a preceding trend (down for accumulation, up for distribution)
Timeframe: Wyckoff works best on 4H, Daily, and Weekly charts — not on 5-minute
2. Entering Before the Spring/Upthrust
The spring is the KEY event. Entering during the range before the spring means:
You don't know if it's accumulation or distribution yet
Your stop has to be wider (below the entire range)
Your risk/reward is worse
3. Ignoring Volume
Wyckoff without volume is just support/resistance trading. Volume is what separates a genuine spring from a genuine breakdown. Always check volume on every event.
4. Using Wrong Timeframes
Timeframe
Best For
Minimum Range Duration
4H
Swing trades (3-14 days)
2 weeks
Daily
Position trades (2-8 weeks)
1-2 months
Weekly
Macro positioning (months)
3-6 months
1H or less
Not recommended for Wyckoff
—
5. Not Waiting for Confirmation
The spring/upthrust needs CONFIRMATION — a low-volume test of the event area. Without this test, you don't know if the false breakout was genuine or if more supply/demand is coming.
Wyckoff analysis isn't about predicting the future — it's about reading what institutions are doing RIGHT NOW through price and volume. The patterns repeat because human greed and fear haven't changed in 100 years. Combined with 2026's on-chain analytics, Wyckoff gives you institutional-grade market reading that most retail traders will never develop.
Lead Technical Systems Architect·Signals & Metrics Desk
Technical systems developer with a mathematical focus on momentum indicators, volatility metrics (ATR), volume profiles, and multi-timeframe filter models.
QUANTITATIVE SUITE // DEEP ALPHA ENGINEACTIVE
BTC/USDT // LIVE SCANNER
CONFLUENCE 93
LIVE SPOT PRICE$83,908.89STRONG_BUY
TP2
$89,725.68
+6.94%
TP1
$86,233.44
+2.77%
ENTRY
$83,905.28
ZONE
SL
$82,741.19
-1.39%
Auto-detect Order Blocks, Fair Value Gaps and risk-adjusted DCA ladders in < 5s.