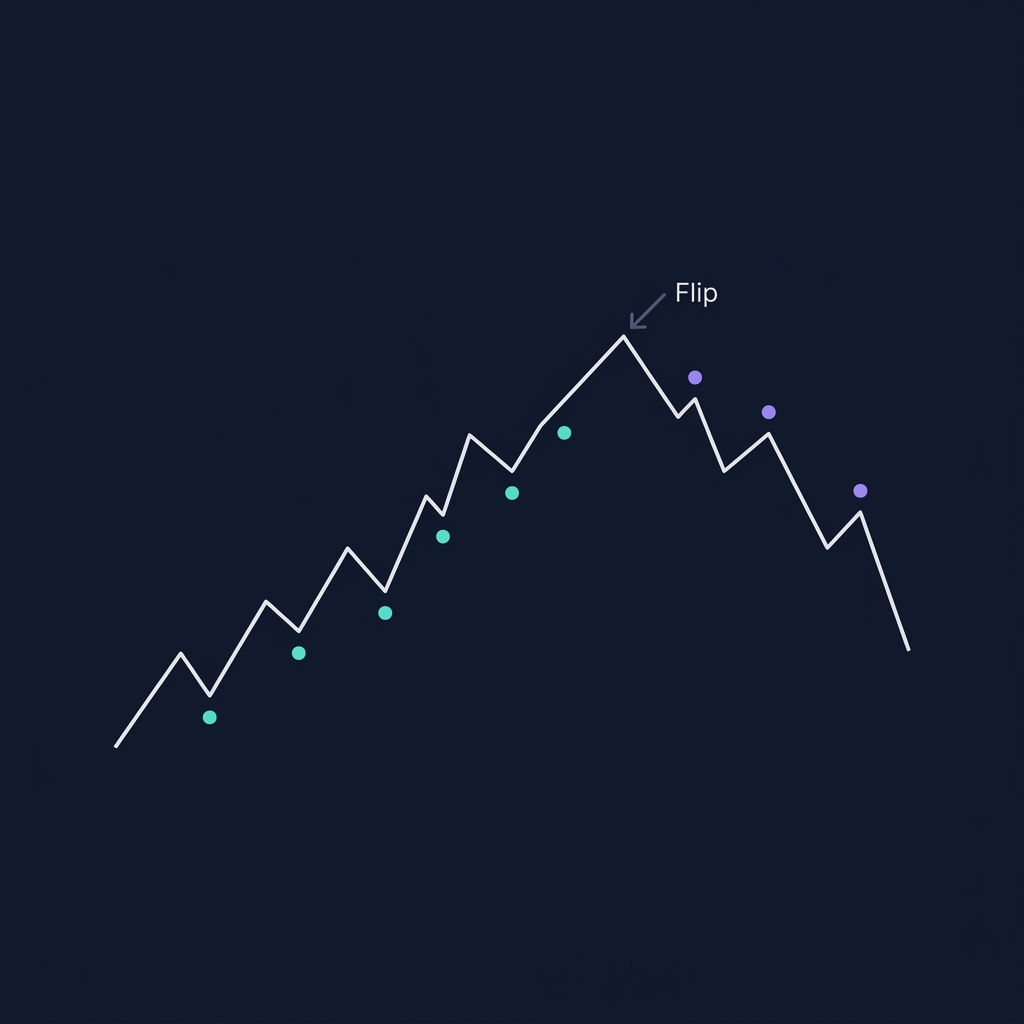
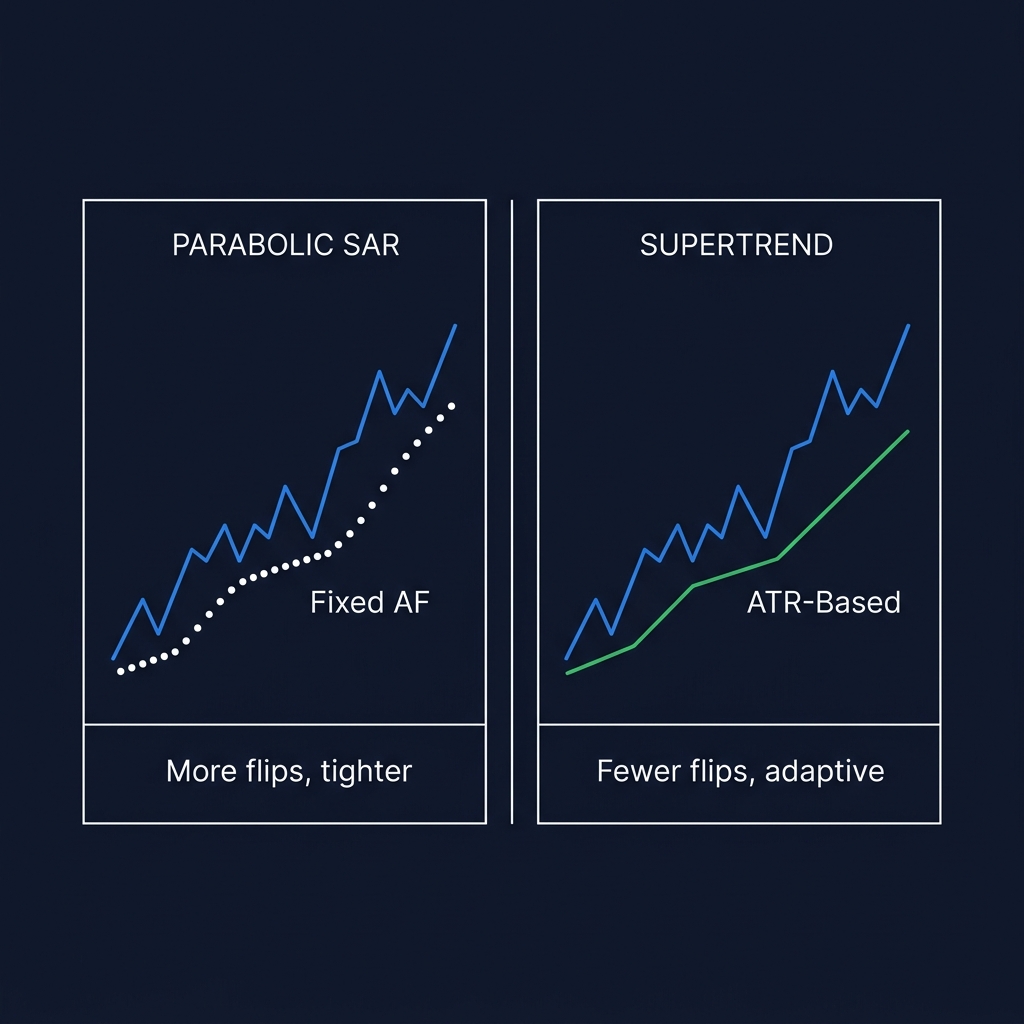
Parabolic SAR (Stop and Reverse) is a trend-following indicator that plots dots above or below price candles to signal trend direction and provide a built-in trailing stop level. When dots are below price, the trend is bullish. When dots are above price, the trend is bearish. When the dots "flip" from below to above (or vice versa), a trend reversal has occurred.
Parabolic SAR was developed by J. Welles Wilder Jr. — the same creator of RSI and ATR — and published in his 1978 book New Concepts in Technical Trading Systems.
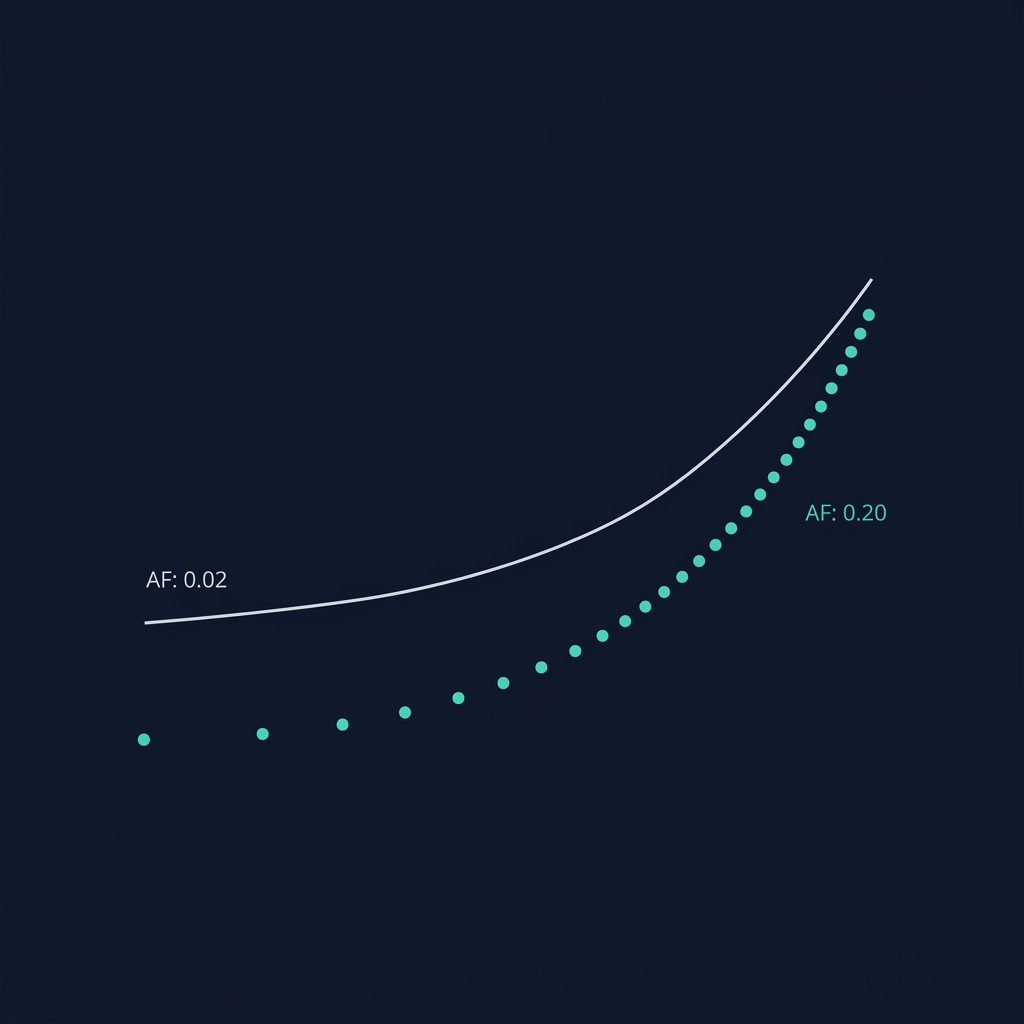
The "parabolic" name comes from the dot pattern: as a trend continues, the dots accelerate toward price in a parabolic curve, eventually catching up and triggering the reversal signal. For a complete overview of all crypto indicators and how they work together, see our Cryptocurrency Technical Analysis Indicators guide.
💡 Parabolic SAR and Supertrend serve similar roles on CoinXSight — both provide trend direction and trailing stop levels. Supertrend uses ATR for volatility-adaptive stops, while Parabolic SAR uses its own acceleration factor. Many traders use both and only act when they agree.
How Parabolic SAR Is Calculated
The SAR formula uses two parameters:
SAR(tomorrow) = SAR(today) + AF × (EP - SAR(today))

Where:
  AF  = Acceleration Factor (starts at 0.02, max 0.20)
  EP  = Extreme Point (highest high in uptrend, lowest low in downtrend)
Each time a new EP is reached (new high in uptrend or new low in downtrend), the AF increases by 0.02, up to a maximum of 0.20. This acceleration is what makes the dots curve toward price — the longer the trend continues, the faster the SAR approaches price.
Default settings: AF start = 0.02, AF step = 0.02, AF max = 0.20
SAR Flip Rules
Uptrend → Downtrend: Price closes below the SAR dot → dots flip above price
Downtrend → Uptrend: Price closes above the SAR dot → dots flip below price
How to Read Parabolic SAR — The 4 Key Signals
Signal 1: Trend Direction
Dots below candles = Uptrend → Hold longs, trail stop at SAR
Dots above candles = Downtrend → Hold shorts or stay flat
Signal 2: SAR Flip (Reversal Signal)
When dots flip from below to above price, close longs and consider shorts. When dots flip from above to below, close shorts and consider longs.
2026 reality check: In BTC's trending February-March 2026, the SAR on the daily chart stayed bullish (dots below) for 28 consecutive days. The flip on March 12 preceded a -8% correction within the week.
Signal 3: Dot Spacing = Trend Strength
Wide spacing between dots and price = Early trend, plenty of room
Tight spacing = Trend maturing, SAR approaching price, reversal imminent
Signal 4: SAR as Trailing Stop
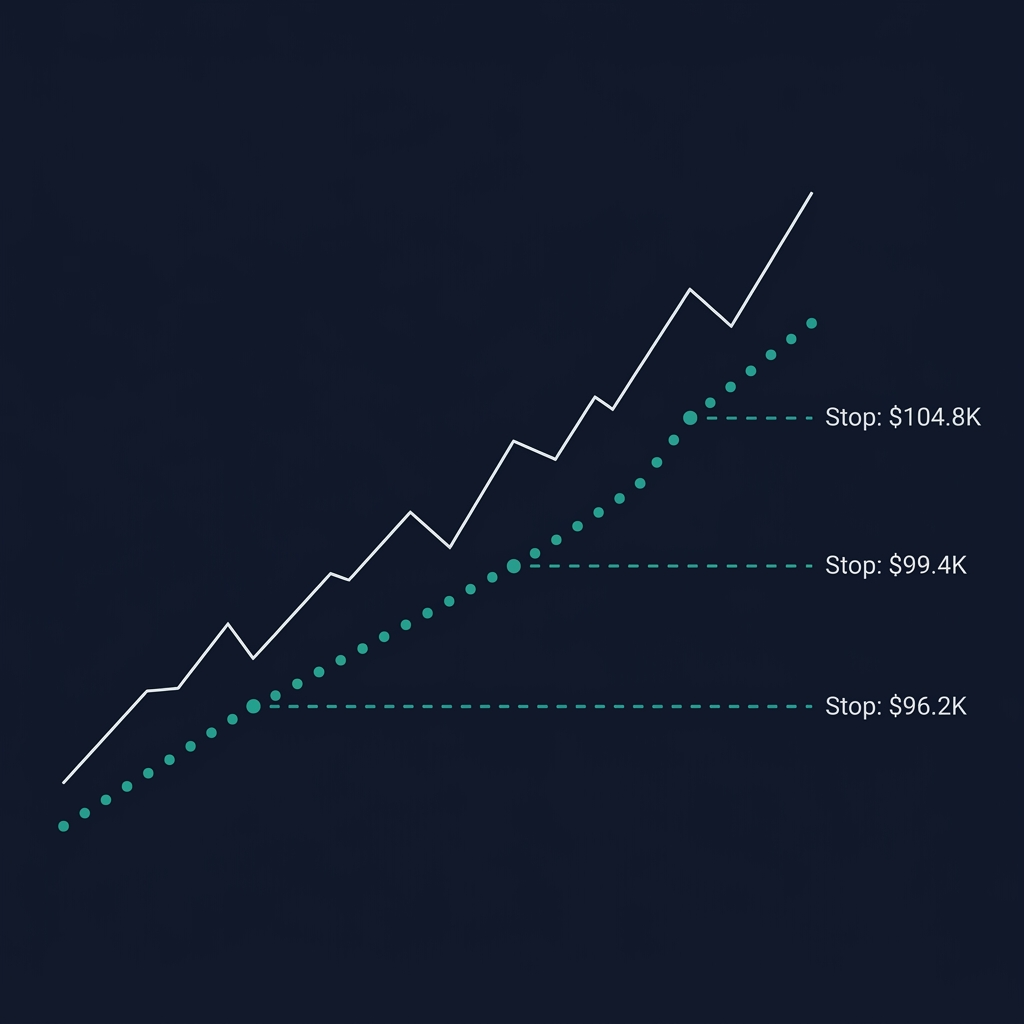
Use the SAR dot as your stop-loss level. As the trend progresses, the SAR automatically tightens — you don't need to manually adjust your stop.
3 Real Trading Scenarios with Parabolic SAR
Scenario 1: BTC SAR Flip to Bullish — February 2026
Setup on CoinXSight Chart Pro:
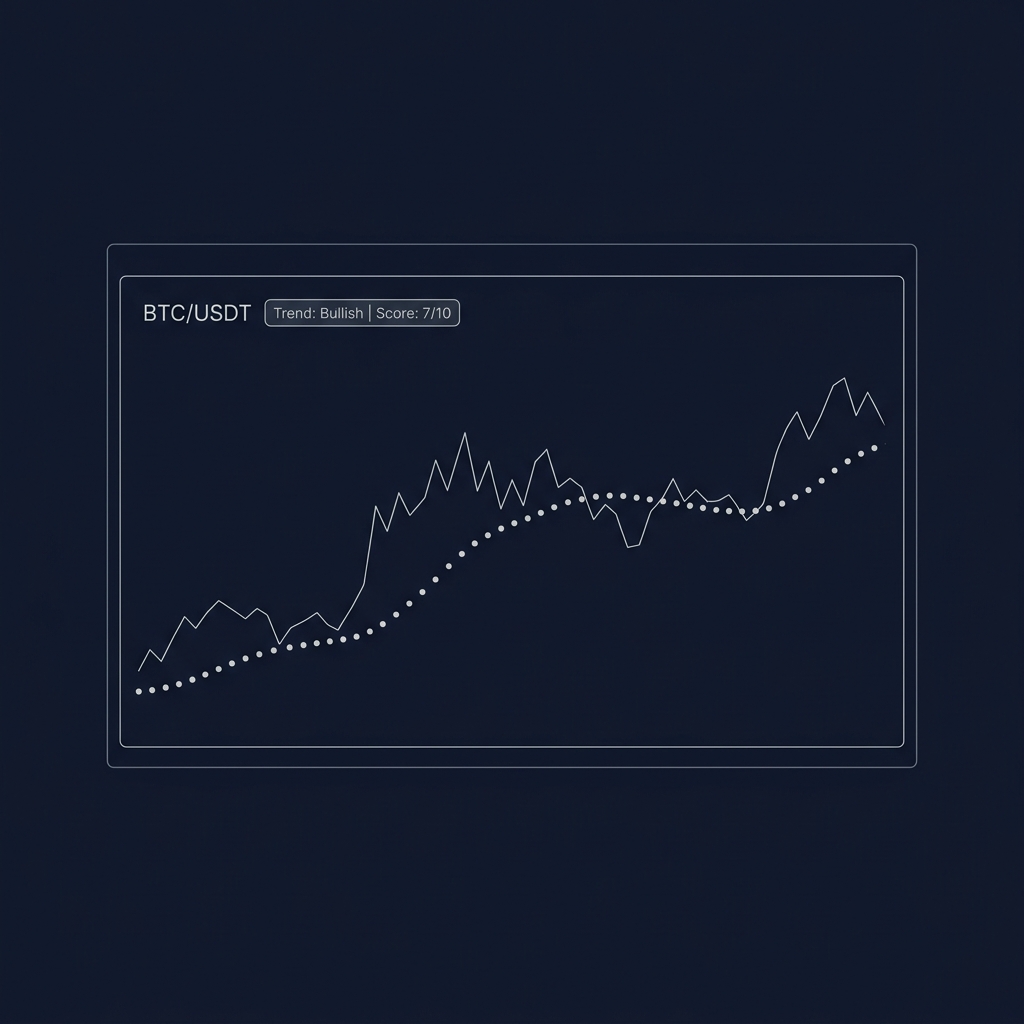
BTC/USDT daily chart: SAR dots flipped from above to below price at $97,500 on February 1, 2026. ADX: 26 and rising — confirmed a real trend forming. EMA 9/21 had just completed a bullish crossover. Confluence Score: 7/10.
Action: Long entry at $97,800 with stop at the SAR level ($96,200). Trail stop daily at the SAR dot.
Result: BTC trended to $108,500 over the next 5 weeks. SAR trail was never hit — the stop gradually tightened from $96,200 → $99,400 → $102,100 → $104,800 → $106,500. The SAR flip to bearish on March 12 at $106,500 closed the trade for +8.9%.
Scenario 2: SOL SAR Whipsaw in Range — March 2026
Setup:
SOL/USDT 4H chart: SAR flipped bullish at $168. But ADX was at 14 — NO trend present. The Confluence Score was 4/10.
Result: SAR flipped 6 times in 10 days as SOL ranged between $162-$172. Each flip was a false signal. Total loss if traded: -8.2% from whipsaw entries.
Lesson: NEVER trade SAR flips when ADX < 20. Parabolic SAR is a trend-following tool — it produces garbage signals in ranges.
Scenario 3: ETH SAR + Supertrend Double Confirmation — May 2026
Both trailing stops converged at $2,385-$2,395 — strong support floor
Confluence Score: 7/10
Action: Long at $2,425 with stop at $2,380 (below both trailing stop levels).
Result: ETH reached $2,580 by May 12 (+6.4%). Having both SAR and Supertrend agree on the same trend and stop zone provided high-conviction trade management.
Recommendation: Use Supertrend as your primary trend tool (it's in CoinXSight's Trend Layer). Use Parabolic SAR as secondary confirmation — when both agree on direction and provide similar stop levels, you have a high-confidence setup.
⚠️ Limitation: Parabolic SAR's biggest weakness is ranging markets. The fixed acceleration factor means dots approach price regardless of volatility conditions — in choppy markets, the SAR triggers constant false flips. Always combine with ADX (> 25) to confirm a trend exists before trading SAR signals.
How to Use Parabolic SAR on CoinXSight
CoinXSight provides a crypto analytics platform where you can apply these concepts with real-time data:
Wait for SAR to flip (dots change side) on 4H or daily chart
Enter on the flip candle, set stop at the first SAR dot
Trail your stop at each new SAR dot as the trend progresses
Exit when SAR flips against you OR when Confluence drops below 5/10
Whether you want to buy Bitcoin, buy Ethereum, or trade altcoins, this indicator helps you time entries on any crypto exchange with data-driven confidence.
FAQ
What is the best Parabolic SAR setting for crypto?
The default 0.02/0.20 works well for daily charts. For 4H charts, try 0.01/0.10 for less sensitivity and fewer false flips. For scalping on 1H, use 0.03/0.20 for faster signals.
Is Parabolic SAR better than Supertrend for crypto?
Supertrend is generally better for crypto because it adapts to volatility via ATR. Parabolic SAR's fixed acceleration causes more whipsaws. Use both together — trade when they agree.
How do I avoid Parabolic SAR whipsaws?
Only trade SAR signals when ADX > 25 (confirmed trend). Ignore SAR flips during ranging conditions (ADX < 20). Use 4H or daily timeframe — shorter timeframes produce excessive false signals.
Does CoinXSight use Parabolic SAR in the Confluence Score?
CoinXSight's Trend Layer uses Supertrend rather than Parabolic SAR. You can add SAR on Chart Pro as a supplementary trailing stop tool alongside the automated Confluence scoring.
Which crypto analytics platform offers the best parabolic sar tools?
CoinXSight provides parabolic sar analysis alongside 12+ other trading indicators, all integrated into an AI-powered Confluence Scoring system. It's a comprehensive crypto analytics platform that combines technical analysis with on-chain data and Smart Money Concepts for higher-probability trade setups.
JV
Julian Vance
TA // SYSTEMS
Lead Technical Systems Architect·Signals & Metrics Desk
Technical systems developer with a mathematical focus on momentum indicators, volatility metrics (ATR), volume profiles, and multi-timeframe filter models.
QUANTITATIVE SUITE // DEEP ALPHA ENGINEACTIVE
BTC/USDT // LIVE SCANNER
CONFLUENCE 93
LIVE SPOT PRICE$83,908.89STRONG_BUY
TP2
$89,725.68
+6.94%
TP1
$86,233.44
+2.77%
ENTRY
$83,905.28
ZONE
SL
$82,741.19
-1.39%
Auto-detect Order Blocks, Fair Value Gaps and risk-adjusted DCA ladders in < 5s.
Master every cryptocurrency technical analysis indicator with this complete guide. Covers 27 indicators across trend, momentum, volume, volatility, and crypto-native…