Volume Profile Guide: How to Find High-Probability Price Levels in Crypto
Master Volume Profile analysis for crypto trading. Learn to identify Point of Control, Value Area, and High/Low Volume Nodes for precise entries and exits.
JV
Julian VanceLead Technical Systems Architect·May 17, 2026 · 9 min read · Updated Oct 6
Volume Profile is a charting tool that displays the total volume traded at each price level over a specified period. Unlike traditional volume bars at the bottom of a chart (which show volume over time), Volume Profile shows volume by price — revealing exactly where the most buying and selling has occurred.
This distinction is critical because it exposes the price levels where large participants (institutions, whales, market makers) have built their positions. These levels act as powerful support and resistance zones because market participants tend to defend the prices at which they've accumulated large positions.
In crypto, Volume Profile is particularly effective because the market is dominated by a relatively small number of large players whose activity at specific price levels creates predictable reaction zones. For a complete overview of all crypto indicators and how they work together, see our Cryptocurrency Technical Analysis Indicators guide.
Key Volume Profile Components
Point of Control (POC)
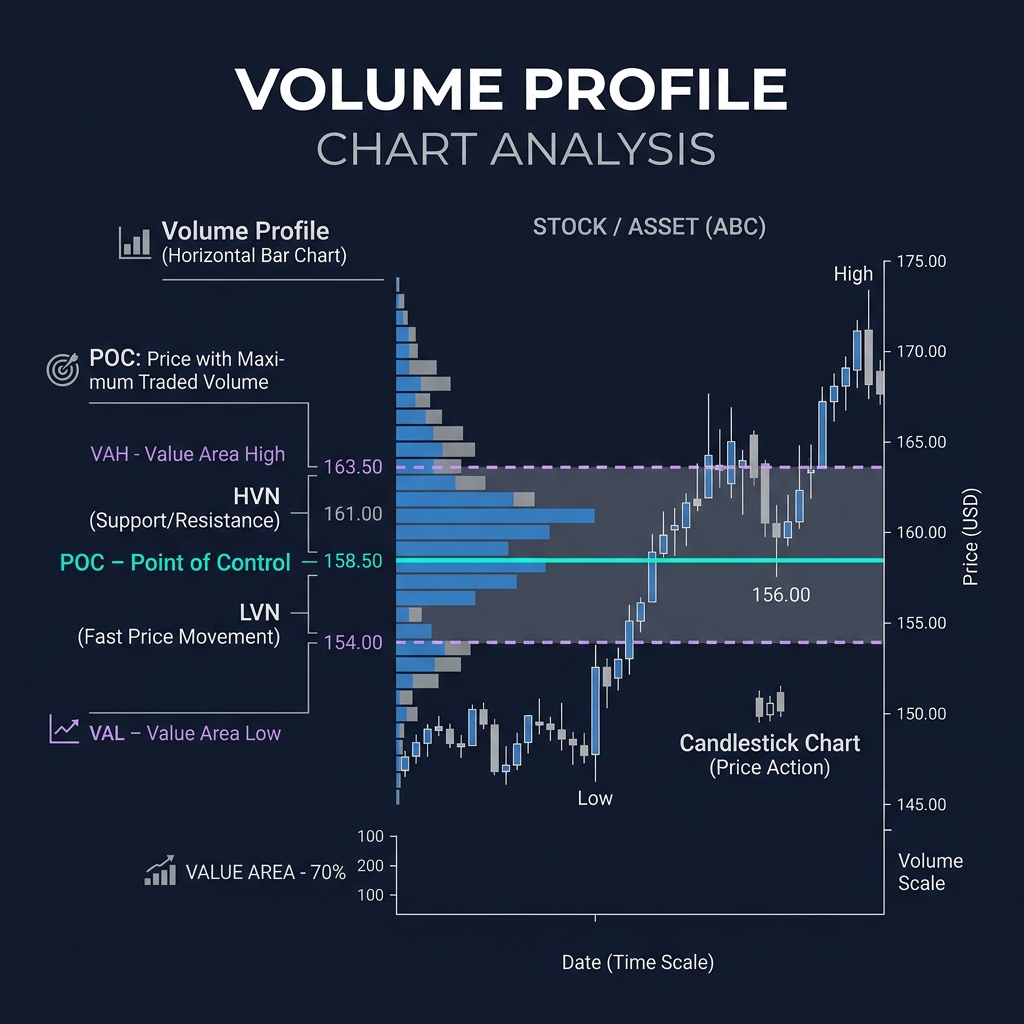
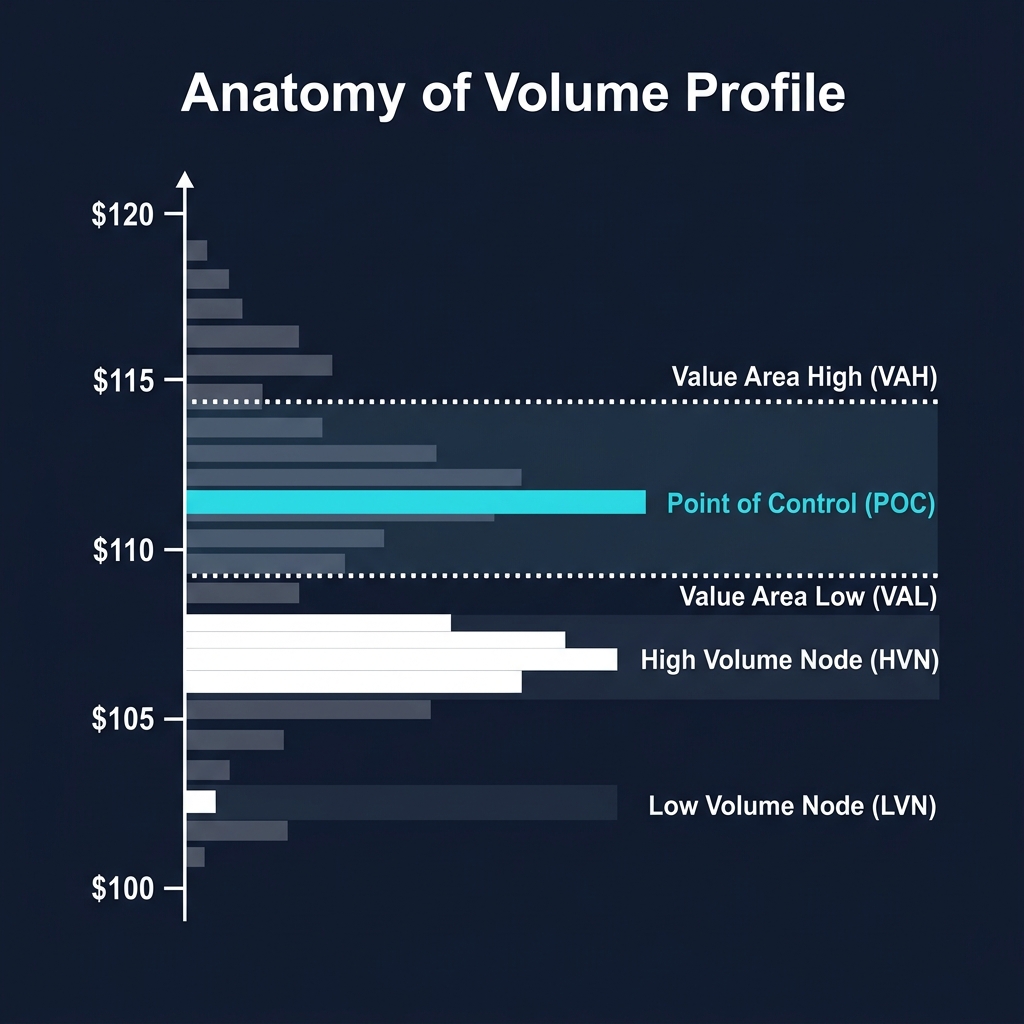
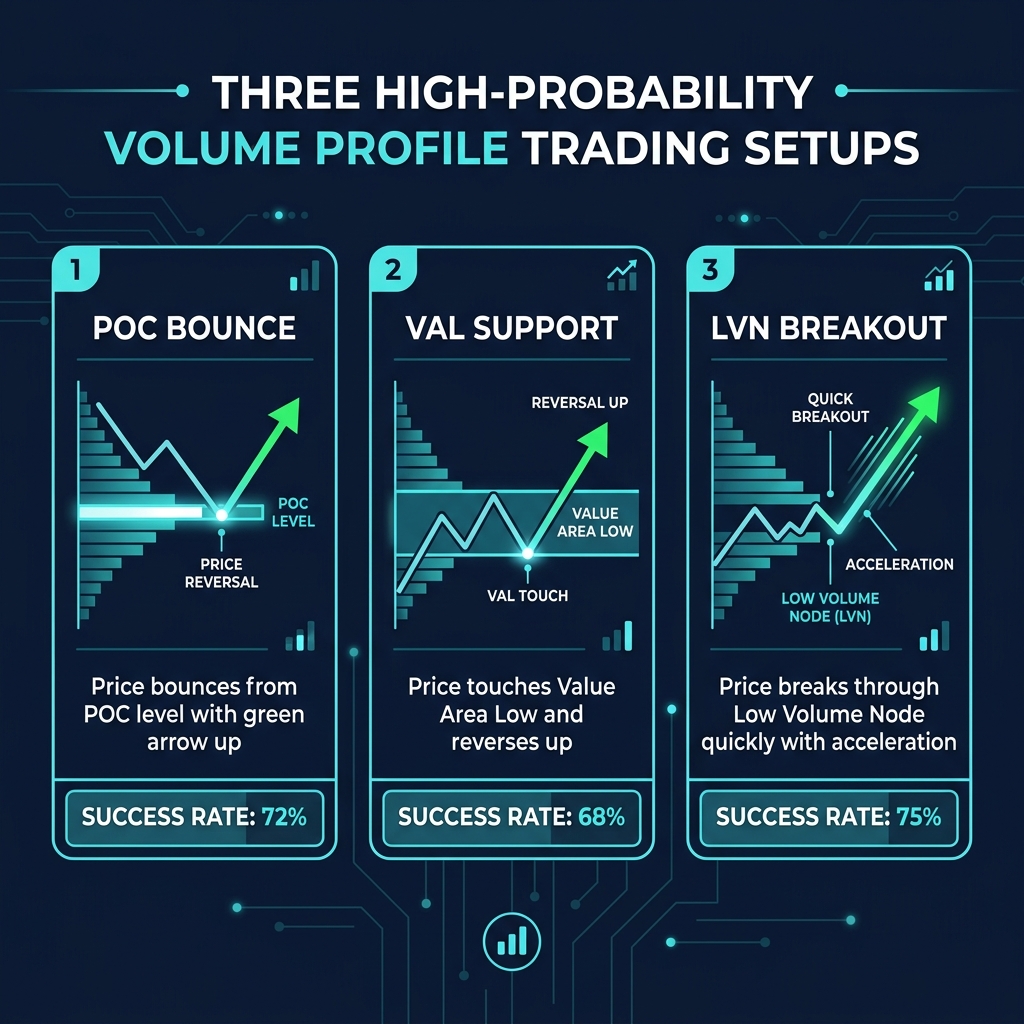
The Point of Control is the price level with the highest traded volume in the selected range. It represents the "fair value" as agreed upon by the largest number of market participants.
Price returning to POC → likely to find support/resistance
POC from high-timeframe ranges acts as a magnetic level — price gravitates toward it
In crypto specifically: After volatile moves (pump or dump), price frequently returns to the POC of the previous range. This "mean reversion to POC" pattern is one of the most reliable setups in crypto Volume Profile trading.
Value Area (VA)
The Value Area is the price range where 70% of all volume was traded. It defines the zone where most market activity occurred — the area of acceptance.
Value Area High (VAH): The upper boundary of the 70% volume zone → acts as resistance
Value Area Low (VAL): The lower boundary → acts as support
How to use Value Area:
Price within the VA → range-bound, mean-reversion strategies work best
Price breaking below VAL with volume → potential breakdown, look for short opportunities or exit longs
High Volume Nodes (HVN)
High Volume Nodes are clusters of heavy trading at specific price levels. They represent areas of strong agreement between buyers and sellers.
Characteristics:
Act as strong support/resistance zones
Price tends to slow down and consolidate at HVNs
Difficult for price to break through quickly
When broken, the breakout tends to be significant
Low Volume Nodes (LVN)
Low Volume Nodes are price levels with minimal trading activity — areas where price moved through quickly without significant participation.
Characteristics:
Price moves through LVNs rapidly (low resistance to movement)
Act as "gaps" that price tends to fill
Excellent levels for setting profit targets — price will likely pause at the next HVN after passing through an LVN
Breakouts through LVNs tend to be fast and directional
Volume Profile Trading Strategies
Strategy 1: Value Area Bounce (Mean Reversion)
Setup: Price approaches the Value Area High or Value Area Low from within the Value Area.
Entry rules:
Price reaches VAH from below → look for rejection (bearish candle, volume decline)
Short at VAH with stop-loss above the HVN above VAH
Target: POC, then VAL
Alternatively: price reaches VAL from above → look for bounce → long entry
Win rate: This strategy has a high win rate in ranging markets but fails in trending markets. Use CoinXSight's AI Analysis to determine if the market is trending or ranging before applying this strategy.
Strategy 2: Value Area Breakout (Trend Following)
Setup: Price breaks above VAH or below VAL with above-average volume.
Entry rules:
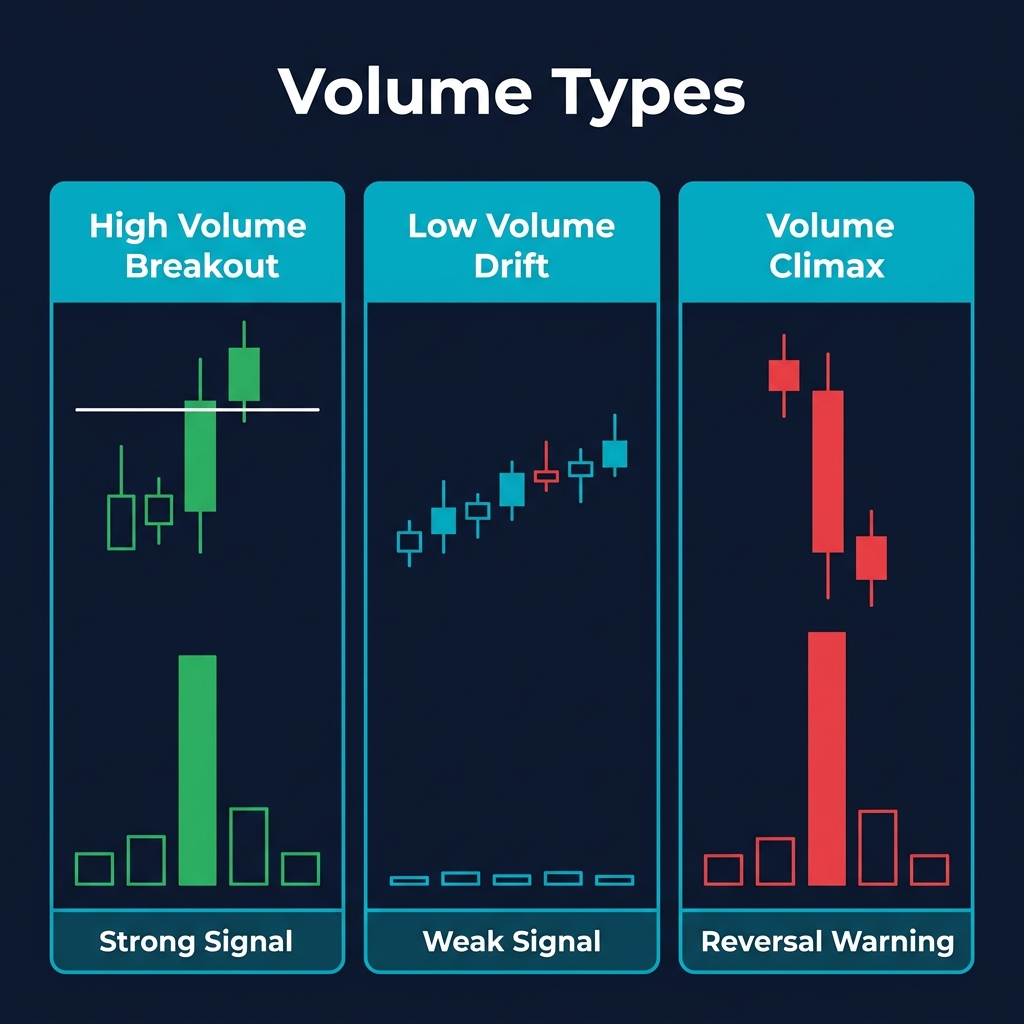
Price closes above VAH on a candle with volume 1.5x above the 20-period average
Enter long on the close or on a pullback to VAH (which now acts as support)
Stop-loss: below VAH
Target: the next HVN above, or use Fibonacci extensions (Fibonacci Guide)
Key confirmation: The breakout should be accompanied by increasing volume. A breakout on declining volume is likely a false breakout — it will reverse back into the Value Area.
Strategy 3: POC Reversion After Volatile Moves
Setup: After a sharp move away from POC (pump or dump), price starts showing signs of reversal.
Entry rules:
Identify the current session's POC
Price moves 3%+ away from POC during a volatile event
Stop-loss: beyond the extreme of the volatile move
Why it works: The POC acts as an equilibrium price. After deviations, price has a statistical tendency to return to the POC, especially in the absence of new fundamental catalysts.
Strategy 4: Low Volume Node Breakout
Setup: Price approaches a Low Volume Node (thin area with minimal historical volume).
Entry rules:
Identify LVNs on your Volume Profile — gaps between HVN clusters
When price enters an LVN, expect rapid movement through the zone
Position in the direction of the approaching move before the LVN
Target: the next HVN on the other side of the LVN
Use a trailing stop as price moves through the LVN
Combining Volume Profile with CoinXSight's Tools
Volume Profile + Confluence Scoring
CoinXSight's Confluence Scoring System combines 12+ indicators into a single confidence score. When a high confluence score aligns with a Volume Profile level (HVN, POC, or VA boundary), the trade probability increases significantly.
Workflow:
Identify key Volume Profile levels on your chart
Check if CoinXSight's AI has identified the same zone as significant
If confluence score is above 70 AND price is at a VP level → high-confidence trade
If only one factor is present → wait for additional confirmation
Order blocks often align with HVNs (institutional accumulation zones)
Fair Value Gaps often appear in LVN zones (price moved too fast, low participation)
Liquidity sweeps often target price levels just beyond VAH or VAL
Volume Profile + Multi-Timeframe Analysis
Apply Volume Profile across multiple timeframes for layered analysis (MTF Guide):
Weekly VP: Identifies macro support/resistance zones
Daily VP: Identifies swing-level trading zones
Session VP: Identifies intraday entry points
When a daily HVN aligns with a weekly POC, that price level carries exceptional weight.
Volume Profile Settings for Crypto
Fixed Range vs Session Volume Profile
Fixed Range VP: You manually select the start and end points. Best for analyzing specific price ranges, consolidation zones, or individual swings.
Session VP: Automatically calculates volume profile for each trading session. Since crypto trades 24/7, define sessions as: Asian (00:00-08:00 UTC), European (08:00-16:00 UTC), US (16:00-00:00 UTC).
Row Size (Tick Size)
For Bitcoin: 50-100 tick size for daily analysis, 200-500 for weekly
For altcoins: adjust based on price — smaller-priced tokens need proportionally smaller tick sizes
Too many rows → noisy profile. Too few → missing detail. Aim for 100-200 rows per profile.
Lookback Period
Day traders: last 5-10 sessions
Swing traders: last 20-30 sessions
Position traders: last 60-90 sessions or the entire current market cycle
Common Mistakes with Volume Profile
1. Using VP Without Context
Volume Profile shows where activity has occurred but doesn't predict direction. Always combine VP levels with directional analysis — trend structure (Market Structure Guide), momentum indicators (MACD, RSI), and on-chain data.
2. Ignoring the Developing Profile
Most traders only look at completed (historical) Volume Profiles. The developing profile — the VP forming during the current session — is equally important because it shows where current participants are building positions.
3. Over-Relying on POC Alone
While POC is powerful, the entire profile shape matters. A balanced, bell-shaped profile suggests consolidation. A double-peak profile suggests two competing price levels. A P-shaped or b-shaped profile suggests trending conditions with distribution or accumulation.
4. Wrong Timeframe Selection
Using a 1-day Volume Profile for a multi-week trade makes the analysis irrelevant. Match your VP timeframe to your trade duration. If you're holding for 2 weeks, use a 30-60 day VP lookback.
Whether you want to buy Bitcoin, buy Ethereum, or trade altcoins, this indicator helps you time entries on any crypto exchange with data-driven confidence.
Frequently Asked Questions
Is Volume Profile better than regular volume?
They serve different purposes. Regular volume shows when activity occurs (time-based). Volume Profile shows where activity occurs (price-based). For identifying support/resistance levels, Volume Profile is superior. For confirming breakouts and trend strength, regular volume is more immediately useful. Use both.
Does Volume Profile work for low-liquidity altcoins?
Volume Profile requires sufficient trading volume to produce meaningful patterns. For tokens with daily volumes below $1 million, VP levels are less reliable. Focus VP analysis on tokens with at least $5 million daily volume.
How do I know if a VP level will hold or break?
No VP level is guaranteed to hold. The probability of holding increases when: (1) the HVN is thick (heavy volume), (2) it aligns with other technical factors (EMA, Fibonacci), (3) approaching volume is declining, and (4) the broader trend supports a reversal at that level.
Can I use Volume Profile for entries on CoinXSight's Alpha Hunter signals?
Yes. When Alpha Hunter flags a signal, check the Volume Profile for the token. Enter at or near an HVN for higher-probability entries. If the signal fires in an LVN zone, be aware that price may move quickly and consider using a limit order at the nearest HVN.
Should I use Volume Profile on DEX or CEX data?
For tokens traded primarily on DEXs (meme coins, DeFi tokens), CEX Volume Profile may not capture the full picture. Ideally, use aggregated volume data from both CEX and DEX sources. For major tokens (BTC, ETH, SOL), CEX data is sufficient.
Summary
Volume Profile transforms your understanding of support and resistance from subjective line drawing to data-driven analysis. By seeing exactly where the most trading has occurred, you can identify the price levels that institutions and large traders will defend, the zones where price will move quickly, and the equilibrium levels where price gravitates.
Master the core components (POC, Value Area, HVN, LVN), apply them across multiple timeframes, and combine with CoinXSight's confluence scoring for the highest-probability trade setups. Volume Profile is not a standalone trading system — it's a precision tool that makes every other strategy more effective.
Lead Technical Systems Architect·Signals & Metrics Desk
Technical systems developer with a mathematical focus on momentum indicators, volatility metrics (ATR), volume profiles, and multi-timeframe filter models.
QUANTITATIVE SUITE // DEEP ALPHA ENGINEACTIVE
BTC/USDT // LIVE SCANNER
CONFLUENCE 93
LIVE SPOT PRICE$83,908.89STRONG_BUY
TP2
$89,725.68
+6.94%
TP1
$86,233.44
+2.77%
ENTRY
$83,905.28
ZONE
SL
$82,741.19
-1.39%
Auto-detect Order Blocks, Fair Value Gaps and risk-adjusted DCA ladders in < 5s.
Master multi-timeframe analysis for crypto trading. Learn the 3-timeframe rule, top-down analysis flow, timeframe alignment signals, and how to combine…