EMA Indicator: How to Use Exponential Moving Averages for Crypto Trend Trading
Master the EMA indicator for crypto. Learn EMA 34/89/200 crossovers, dynamic support/resistance, and how CoinXSight uses EMAs in its Confluence Scoring system.
JV
Julian VanceLead Technical Systems Architect·May 16, 2026 · 8 min read · Updated Oct 6
The Exponential Moving Average (EMA) is a trend-following indicator that calculates the average price of an asset over a specific period, giving more weight to recent prices. Unlike the Simple Moving Average (SMA), which treats all prices equally, the EMA reacts faster to new price data — making it the preferred moving average for crypto traders who operate in fast-moving markets.
EMAs answer two critical questions: What direction is the trend? and Where is dynamic support or resistance? For a complete overview of all crypto indicators and how they work together, see our Cryptocurrency Technical Analysis Indicators guide.
💡 On CoinXSight, EMAs (periods 34, 89, and 200) are automatically computed by the platform's analysis engine and the results are available across multiple modules — Deep Alpha displays the numerical values and trend status, Chart Pro overlays the EMA ribbon on the candlestick chart, Discovery uses them for signal triage, and Meme Hunter factors them into token scoring. No manual configuration required.
How EMA Is Calculated
The EMA formula applies a smoothing multiplier to weight recent prices more heavily:
The larger the period, the slower the EMA responds. EMA 200 is almost glacial — it takes weeks of sustained price movement to shift it significantly. EMA 34 reacts within days.
The CoinXSight EMA Ribbon — 3 Periods, 3 Purposes
This is where crypto technical analysis becomes practical — a quality crypto analytics platform will display these signals in real time, helping you act on setups as they form.
CoinXSight's analysis engine computes three EMAs that serve different roles:
EMA
Period
Purpose
Timeframe Focus
EMA 34
Short-term
Identifies swing momentum shifts
Days to 1-2 weeks
EMA 89
Medium-term
Establishes the dominant trend
2-6 weeks
EMA 200
Long-term
Defines the macro bull/bear boundary
Months
How to read the EMA ribbon:
All 3 EMAs stacked bullish (Price > EMA 34 > EMA 89 > EMA 200): Strong uptrend — ride it
All 3 EMAs stacked bearish (Price < EMA 34 < EMA 89 < EMA 200): Strong downtrend — stay cautious
EMAs tangled/crossing: Trend is transitioning — wait for clarity before entering new positions
3 Core EMA Trading Techniques
Technique 1: EMA Crossovers — Trend Change Signals
An EMA crossover occurs when a shorter-period EMA crosses above or below a longer-period EMA.
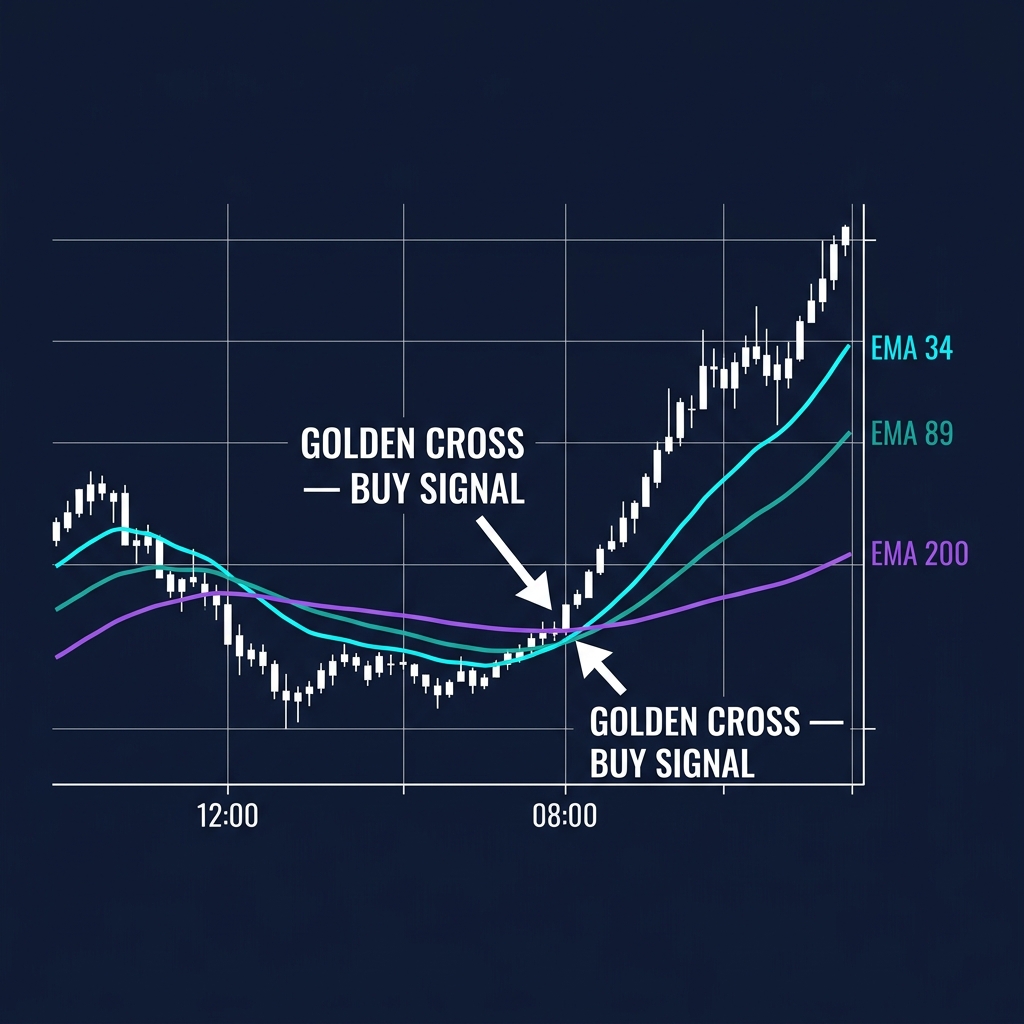
Bullish crossover (Golden Cross):
EMA 34 crosses above EMA 89 → the short-term trend has turned upward. When EMA 89 also crosses above EMA 200, the macro trend is confirmed bullish.
Bearish crossover (Death Cross):
EMA 34 crosses below EMA 89 → short-term momentum is fading. When EMA 89 crosses below EMA 200, the macro trend is confirmed bearish.
Signal
Condition
Reliability
Strong buy
EMA 34 crosses above EMA 89, both above EMA 200
★★★★★
Moderate buy
EMA 34 crosses above EMA 89, below EMA 200
★★★☆☆
Strong sell
EMA 34 crosses below EMA 89, both below EMA 200
★★★★★
Weak signal
EMAs tangled, frequent crosses in narrow range
★☆☆☆☆
⚠️ Limitation: EMA crossovers are lagging signals — by the time the cross happens, the move is partially underway. On a daily chart, a bullish EMA 34/89 crossover typically occurs 3-5 days after the low. This is the tradeoff: confirmation vs. timing. Using faster timeframes (4H) reduces lag but increases false signals.
Technique 2: EMA as Dynamic Support & Resistance
EMAs function as moving support and resistance levels. In an uptrend, price repeatedly bounces off EMAs; in a downtrend, EMAs act as ceilings.
How each EMA functions:
EMA
In Uptrend (Support)
In Downtrend (Resistance)
EMA 34
First pullback zone — shallow dips bounce here
First rally ceiling — rallies stall here
EMA 89
Deeper pullback zone — healthy corrections test this
Stronger resistance — rallies reject here
EMA 200
The "line in the sand" — losing this flips the macro trend
Major resistance — breaking above this signals trend reversal
Real-world scenario — ETH, April 2026, 4H chart:
On April 22, 2026, ETH pulled back from $3,450 to $3,280 during a confirmed uptrend. CoinXSight's analysis engine showed EMA 89 sitting at $3,270 — right at the pullback low. Simultaneously:
RSI: 38 (approaching oversold)
MACD: Histogram compressing but still above zero
Confluence Score: 7/10
ETH bounced from $3,280 (within $10 of EMA 89) and rallied to $3,620 over the next 4 days — a 10.4% move from a standard EMA support bounce.
Technique 3: EMA Within the Confluence Scoring System
On CoinXSight, EMAs are not evaluated in isolation. They form the backbone of the Trend Layer in the 4-layer Confluence Scoring system:
Trend Layer: EMA ribbon (34/89/200) + Supertrend → establishes direction ← EMAs contribute here
SMC Layer: Order Blocks + Fair Value Gaps → identifies institutional zones
Volume Layer: Volume ratio + Bollinger Bands → validates participation
The Trend Layer evaluates:
EMA alignment: Are all 3 EMAs stacked in the same direction?
Price position: Is price above or below the EMA ribbon?
EMA slope: Are the EMAs trending upward, downward, or flat?
A perfect Trend Layer score (2.5/2.5) requires price above all EMAs, all EMAs stacking bullish, and EMAs sloping upward with increasing separation.
EMA vs. SMA — Which Should You Use?
Feature
EMA
SMA
Calculation
Weighted toward recent prices
Equal weight to all prices
Speed
Reacts faster to new data
Smoother, slower reaction
False signals
More frequent in choppy markets
Fewer, but signals come later
Best for
Active trading, crypto's volatility
Identifying long-term trends
CoinXSight usage
Default for all EMA indicators
Not used — EMA is superior for crypto
Why crypto favors EMA over SMA: Crypto markets trade 24/7/365 with no market close. Price gaps and overnight moves are irrelevant — there is no "overnight." The EMA's recency bias captures the continuous price action better than SMA's equal weighting, which includes data from periods that are no longer relevant.
Common EMA Mistakes
Using too many EMAs: Adding EMA 10, 20, 34, 50, 89, 100, 200 to your chart creates a pasta bowl of lines. Stick to 3 — CoinXSight uses 34/89/200 because each serves a distinct purpose (momentum, trend, macro).
Trading EMA crossovers in ranging markets: When price oscillates in a tight range, EMAs tangle and produce constant crossovers — each one a false signal. Check if EMAs are flat and close together before trusting a crossover.
Ignoring the slope: An EMA value alone is insufficient. EMA 89 at $78,000 rising is bullish. EMA 89 at $78,000 falling is bearish. The direction of the EMA matters as much as price's position relative to it.
Using EMA on very short timeframes: On a 1-minute chart, EMA 34 covers only 34 minutes of data — essentially noise. EMAs produce reliable signals on 4H, daily, and weekly charts. Below 1H, the signal-to-noise ratio deteriorates rapidly.
How to Use EMAs on CoinXSight — Multi-Module Workflow
CoinXSight's crypto analytics platform streamlines this workflow with AI-powered tools and real-time data:
After 6 years of watching moving averages, the single biggest improvement to my process was switching from manually drawing EMAs on TradingView to using a system that integrates EMA status with the rest of the technical picture in one view. Here is exactly how I read EMAs on CoinXSight.
Step 1: Read the EMA ribbon structure on Chart Pro
Open Chart Pro → toggle EMA 34, EMA 89, and EMA 200 from the indicator toolbar. In the screenshot below, BTC 1H shows EMA 34 (green) at $79,846, EMA 89 (blue) at $80,206, and EMA 200 (orange) at $80,494. All three EMAs are above price — that is a bearish stack. Notice how price attempted to rally to $82,400 but was rejected at the EMA 89/200 zone — a textbook dynamic resistance rejection.
The key detail: EMA 34 is pulling away below EMA 89, widening the gap. That separation tells me the downtrend is accelerating, not exhausting. If EMA 34 starts flattening and curving back toward EMA 89, that is the first sign of trend exhaustion — but right now, this is still a short-biased setup.
Step 2: Cross-check with Deep Alpha for full context
Navigate to Deep Alpha → search BTC. The header row immediately shows Trend: BEARISH, MTF Alignment: MOSTLY_BEARISH, Confluence: PARTIAL. The embedded chart displays EMA 34/89/200 with exact Entry ($80,021), SL ($81,589), and TP1 ($76,886) levels auto-calculated. This is what saves time — the platform cross-references the EMA stack with SMC zones to generate those levels, not arbitrary numbers.
Look at the AI Signals sidebar: BTC/USDT shows ASI 70 with a BUY signal. That is the Alpha Strength Index disagreeing with the short-term bearish EMA stack. When ASI is high but the EMA ribbon is bearish, I treat it as "not yet" — the accumulation signal is present but the trend has not confirmed a reversal. I wait for EMA 34 to cross back above EMA 89 before flipping to the long side.
Switch to On-Chain and check if whale behavior aligns with the EMA signal. Below, BTC Exchange Netflow is at +$32.7M — capital flowing INTO exchanges, which is a net bearish signal consistent with the bearish EMA stack. If this number were deeply negative (large outflows), I would be cautious about shorting despite the bearish EMAs — smart money accumulating against the trend usually means the trend is about to reverse.
Whether you want to buy Bitcoin, buy Ethereum, or trade altcoins, this indicator helps you time entries on any crypto exchange with data-driven confidence.
Frequently Asked Questions
What EMA periods are best for crypto trading?
CoinXSight uses EMA 34, 89, and 200 on 4H and daily timeframes. These three periods cover short-term momentum, medium-term trend, and long-term macro direction. Using Fibonacci-based periods (34, 89) captures natural market cycles better than round numbers (50, 100).
Is EMA better than SMA for crypto?
For active trading, yes. EMA's recency bias is better suited to crypto's 24/7 markets and high volatility. SMA can still be useful for long-term analysis (200-day SMA as a macro indicator), but EMA is the standard for most crypto trading applications.
What does it mean when price crosses above EMA 200?
Price crossing above EMA 200 is widely considered a macro bullish signal — the asset has transitioned from a downtrend to a potential uptrend. However, a single cross is not enough. Confirm with EMA 89 alignment, volume, and RSI. False breaks above EMA 200 occur frequently during bear market rallies.
How do I use EMA for stop-loss placement?
Place your stop-loss below the EMA that served as support for your entry. If you entered at an EMA 34 bounce, set your stop below EMA 89. If you entered at an EMA 89 bounce, set your stop below EMA 200. This gives the trade room to breathe while defining clear invalidation.
Can I use EMA alone for trading decisions?
EMA tells you the trend direction but not momentum, volume, or institutional positioning. A token can be above all EMAs (bullish trend) but have RSI at 85 (overbought) with declining volume — a setup for a pullback. Always combine EMA with at least one momentum indicator. CoinXSight's Confluence Score automates this multi-factor approach.
JV
Julian Vance
TA // SYSTEMS
Lead Technical Systems Architect·Signals & Metrics Desk
Technical systems developer with a mathematical focus on momentum indicators, volatility metrics (ATR), volume profiles, and multi-timeframe filter models.
QUANTITATIVE SUITE // DEEP ALPHA ENGINEACTIVE
BTC/USDT // LIVE SCANNER
CONFLUENCE 93
LIVE SPOT PRICE$83,908.89STRONG_BUY
TP2
$89,725.68
+6.94%
TP1
$86,233.44
+2.77%
ENTRY
$83,905.28
ZONE
SL
$82,741.19
-1.39%
Auto-detect Order Blocks, Fair Value Gaps and risk-adjusted DCA ladders in < 5s.
Master every cryptocurrency technical analysis indicator with this complete guide. Covers 27 indicators across trend, momentum, volume, volatility, and crypto-native…