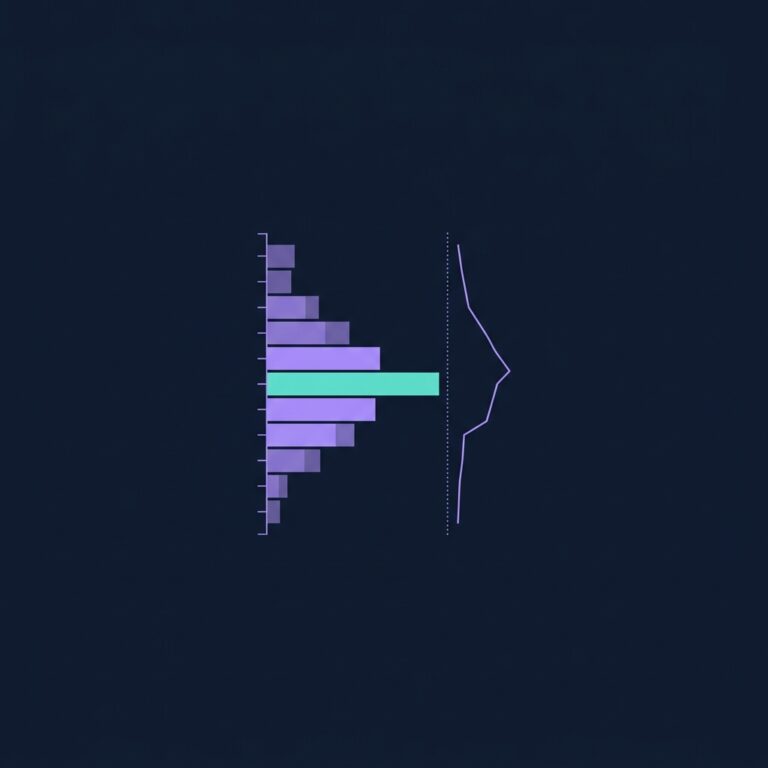
VWAP Trading in Crypto: Institutional Entry Technique
Master VWAP (Volume Weighted Average Price) for crypto trading. Learn how institutions use VWAP for optimal entries, 3 proven VWAP strategies, and how to combine VWAP with CoinXSight's AI signals.
JV
Julian VanceLead Technical Systems Architect·May 19, 2026 · 11 min read · Updated Oct 6
VWAP — Volume Weighted Average Price — is the average price of an asset weighted by trading volume over a specific time period. Unlike simple moving averages (SMA) that treat every price equally, VWAP gives more weight to price levels where more volume was traded.
The formula:
VWAP = Σ (Price × Volume) / Σ (Volume)

For each period:
1. Calculate Typical Price = (High + Low + Close) / 3
2. Multiply by that period's volume
3. Keep a running cumulative total
4. Divide cumulative (Price × Volume) by cumulative Volume
Why VWAP matters: VWAP tells you the "true average" price at which the market transacted. If the current price is above VWAP, buyers have been more aggressive — they paid above the average price, indicating bullish control. If the current price is below VWAP, sellers dominated — they pushed price below the average, indicating bearish control. For a complete overview of all crypto indicators and how they work together, see our Cryptocurrency Technical Analysis Indicators guide.
The institutional perspective: VWAP is the benchmark that institutional traders (hedge funds, market makers, prop desks) use to evaluate their execution quality. An institution that bought BTC below the daily VWAP had "good execution" — they paid less than the average market participant. An institution that bought above VWAP had "poor execution."
This means institutional order flow gravitates toward VWAP. Large buyers wait for price to pull back to VWAP before adding. Large sellers push price down to VWAP before distributing. This creates a powerful dynamic where VWAP acts as a magnet for price — and a launchpad for directional moves.
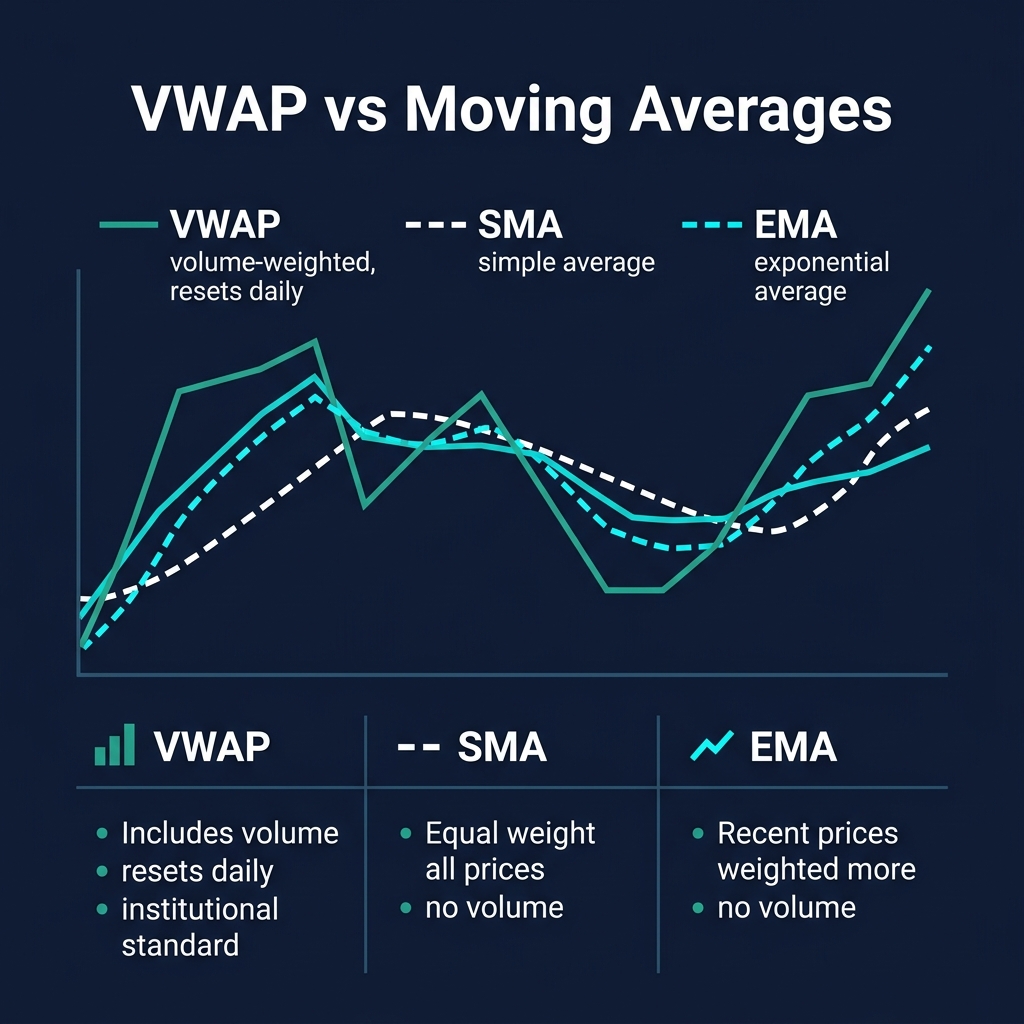
How VWAP Differs from Moving Averages
Understanding what makes VWAP unique helps you use it correctly:
VWAP vs. SMA (Simple Moving Average)
Property
VWAP
SMA
Volume weight
Yes — high-volume levels have more impact
No — all price points equal
Reset period
Resets daily (or per session)
Continuous rolling window
Best for
Intraday trading, execution benchmarking
Trend identification across days/weeks
Institutional use
Primary execution benchmark
Secondary trend filter
VWAP vs. EMA (Exponential Moving Average)
The EMA weights recent prices more heavily, making it responsive to new data. But it still ignores volume entirely. VWAP captures both recency and market participation.
Key difference in practice:
An EMA 20 on a 1H chart might show "support at $105,000" — but if that level had very low volume, it's weak support.
VWAP would show a different level — perhaps $104,500 — where most volume actually traded. This is stronger support because more market participants have a cost basis there.
When VWAP Breaks Down
VWAP has one critical limitation: it resets daily. This makes it primarily useful for intraday and day trading. For swing trading or position trading, use anchored VWAP (set the anchor at a significant event like a swing low, earnings release, or halving) or rely on EMAs for multi-day analysis.
Reading VWAP: The Price-to-VWAP Relationship
Modern crypto analytics platforms integrate these signals with additional data layers — combining trading indicators, on-chain metrics, and AI analysis for higher-probability entries.
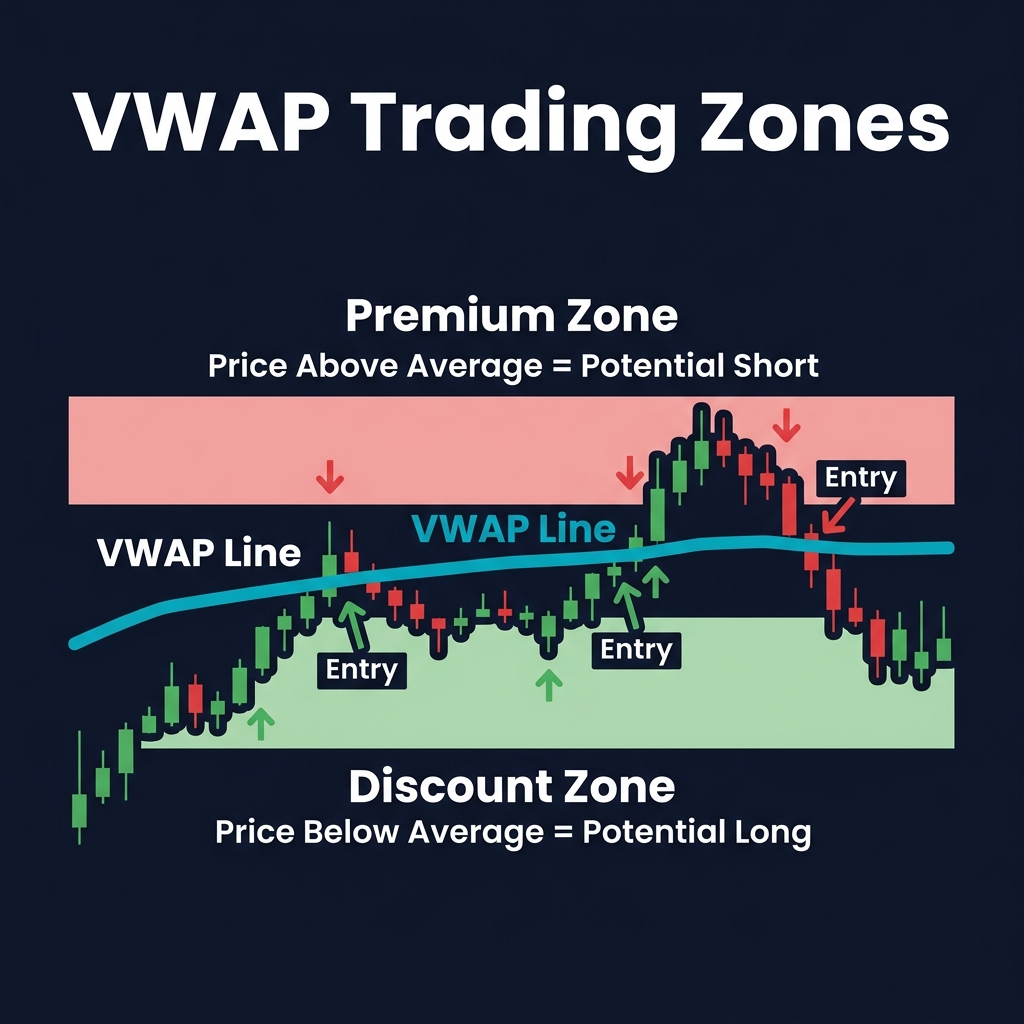
The relationship between the current price and VWAP tells you who controls the market:
Price Above VWAP (Premium Zone)
Buyers paid more than the volume-weighted average → bullish market structure
Price tends to stay above VWAP during uptrends
Pullbacks to VWAP during uptrends are buying opportunities
If price closes below VWAP after being above all day → trend exhaustion warning
Price Below VWAP (Bearish Control)
Sellers dominated, pushing price below the volume-weighted average → bearish market structure
Price tends to stay below VWAP during downtrends
Rallies to VWAP during downtrends are shorting opportunities
If price closes above VWAP after being below all day → trend reversal signal
Price Oscillating Around VWAP (Consolidation)
No clear dominance between buyers and sellers
Market is searching for direction
Wait for a decisive break above or below with volume confirmation
This pattern often precedes breakout moves
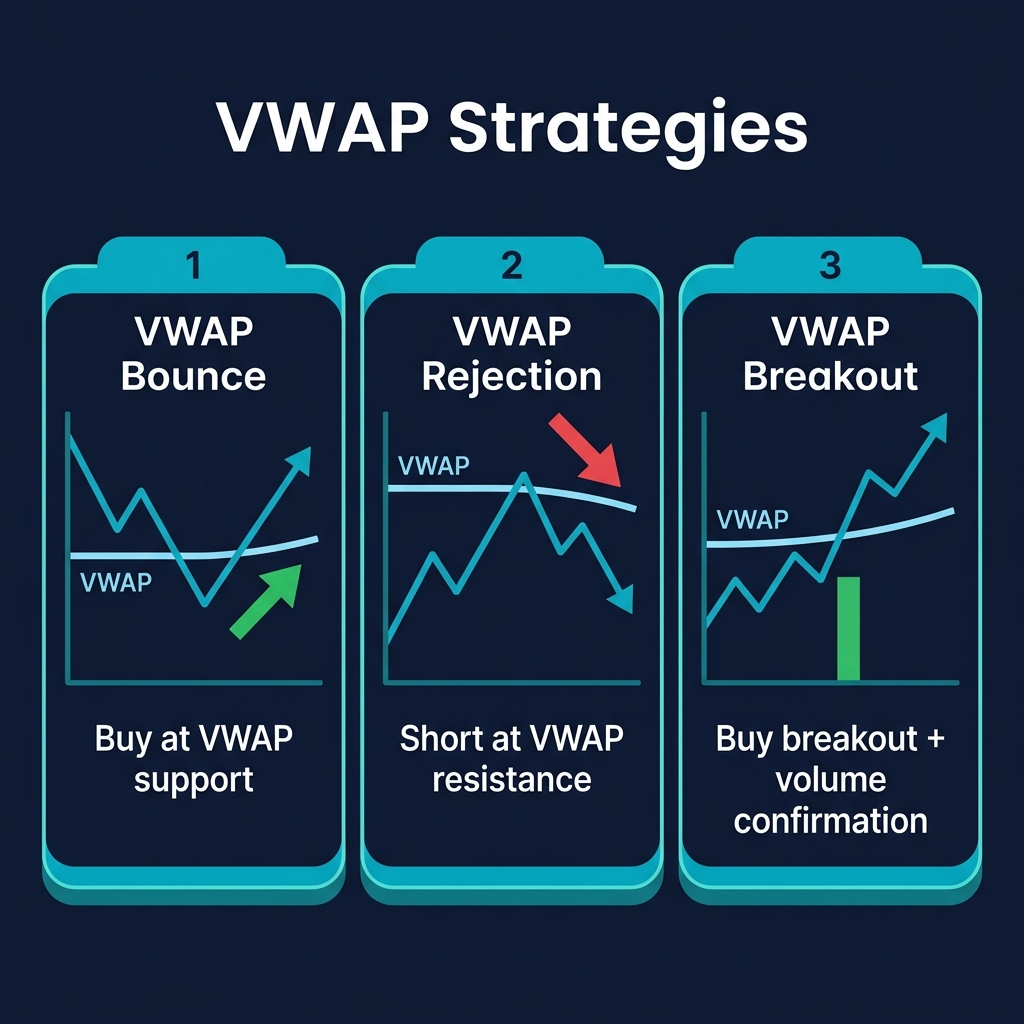
3 Proven VWAP Trading Strategies
Strategy 1: VWAP Bounce (Trend Continuation)
The most reliable VWAP strategy. During a trending day, price tends to pullback to VWAP before continuing in the trend direction.
Setup requirements:
Clear trending day — price opened above (bullish) or below (bearish) VWAP and stayed there
Price pulls back toward VWAP
Price touches or comes within 0.3% of VWAP
A reversal candle forms at VWAP (bullish engulfing for longs, bearish engulfing for shorts)
Entry:
Long: Enter when the reversal candle closes above VWAP with increasing volume
Short: Enter when the reversal candle closes below VWAP with increasing volume
Stop-loss:
Longs: Below VWAP by 0.5%
Shorts: Above VWAP by 0.5%
Target: Previous swing high/low or 1.5:1 risk-reward ratio
Best timeframe: 15M or 1H candles
Win rate: 60-70% on trending days (significantly lower on consolidation days — avoid trading bounces on flat VWAP days)
Strategy 2: VWAP Cross (Intraday Trend Change)
A VWAP cross signals a potential shift in intraday control from buyers to sellers (or vice versa).
Setup requirements:
Price has been consistently above or below VWAP for 2+ hours
Price crosses VWAP with above-average volume
The cross is confirmed by 2 consecutive candle closes on the new side
Bullish cross: Enter long after 2 consecutive closes above VWAP
Bearish cross: Enter short after 2 consecutive closes below VWAP
Stop-loss: Back on the opposite side of VWAP (with 0.3% buffer)
Target: Measured move based on the range from VWAP to the session high/low
Key filter: Reject crosses that occur during low-volume periods (Asian session for BTC, overnight for US-centric altcoins). Low-volume crosses frequently reverse.
Sudden breakout moves price 1%+ away from VWAP in a single candle
Volume on the breakout candle is 2x+ the session average
Entry:
Enter in the breakout direction on the breakout candle close
Do not chase if the move has already exceeded 2% from VWAP without you
Stop-loss: VWAP level (price breaking back to VWAP invalidates the breakout)
Target: 2:1 risk-reward minimum, trail stop at VWAP as it adjusts through the day
Why it works: The VWAP consolidation creates a coiled spring. All the accumulated volume creates a "fair value" consensus. When new information (news, whale trade, technical trigger) breaks the consensus, the participants on the wrong side are forced to exit — amplifying the move.
Advanced VWAP Techniques
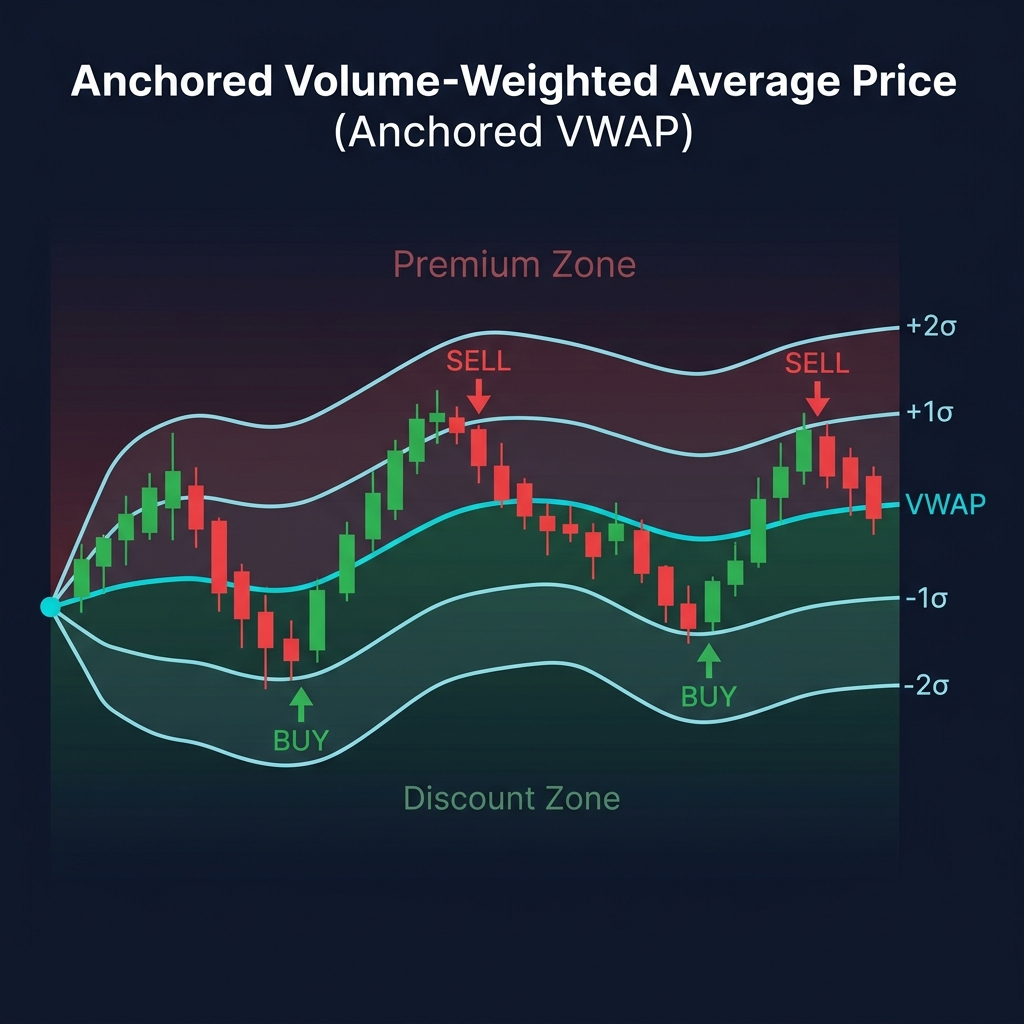
Anchored VWAP
Standard VWAP resets daily. Anchored VWAP lets you set the starting point at any significant event:
Swing low anchor: VWAP calculated from the most recent swing low — shows the average cost basis of all buyers since the bottom
Swing high anchor: Average cost basis of all sellers since the top
Event anchor: Set at a major event (halving, ETF approval, hack) to see the average price since that catalyst
Trading application: If BTC's anchored VWAP from the January 2026 low is at $98,000 and the current price is $106,000, then the average buyer since January is in profit. This makes $98,000 a critical support level — if price approaches it, those buyers will defend their positions.
VWAP Standard Deviation Bands
VWAP with ±1 and ±2 standard deviation bands creates a statistical framework for intraday trading:
Zone
Probability
Trading Implication
Within ±1 SD
~68% of price action occurs here
Normal range — trade reversals at boundaries
Between ±1 and ±2 SD
~27% of price action
Extended — likely mean reversion back to VWAP
Beyond ±2 SD
~5% of price action
Extreme — high probability of reversal OR breakout continuation
Mean reversion trades: When price reaches ±2 SD bands, enter a mean reversion trade back toward VWAP. Stop-loss beyond the ±2 SD band.
Multi-Session VWAP
Using VWAP from the previous session as a reference level for the current session. If price opens above yesterday's closing VWAP, the bias is bullish. If below, bearish. This provides a "session handoff" context that pure price analysis misses.
VWAP + CoinXSight: The Integration
VWAP becomes exponentially more powerful when combined with CoinXSight's AI modules:
VWAP + Alpha Hunter Entry Timing
When Alpha Hunter generates a BUY signal with ASI ≥ 65:
Don't enter immediately
Open Chart Pro and locate the current VWAP level
Wait for a pullback to VWAP (or within 0.5% of VWAP)
Enter at VWAP with your stop-loss below the session low
This improves your average entry by 0.5-2% compared to entering at signal generation
Together creating a zone with 2x the holding power of either alone
These confluence zones are the highest-probability entry and exit points available to intraday traders.
Common VWAP Mistakes
1. Using VWAP on Non-Trending Days
VWAP bounce strategies work on trending days. On ranging/consolidation days, price oscillates around VWAP repeatedly, generating false signals. Before trading VWAP, first determine if the day is trending or ranging.
How to identify: If price has crossed VWAP more than 3 times in the first 2 hours of the session, it's a ranging day — avoid VWAP bounce strategies.
2. Ignoring the Reset
VWAP resets at the start of each trading day (midnight UTC for crypto). The VWAP from yesterday is irrelevant to today's calculation. Don't carry over yesterday's VWAP levels unless you're using anchored VWAP explicitly.
3. Using VWAP on Higher Timeframes Without Anchoring
A daily VWAP line on a weekly chart is meaningless. For timeframes above daily, use anchored VWAP with a meaningful start date, or switch to EMAs which are designed for longer-term analysis.
4. Overcomplicating with Too Many VWAPs
Some traders plot 3-5 anchored VWAPs simultaneously. This creates an unreadable chart. Use a maximum of 2: the daily VWAP and one anchored VWAP from a significant swing point.
5. Entering Before Confirmation
Touching VWAP is not a signal. The signal is the reaction at VWAP — a reversal candle, an Order Flow shift, or a volume spike. Wait for the confirmation before entering.
Whether you want to buy Bitcoin, buy Ethereum, or trade altcoins, this indicator helps you time entries on any crypto exchange with data-driven confidence.
Frequently Asked Questions
Does VWAP work for crypto since markets are 24/7?
Yes, but with a nuance. VWAP resets at midnight UTC for crypto. This means the "session" is the 24-hour period. During periods of very low volume (e.g., 4-8 AM UTC), VWAP can be distorted by thin liquidity. Focus VWAP analysis on high-volume periods (US + European session overlap, 13:00-21:00 UTC).
Is VWAP more useful than EMA for crypto?
For intraday trading (scalping, day trading), VWAP is superior because it incorporates volume and resets daily, providing a fresh "fair price" each session. For swing and position trading, EMAs are more useful because they provide continuous trend context across days and weeks.
What's the best VWAP setting for crypto?
Standard VWAP with a daily reset is the institutional default. No parameters to tune — VWAP is calculated from raw price × volume data. For additional context, add ±1 and ±2 standard deviation bands.
Can I use VWAP for altcoins or just BTC?
VWAP works best on liquid assets. For top-30 tokens by market cap, VWAP is highly reliable. For smaller altcoins with thin volume, VWAP can be manipulated by individual large trades. Focus VWAP analysis on assets with at least $50M daily volume.
How does VWAP compare to Volume Profile?
VWAP gives you a single line (the volume-weighted average). Volume Profile gives you a full distribution of volume at each price level. VWAP is simpler and better for intraday entry timing. Volume Profile is more detailed and better for identifying support/resistance zones across longer periods.
Summary
VWAP is the institutional standard for intraday price benchmarking, and it's one of the most reliable indicators available for crypto day trading. By telling you whether the current price is above or below the volume-weighted average, VWAP instantly shows who's in control — buyers or sellers.
The three core strategies — VWAP Bounce, VWAP Cross, and VWAP Breakout — cover the majority of intraday trading scenarios. Combined with CoinXSight's Alpha Hunter signals for trade selection and Order Flow for execution confirmation, VWAP provides the precision entry layer that separates good trades from great trades.
Key takeaways:
VWAP = average price weighted by volume — the institutional "fair price"
Price above VWAP = buyers in control; below VWAP = sellers in control
VWAP Bounce on trending days is the highest-probability intraday strategy
Always wait for confirmation (reversal candle + volume) before entering at VWAP
Combine with CoinXSight's Order Flow and Alpha Hunter for maximum edge
Lead Technical Systems Architect·Signals & Metrics Desk
Technical systems developer with a mathematical focus on momentum indicators, volatility metrics (ATR), volume profiles, and multi-timeframe filter models.
QUANTITATIVE SUITE // DEEP ALPHA ENGINEACTIVE
BTC/USDT // LIVE SCANNER
CONFLUENCE 77
LIVE SPOT PRICE$83,669.23MODERATE_BUY
TP2
$89,021.25
+7.04%
TP1
$85,510.14
+2.81%
ENTRY
$83,169.41
ZONE
SL
$81,999.04
-1.41%
Auto-detect Order Blocks, Fair Value Gaps and risk-adjusted DCA ladders in < 5s.