Fibonacci Retracement for Crypto: How to Use Fib Levels in Trading
Master Fibonacci retracement levels for crypto trading. Learn how to draw Fib levels correctly, identify key support/resistance zones, and combine Fibonacci with other indicators.
JV
Julian VanceLead Technical Systems Architect·May 17, 2026 · 10 min read · Updated Oct 6
Fibonacci retracement is a technical analysis tool that identifies potential support and resistance levels based on the Fibonacci sequence — a mathematical pattern found throughout nature, architecture, and financial markets. In trading, Fibonacci levels mark the areas where price is most likely to pause, reverse, or consolidate during a pullback within a trend.
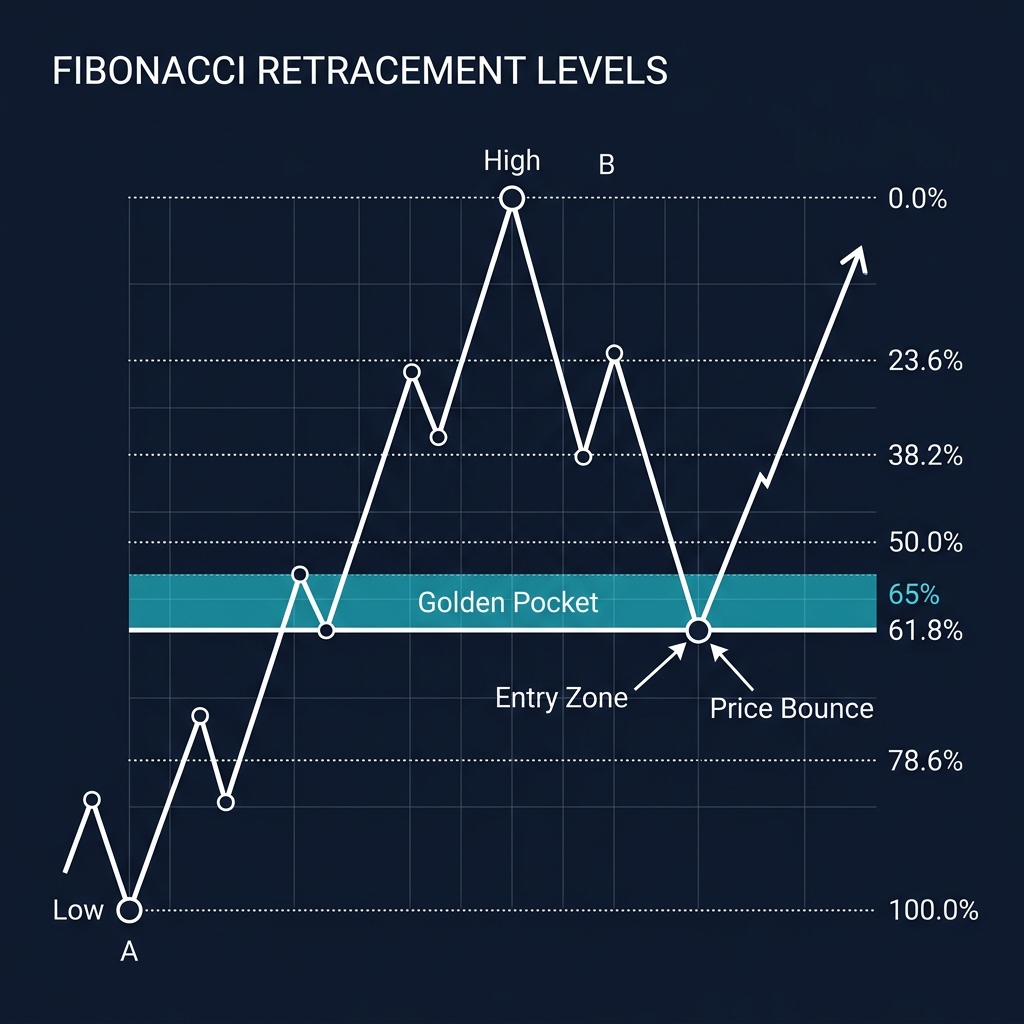
The tool works by measuring the distance between a significant high and low point on a price chart, then dividing that distance by key Fibonacci ratios: 23.6%, 38.2%, 50%, 61.8%, and 78.6%. These levels act as magnets for price action because a large number of traders watch and trade them, creating a self-fulfilling dynamic.
Fibonacci retracement is one of the most widely used tools in crypto trading because crypto markets tend to make sharp directional moves followed by measured pullbacks — exactly the pattern Fibonacci levels are designed to capture. For a complete overview of all crypto indicators and how they work together, see our Cryptocurrency Technical Analysis Indicators guide.
The Key Fibonacci Levels Explained
23.6% — Shallow Retracement
The shallowest pullback level. Price reaching only the 23.6% retracement during a strong trend indicates extreme momentum. If price bounces from 23.6%, the trend is very strong and likely to continue with force.
When it matters: In parabolic runs (common in crypto), price often respects only the 23.6% level before continuing. During Bitcoin's strong bull trends, most pullbacks touch the 23.6% level and immediately resume.
38.2% — Moderate Retracement
A healthy pullback level in a strong trend. Many institutional traders place their buy orders at the 38.2% retracement because it offers a reasonable entry with a clearly defined stop-loss below the 50% level.
When it matters: This is the most common retracement level in trending crypto markets. If you see price pull back to 38.2% and hold, it's a high-probability entry for trend continuation.
50% — The Midpoint
Technically not a Fibonacci number, but included in most Fibonacci tools because of its significance. The 50% retracement is a psychological level that represents the midpoint between the swing high and low. Many traders consider it the "make or break" level — if price holds 50%, the trend is intact. If it breaks, the trend may be weakening.
61.8% — The Golden Ratio
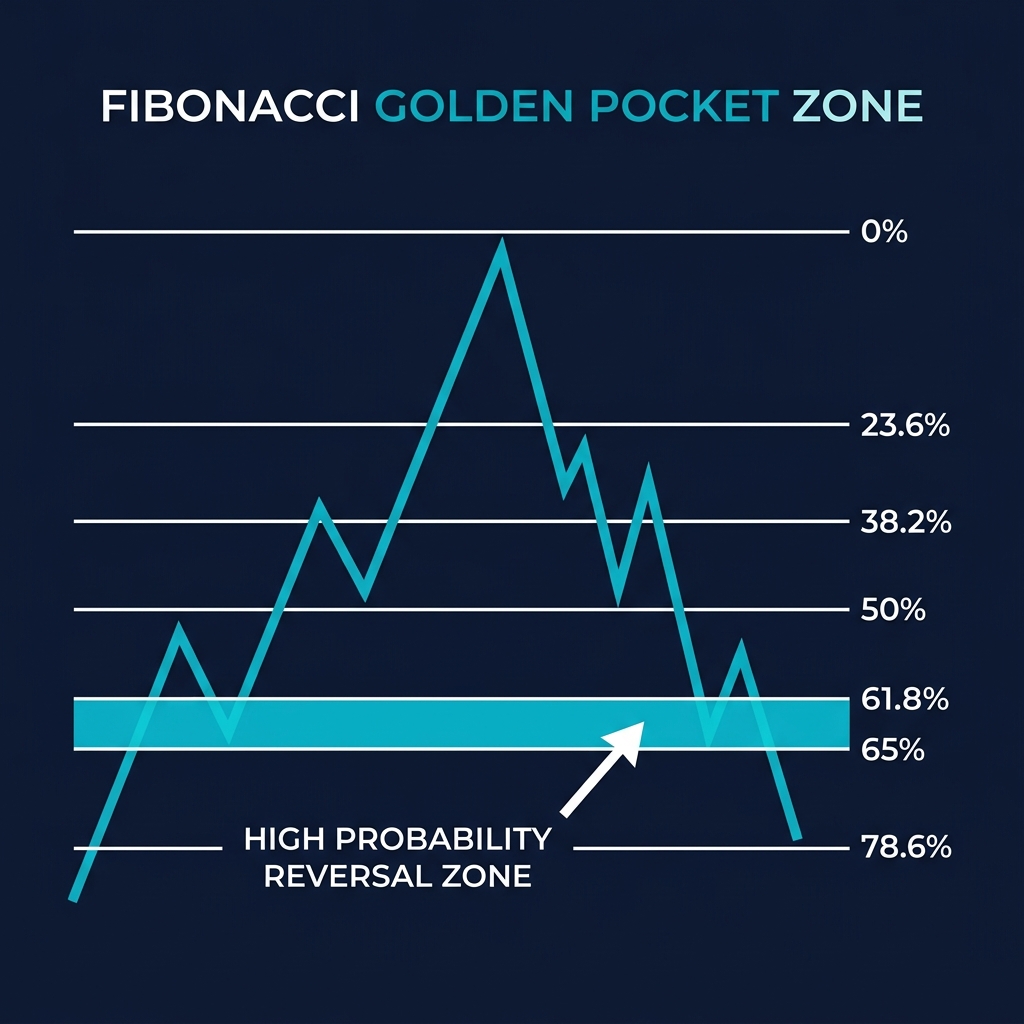
The most important Fibonacci level. The 61.8% ratio (derived from dividing any Fibonacci number by the next number in the sequence) is known as the "golden ratio" and appears repeatedly in nature and markets. In trading, the 61.8% retracement is considered the last line of defense for a trend.
When it matters: Price reaching the 61.8% level and holding is one of the strongest technical reversal signals. If price breaks below 61.8%, the original trend is likely over, and a deeper correction or reversal is probable. This makes 61.8% an ideal level for placing stop-losses on retracement trades.
78.6% — Deep Retracement
The deepest Fibonacci level before a full retracement. Price reaching 78.6% suggests the trend is under significant pressure, but if it holds, the subsequent move can be powerful because most weak hands have already exited.
When it matters: Deep retracements to 78.6% are common in crypto's more volatile periods (alt seasons, post-crash recoveries). They offer high-risk, high-reward entries because the stop-loss is close (below the 100% level) and the potential upside is large.
How to Draw Fibonacci Retracement Correctly
Drawing Fibonacci retracement incorrectly is the most common mistake traders make. The tool is only as good as the anchor points you choose.
For an Uptrend (Measuring a Pullback in a Bull Move)
Identify the most recent significant swing low
Identify the most recent significant swing high
Draw the Fibonacci tool from the swing low to the swing high
The retracement levels will appear between these two points
For a Downtrend (Measuring a Relief Rally in a Bear Move)
Identify the most recent significant swing high
Identify the most recent significant swing low
Draw the Fibonacci tool from the swing high to the swing low
The retracement levels will show potential resistance zones for the relief rally
Rules for Choosing Anchor Points
Use clear, obvious swing highs and lows — not minor fluctuations
Higher timeframes (4H, Daily, Weekly) produce more reliable levels
The swing points should represent a meaningful price move (at least 10-15% in crypto)
If unsure which points to use, zoom out to a higher timeframe for clarity
Fibonacci Trading Strategies for Crypto
Strategy 1: Trend Continuation Entry
This is the most common and reliable Fibonacci strategy. Wait for a strong trending move, then enter on a pullback to a key Fibonacci level.
Setup:
Confirm an uptrend using higher highs and higher lows
Wait for price to pull back
Watch for price to reach the 38.2% or 61.8% Fibonacci level
Look for a bullish confirmation candle (hammer, engulfing, or pin bar) at the Fib level
Enter long with a stop-loss below the next Fibonacci level
Target the previous swing high or use Fibonacci extensions for profit targets
Risk management: Place stop-loss below the 61.8% level if entering at 38.2%, or below the 78.6% level if entering at 61.8%. This gives your trade room to breathe while maintaining a clear invalidation point.
Strategy 2: Fibonacci Confluence Zones
The most powerful Fibonacci setups occur when a Fibonacci level aligns with other technical factors — this is called "confluence." When multiple independent indicators point to the same price level, that level becomes significantly more reliable.
Look for Fibonacci levels that align with:
Horizontal support/resistance from previous price action (S&R Guide)
Previous order block or Fair Value Gap zones (FVG Guide)
CoinXSight's Confluence Scoring System automatically detects when multiple indicators align at the same level, including Fibonacci retracements. This removes the guesswork of manually checking each indicator.
Strategy 3: Fibonacci Extensions for Profit Targets
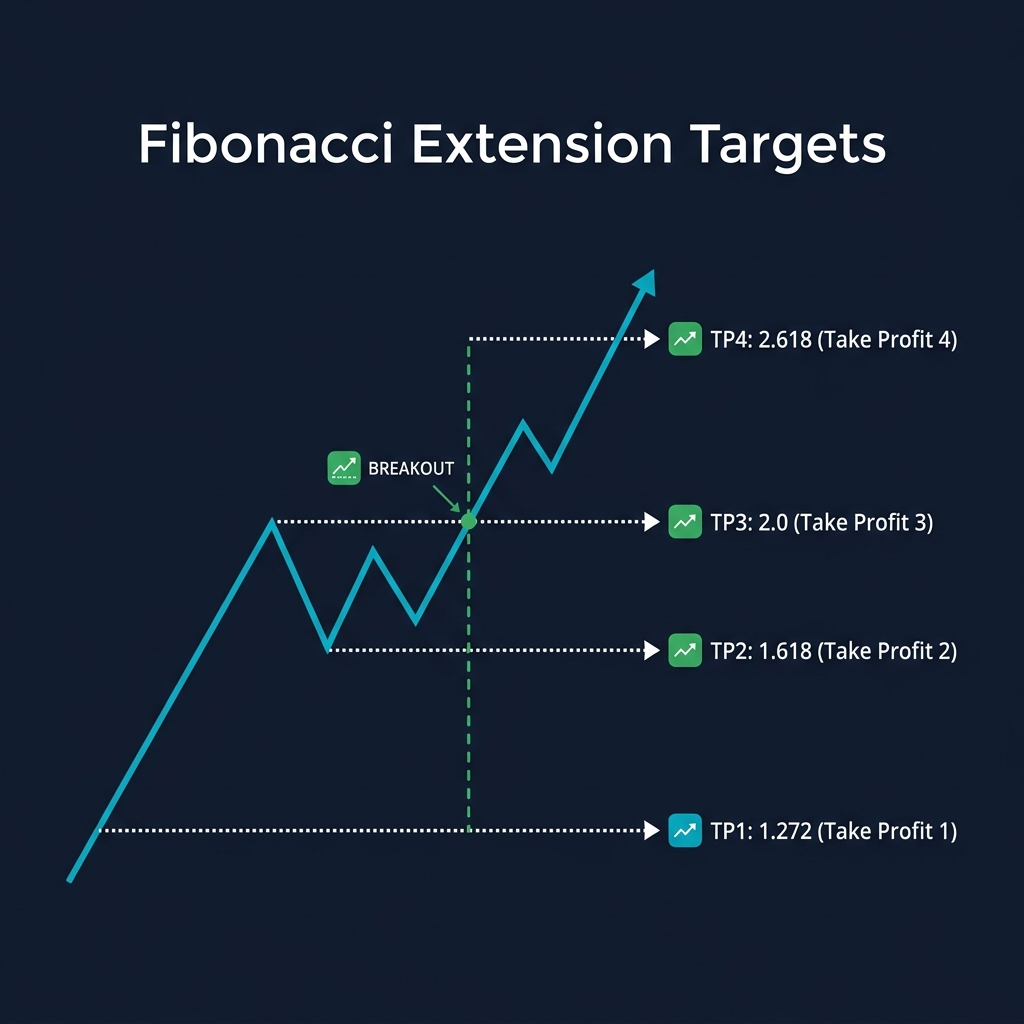
While retracement levels identify pullback entry points, Fibonacci extensions project where price might go after the pullback completes. Common extension levels are 127.2%, 161.8%, and 261.8%.
How to use extensions:
Draw Fibonacci from the swing low to swing high (same as retracement)
The extension levels project above the swing high
Use 127.2% as a conservative profit target
Use 161.8% as a standard profit target
Use 261.8% for extended moves (common in crypto's parabolic runs)
In crypto specifically, the 161.8% and 261.8% extension levels are hit more often than in traditional markets because crypto moves tend to be more explosive. During strong alt-season runs, 261.8% extensions are common.
Combining Fibonacci with CoinXSight's AI
CoinXSight's AI analysis incorporates Fibonacci levels as one component of its multi-layer analysis system. Here's how to use them together:
Note the AI-identified support and resistance zones
Draw your own Fibonacci retracement on the current swing
When the AI's support zone overlaps with a Fibonacci level → high-confidence entry zone
Use the ASI score to confirm overall market sentiment aligns with the trade direction
Using Alpha Hunter with Fibonacci:
The Alpha Hunter may flag a token entering a pullback zone. Cross-reference the Alpha Hunter signal with Fibonacci levels:
If the signal fires at a 38.2% or 61.8% retracement → higher probability trade
If the signal fires at a random price level with no Fibonacci confluence → proceed with more caution
Fibonacci on Multiple Timeframes
Drawing Fibonacci on multiple timeframes reveals nested support/resistance levels that single-timeframe analysis misses.
Workflow:
Weekly chart: Draw Fibonacci on the major trend swing. These levels are the "macro" support/resistance zones.
Daily chart: Draw Fibonacci on the current swing within the weekly trend. These are "intermediate" levels.
4H chart: Draw Fibonacci on the most recent price swing. These are "tactical" entry levels.
The power of overlap: When the Daily 61.8% retracement aligns with the Weekly 38.2% retracement, that price level carries significant weight. These multi-timeframe Fibonacci confluences are among the strongest support/resistance zones in technical analysis.
Choosing minor swing highs/lows instead of significant ones produces unreliable levels. Always use the most obvious, significant swings that any trader looking at the chart would identify.
2. Ignoring the Trend Direction
Fibonacci retracement works best in trending markets. In choppy, range-bound conditions, Fibonacci levels lose their reliability because there's no clear trend to retrace against. If the market is ranging, use horizontal Support and Resistance instead.
3. Trading Every Fibonacci Level
Not every touch of a Fibonacci level is a trade signal. You need confirmation — a reaction at the level (rejection candle, volume spike, indicator divergence). Simply placing a buy order at the 61.8% level without confirmation is gambling, not trading.
4. Not Using Stop-Losses
Because Fibonacci levels are probabilistic, they fail regularly. A Fibonacci trade without a stop-loss is a recipe for significant losses. Always place your stop-loss below the next Fibonacci level as an invalidation point.
Whether you want to buy Bitcoin, buy Ethereum, or trade altcoins, this indicator helps you time entries on any crypto exchange with data-driven confidence.
Frequently Asked Questions
Does Fibonacci actually work or is it just a self-fulfilling prophecy?
Both. Fibonacci levels derive from mathematical ratios that appear in natural systems, which suggests there may be a fundamental reason markets respect them. But they also work because millions of traders worldwide use them, creating clusters of buy and sell orders at the same levels. Whether the cause is mathematical or psychological, the practical result is the same — price reacts at these levels consistently enough to build profitable strategies around them.
Which Fibonacci level is the most reliable?
The 61.8% (golden ratio) is generally the most reliable single level. However, the most profitable Fibonacci trades come from confluence — where a Fibonacci level aligns with other technical indicators. A 38.2% retracement that aligns with a major moving average is more reliable than a standalone 61.8% level.
Should I use Fibonacci on crypto vs stocks?
Fibonacci works on both, but crypto's higher volatility means price will often overshoot Fibonacci levels by 1-3% before reversing. Account for this by placing entries slightly beyond the exact Fibonacci level and using wider stop-losses than you would in stocks.
Can I use Fibonacci for scalping on short timeframes?
Yes, but reliability decreases on timeframes below 1 hour. For scalping, use Fibonacci on 15-minute to 1-hour charts and always require additional confirmation (volume, candlestick pattern, indicator signal) before entering.
How do I know when a Fibonacci level has failed?
If price closes below your Fibonacci level (not just wicks through it) on a significant candle with above-average volume, the level has failed. At that point, look to the next Fibonacci level below as your new potential support zone.
Summary
Fibonacci retracement is a versatile, widely-used tool that identifies high-probability entry points during pullbacks in trending markets. The key levels — 23.6%, 38.2%, 50%, 61.8%, and 78.6% — act as support and resistance zones based on mathematical ratios that markets respect consistently.
The most profitable Fibonacci strategies combine Fib levels with other technical factors (moving averages, horizontal S&R, volume, order blocks) to create confluence zones. CoinXSight's Confluence Scoring System automates this process, flagging when multiple indicators align at the same price level.
Start by mastering the 38.2% and 61.8% levels on daily and 4-hour charts. Once comfortable, expand to multi-timeframe Fibonacci analysis and Fibonacci extensions for profit targeting.
Lead Technical Systems Architect·Signals & Metrics Desk
Technical systems developer with a mathematical focus on momentum indicators, volatility metrics (ATR), volume profiles, and multi-timeframe filter models.
QUANTITATIVE SUITE // DEEP ALPHA ENGINEACTIVE
BTC/USDT // LIVE SCANNER
CONFLUENCE 93
LIVE SPOT PRICE$83,908.89STRONG_BUY
TP2
$89,725.68
+6.94%
TP1
$86,233.44
+2.77%
ENTRY
$83,905.28
ZONE
SL
$82,741.19
-1.39%
Auto-detect Order Blocks, Fair Value Gaps and risk-adjusted DCA ladders in < 5s.
Master multi-timeframe analysis for crypto trading. Learn the 3-timeframe rule, top-down analysis flow, timeframe alignment signals, and how to combine…
Master every cryptocurrency technical analysis indicator with this complete guide. Covers 27 indicators across trend, momentum, volume, volatility, and crypto-native…