Day Trading Crypto with AI: Intraday Strategies That Actually Work
Master crypto day trading using AI-powered tools for market regime detection, intraday signal filtering, and 1H order flow analysis. Step-by-step strategies with CoinXSight screenshots.
MC
Marcus ChenSenior Quantitative Strategist·May 17, 2026 · 14 min read · Updated Oct 6
Day Trading vs. Swing Trading: Choosing Your Battlefield
Day trading and swing trading are complementary strategies — but they demand fundamentally different skill sets, tools, and psychological profiles.
Dimension
Day Trading
Swing Trading
Hold time
Minutes to hours (same session)
Days to weeks
Screen time
2-6 hours of active monitoring
15-30 minutes daily
Primary timeframe
1H and 15M charts
4H and 1D charts
Volatility requirement
Needs intraday volatility
Works in trending markets
Psychological pressure
Very high — fast decisions
Moderate — planned entries
Capital efficiency
Higher (faster capital rotation)
Lower (capital locked for days)
Why day trade crypto specifically? Crypto's 24/7 market and extreme intraday volatility create opportunities that simply don't exist in traditional markets. A typical day in BTC can produce 2-5% intraday swings — moves that would take weeks in the S&P 500. AI tools like CoinXSight's Alpha Hunter and Order Flow analysis make it possible to systematically exploit these moves instead of guessing.
This guide provides a complete day trading framework using CoinXSight's modules. If you prefer holding positions for days, see the Swing Trading Strategy Guide instead.
Step 1: Pre-Session Market Regime Check
Before placing any intraday trade, you must understand the current market environment. Trading a trend-following scalp strategy in a choppy, directionless market is the fastest way to bleed capital through false breakouts.
AI Terminal: Your Pre-Market Dashboard
The AI Terminal provides instant macro context across multiple dimensions. Here's how to read it for day trading:
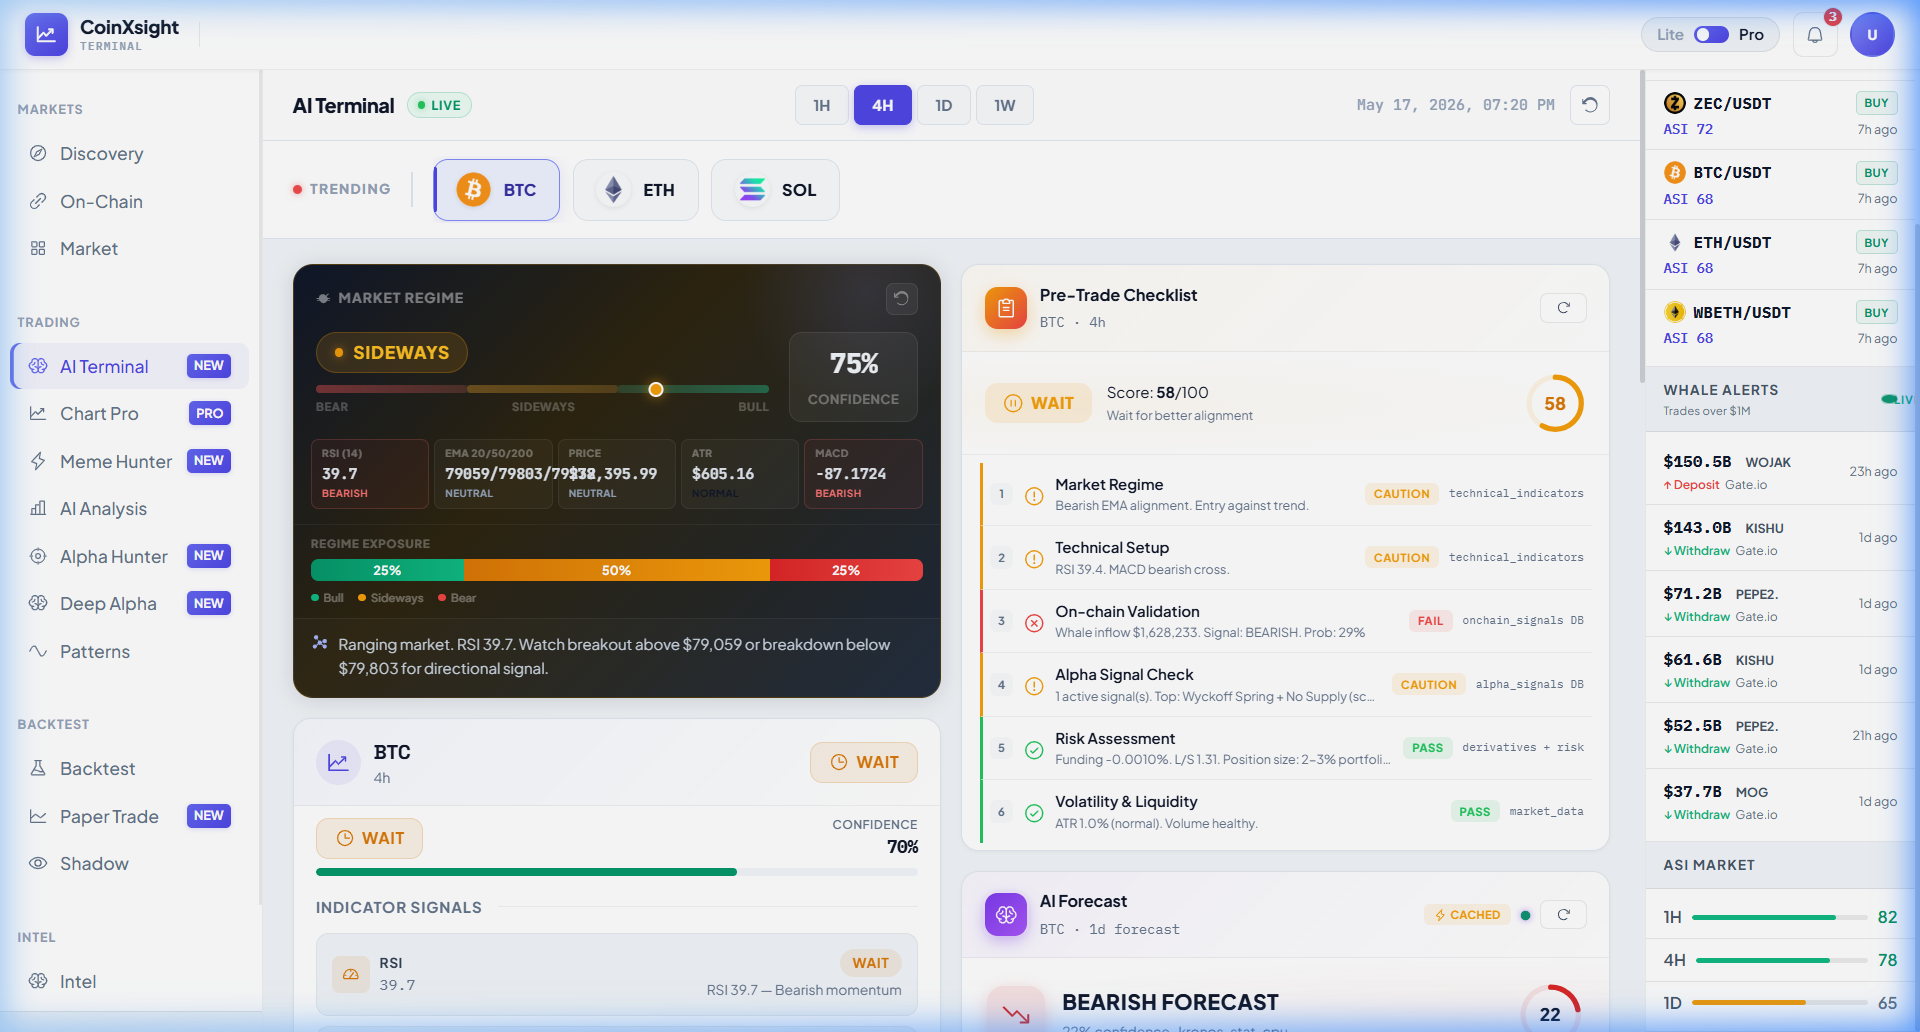
Market Regime Panel (center):
The regime indicator reads SIDEWAYS with 75% confidence. For day traders, this means:
Breakout strategies will produce frequent false signals — avoid them
Mean-reversion strategies are appropriate (fade rallies to resistance, buy dips to support)
Tighten your profit targets — in sideways markets, moves exhaust faster
Pre-Trade Checklist (Score: 58/100 → WAIT):
The checklist breaks down the current setup across four dimensions:
Market Regime: Caution — no clear directional edge
Risk/Volatility: Pass — volatility is within normal bounds
A Pre-Trade score below 60 means conditions are suboptimal. Day trading during suboptimal conditions requires:
Reducing position sizes by 50%
Only trading A+ setups (no B or C trades)
Setting tighter stop-losses (reducing max loss per trade)
ASI Market Sidebar (multi-timeframe):
The sidebar shows ASI scores across timeframes — 1H: 82, 4H: 78, 1D: 65. For day trading, the 1H reading is your primary signal. An ASI of 82 on the 1H indicates strong short-term bullish momentum, even within a sideways macro regime. This creates a tactical opportunity: bullish intraday scalps with tight targets.
Day Trading Regime Rules
Regime
Approach
Position Size
Max Trades/Day
Strong Trend (Bull/Bear 80%+)
Trend-following: breakouts, pullback entries
100% standard
5-8
Moderate Trend (60-79%)
Selective trend-following with tight stops
75% standard
3-5
Sideways (50%+ confidence)
Mean-reversion: fade extremes, S/R bounces
50% standard
2-3
Regime Uncertain (<50% all)
Cash — no day trading
0%
0
Your Rule: Check the AI Terminal within 5 minutes of starting your trading session. If regime is uncertain, do not trade.
Step 2: Finding Intraday Opportunities with Alpha Hunter
Modern crypto analytics platforms integrate these signals with additional data layers — combining trading indicators, on-chain metrics, and AI analysis for higher-probability entries.
While swing traders can wait days for setups to develop, day traders need signals that will play out within hours. CoinXSight's Alpha Hunter provides filtered, AI-validated signals with built-in entry/exit levels.
Alpha Hunter on the 1H Timeframe
For day trading, switch Alpha Hunter to the 1H timeframe tab. This surfaces signals based on 1-hour chart patterns — ideal for intraday entries.
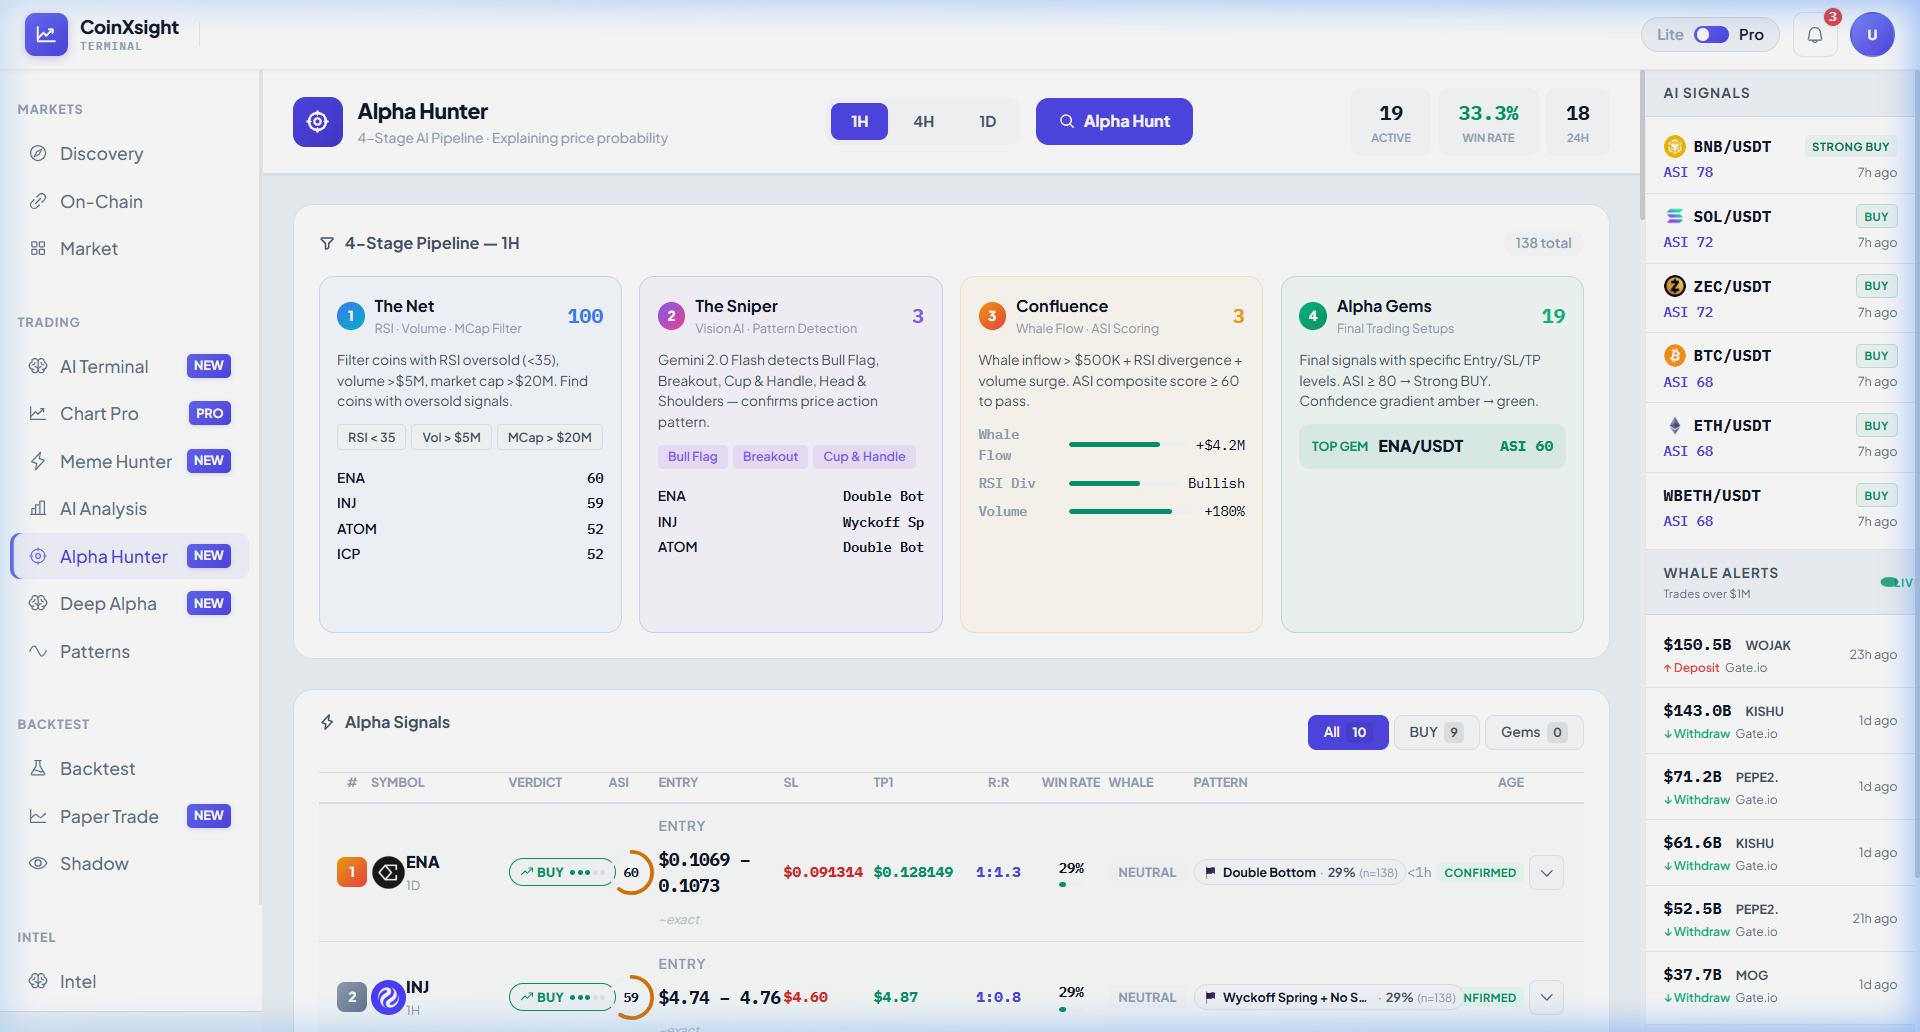
Current 1H signals (live data):
INJ — BUY, ASI 59: Wyckoff Spring + No Supply pattern detected on 1H. Confirmed <1 hour ago. This is the type of signal day traders look for — a short-term pattern that should play out within 4-12 hours.
ENA — BUY, ASI 60: Double Bottom pattern on 1D. This is more suited for swing trading (1D timeframe) but can inform intraday bias.
Day Trading Signal Filters:
Timeframe: Only use 1H signals for day trading (4H and 1D are for swing)
Freshness: Signal must be <2 hours old — stale signals have already moved
ASI minimum: 55+ for day trades (lower threshold than swing trading's 65+, because intraday moves require less conviction)
Pattern type: Prioritize Wyckoff Spring, Bull Flag, and Breakout patterns for intraday — they have the fastest resolution times
Building a Day Trading Watchlist
From each morning's Alpha Hunter scan:
Filter for 1H signals with ASI ≥55
Check that the pattern was confirmed within the last 2 hours
Verify the token has sufficient liquidity (>$10M daily volume) for clean execution
Add maximum 3-5 candidates to your intraday watchlist
Rank by ASI score — trade the highest-conviction signal first
Step 3: Deep Alpha Confluence Validation
Every Alpha Hunter signal needs a second opinion before risking capital. CoinXSight's Deep Alpha module provides multi-layer analysis to confirm or reject each candidate.
ETH Deep Alpha: Confluence Score Breakdown
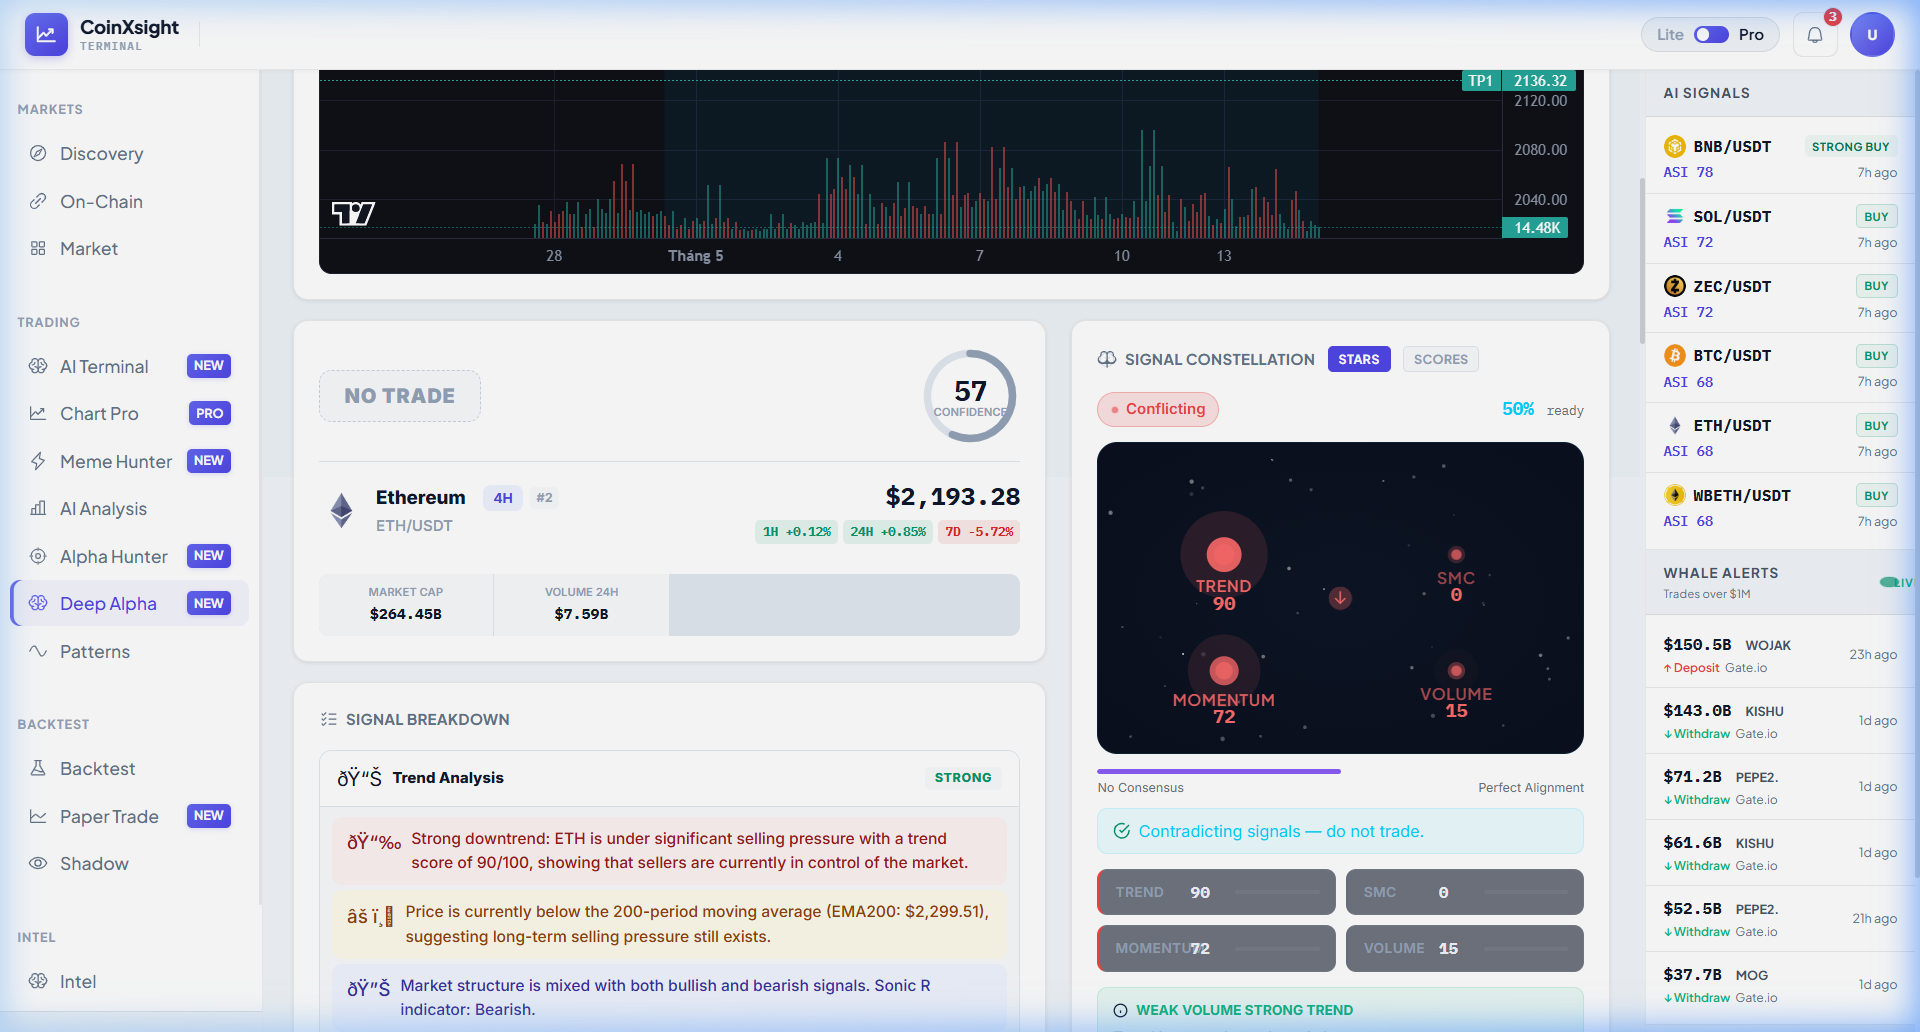
This is a textbook example of why validation matters. The Deep Alpha analysis of ETH shows:
Confluence Score: 57 → NO TRADE
Even though Trend scores 90/100 (strongly bullish) and Momentum scores 72/100 (positive), two critical layers are weak:
SMC: 0/100 — No Smart Money Concepts (order blocks, FVGs) supporting this setup. The institutional footprint is absent.
Volume: 15/100 — Volume is extremely weak. A bullish trend with no volume behind it is a bull trap waiting to happen.
What this means for day trading: Skip ETH today. A 57 Confluence Score with one layer at 0/100 means there's a structural weakness in the setup. For day trading, where you need precision and speed, trading against structural weakness leads to fast losses.
The 4-Layer Filter for Day Trades:
No layer can be below 15/100 (any zero = automatic reject)
Overall Confluence must be ≥60 for longs, ≤40 for shorts
The Trend layer must agree with your trade direction (Trend 90 + Long = OK; Trend 90 + Short = reject)
Using the Built-in Trading Plan
When the Confluence Score does qualify, Deep Alpha provides automated trading levels visible on the chart:
Entry: The AI-recommended entry zone
Stop-Loss: Below the pattern invalidation point
Take-Profit targets: TP1 (conservative) and TP2 (aggressive)
These levels are derived from the AI Analysis engine and are calibrated for the selected timeframe. For day trading, use TP1 as your primary target — don't get greedy on intraday moves.
Step 4: Chart Pro — Reading Order Flow for Precision Entry
The biggest difference between mediocre and excellent day traders is entry precision. A 0.5% better entry on a 2% profit target increases your R:R by 50%. CoinXSight's Chart Pro provides the tools for precision timing.
Order Flow Analysis: The Day Trader's Edge
Chart Pro combines traditional technical analysis with real-time order flow data. Here's how to read it for day trading:
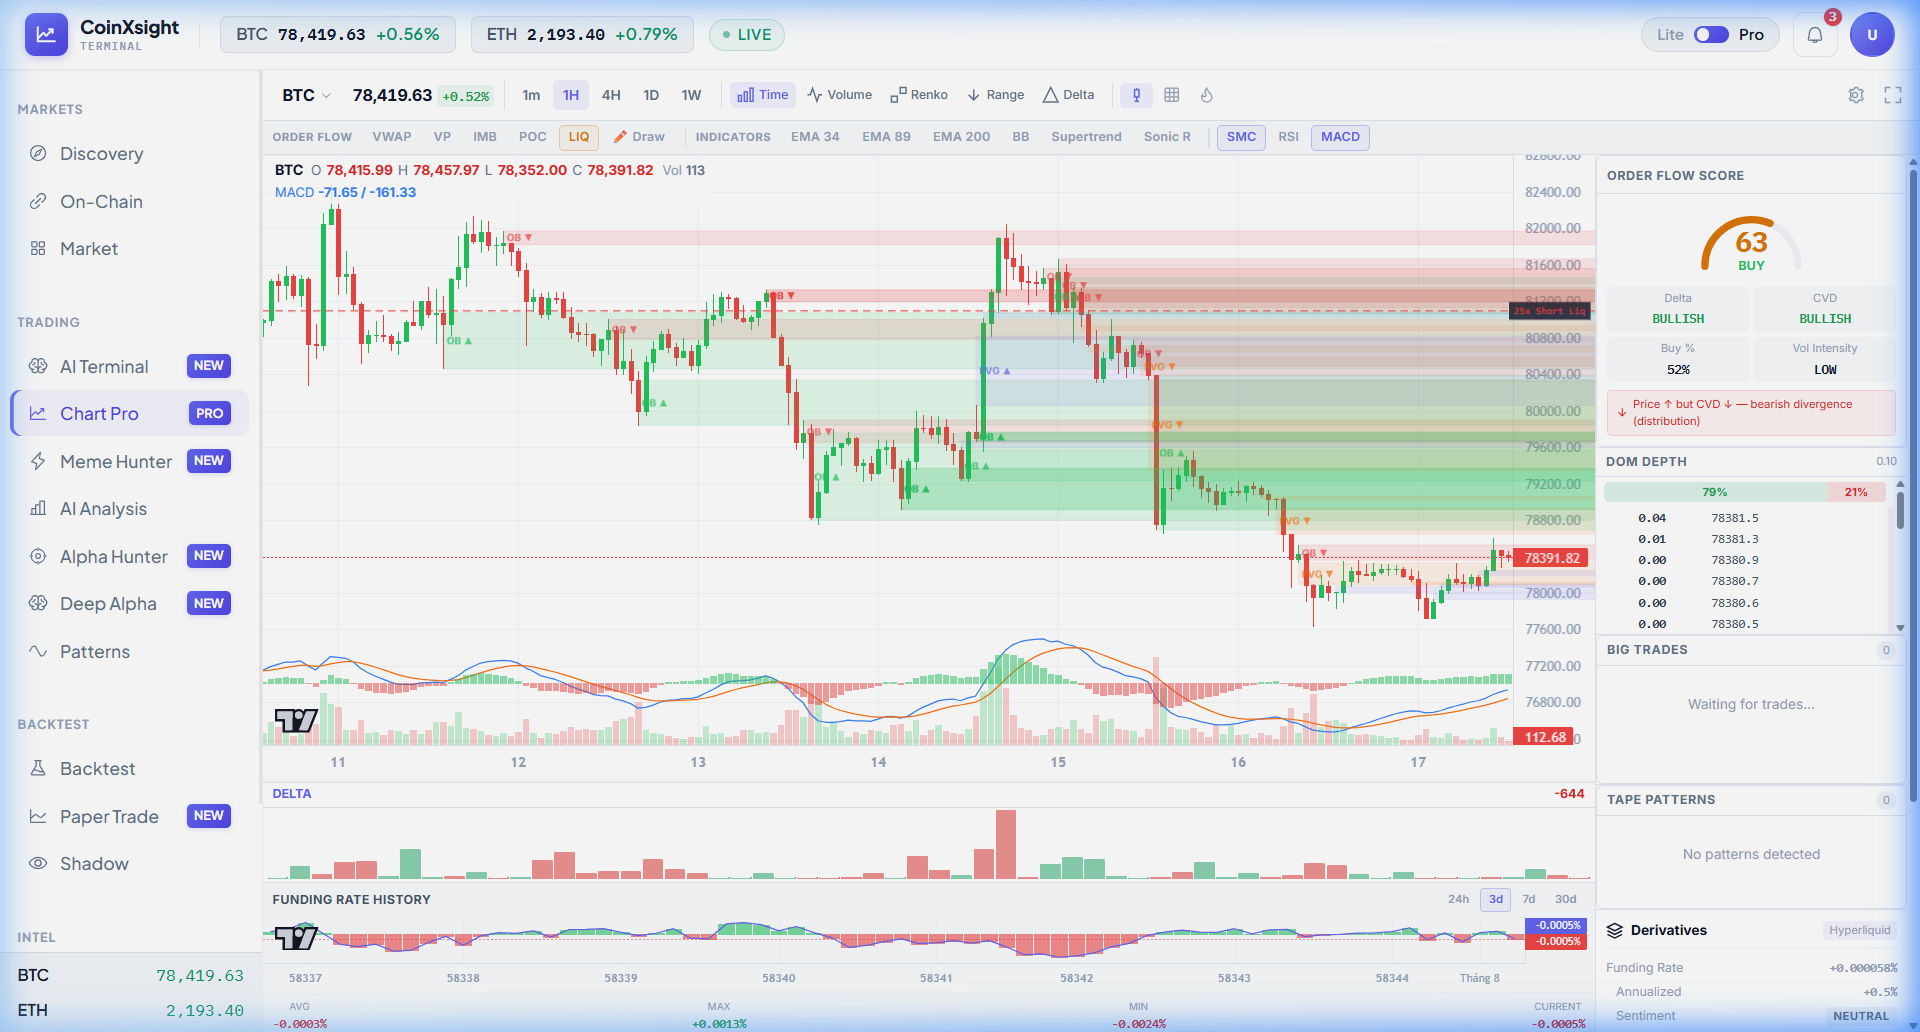
Order Flow Score: 63 → BUY
The Order Flow Score aggregates multiple real-time metrics into a single directional signal:
Metric
Current Reading
What It Tells You
Delta
Bullish
More market buys than market sells at the current price level
CVD (Cumulative Volume Delta)
Bullish
Buying pressure has been dominating over the recent period
Buy/Sell Ratio
52% Buy / 48% Sell
Slight buyer advantage — not extreme
Volume Intensity
Low
The buying is real but not aggressive — expect a gradual move, not a spike
DOM Depth
Visible levels
Shows where large limit orders are stacked above and below current price
Interpreting the current BTC 1H setup:
Order Flow is bullish (63 BUY) → short-term buyers are in control
Volume Intensity is Low → the move will be gradual, not explosive
Chart shows price within a Liquidation Level (LIQ) band → liquidity clusters above and below could trigger stop hunts
MACD panel below shows momentum — look for histogram bars growing in the direction of your trade
Day Trading Entry Technique:
Wait for a pullback to the nearest EMA 34 or SMC Order Block zone
Confirm Order Flow is still bullish (Delta and CVD green) during the pullback
Enter when price touches the support zone AND Order Flow Score remains above 55
Stop-loss below the Order Block or below EMA 89 (whichever is closer)
Take-profit at the next resistance level or LIQ band
💡 Day Trading Pro Tip: Low Volume Intensity + Bullish Delta is a "stealth accumulation" signal. The price is being pushed up gradually by informed buyers, not by a FOMO spike. These moves tend to be more sustainable — ideal for intraday holds of 2-6 hours.
Step 5: Intraday Risk Management — The Survival Rules
Day trading amplifies both gains and losses. Without rigid risk rules, a single bad session can erase a week of profits.
The 0.5-1% Rule (Tighter Than Swing)
Day trades use tighter risk per trade than swing trading because you're taking more trades per day:
Parameter
Day Trading
Swing Trading
Risk per trade
0.5-1% of account
1-2% of account
Max daily loss
2% of account (hard stop)
N/A
Max open positions
2-3 simultaneous
3-5 simultaneous
Stop-loss width
0.5-2% from entry
2-5% from entry
Profit target
1-3% from entry
5-15% from entry
Position Sizing Example
$10,000 account, 0.5% risk per trade:
Maximum risk: $50 per trade
BTC entry: $103,500
Stop-loss: $103,000 (0.48% below entry — $500 risk per BTC)
This means you're trading approximately 0.1 BTC per trade
The 2% Daily Hard Stop
This is non-negotiable. If you lose 2% of your account in a single trading session, stop trading for the rest of the day. Do not try to "make it back" — revenge trading is the #1 account killer in day trading.
Implementation:
Start each session by calculating your daily loss limit: Account × 2%
Track cumulative realized losses during the session
When cumulative loss hits the limit, close all positions and close your laptop
Resume the next trading day with a fresh mindset
Overtrading Prevention
Day trading creates a psychological urge to "always be in a trade." Counter this with strict trade limits:
Regime
Max Trades/Day
Rationale
Strong Trend
5-8
More opportunities in clear direction
Moderate Trend
3-5
Selective — only A-grade setups
Sideways
2-3
Minimum trades, maximum selectivity
Uncertain
0
Cash is a position
Step 6: The Complete Day Trading Session Checklist
Pre-Session (5 minutes — before first trade)
[ ] Open AI Terminal → Record market regime and confidence level
[ ] Check Pre-Trade Checklist score → If <50, do not trade
[ ] Note 1H ASI score → This is your intraday directional bias
[ ] Calculate today's 2% daily loss limit
[ ] Set broker alerts for your loss limit
Signal Discovery (10 minutes)
[ ] Open Alpha Hunter → Switch to 1H tab
[ ] Filter for signals confirmed within last 2 hours
[ ] Check ASI ≥55 and volume >$10M for each candidate
[ ] Add top 3-5 candidates to watchlist
Per-Trade Analysis (3 minutes per candidate)
[ ] Run Deep Alpha → Confirm Confluence Score ≥60
[ ] Check no layer below 15/100 (automatic reject)
[ ] Note Entry/SL/TP levels from the chart
[ ] Calculate position size (0.5-1% risk)
Execution
[ ] Open Chart Pro → Load the token on 1H
[ ] Check Order Flow Score → Must be ≥55 in trade direction
[ ] Wait for pullback to EMA 34 or Order Block
[ ] Enter with limit order at AI-recommended entry
[ ] Set SL immediately (no exceptions)
[ ] Set TP at Deep Alpha's TP1 level
Active Management (during trades)
[ ] Monitor Order Flow Score every 30 minutes → If it flips against your direction, tighten SL
[ ] If TP1 hit → Close 70% of position, move SL to breakeven for remaining 30%
[ ] Track cumulative P&L → If daily loss hits 2%, stop immediately
End-of-Session (5 minutes)
[ ] Close all remaining positions (day traders do not hold overnight)
[ ] Log every trade: entry reason, ASI at entry, Order Flow at entry, result
[ ] Calculate session P&L and win rate
[ ] Note any pattern changes for tomorrow's session
3 Day Trading Strategies for Different Market Regimes
Strategy 1: Trend Scalping (For Trending Markets)
When to use: AI Terminal shows Strong Trend (80%+ Bull or Bear)
Rules:
Trade ONLY in the trend direction (long in bull trend, short in bear trend)
Entry: Price pulls back to EMA 21 on 1H + Order Flow still directional
Stop-loss: Below EMA 34 (1H)
Target: Previous swing high (TP1), then trailing stop (TP2)
Expected duration: 1-4 hours
Success rate (from backtesting): 62-68% win rate with 2:1 R:R in trending markets.
Strategy 2: S/R Fade (For Sideways Markets)
When to use: AI Terminal shows Sideways (75%+ confidence)
Rules:
Sell at resistance zone (identified by Deep Alpha key levels) when Order Flow shows exhaustion (Score <45)
Buy at support zone when Order Flow shows accumulation (Score >55)
Stop-loss: Beyond the S/R zone by 0.5%
Target: Mid-range (the average between support and resistance)
Expected duration: 2-6 hours
Success rate: 55-62% win rate with 1.5:1 R:R in sideways markets.
Strategy 3: Momentum Burst (For News Events)
When to use: Sudden ASI spike (>10 points in 30 minutes) on 1H timeframe
Rules:
Wait for the initial spike to establish a direction (do not chase the first candle)
Enter on the first pullback after the spike, when Order Flow confirms continuation
Stop-loss: Below the pullback low (tight — these are fast moves)
Target: Fibonacci extension of the initial spike
Expected duration: 30 minutes to 2 hours
Success rate: 50-58% win rate but with 3:1+ R:R — the wins are large.
Backtesting Intraday Strategies
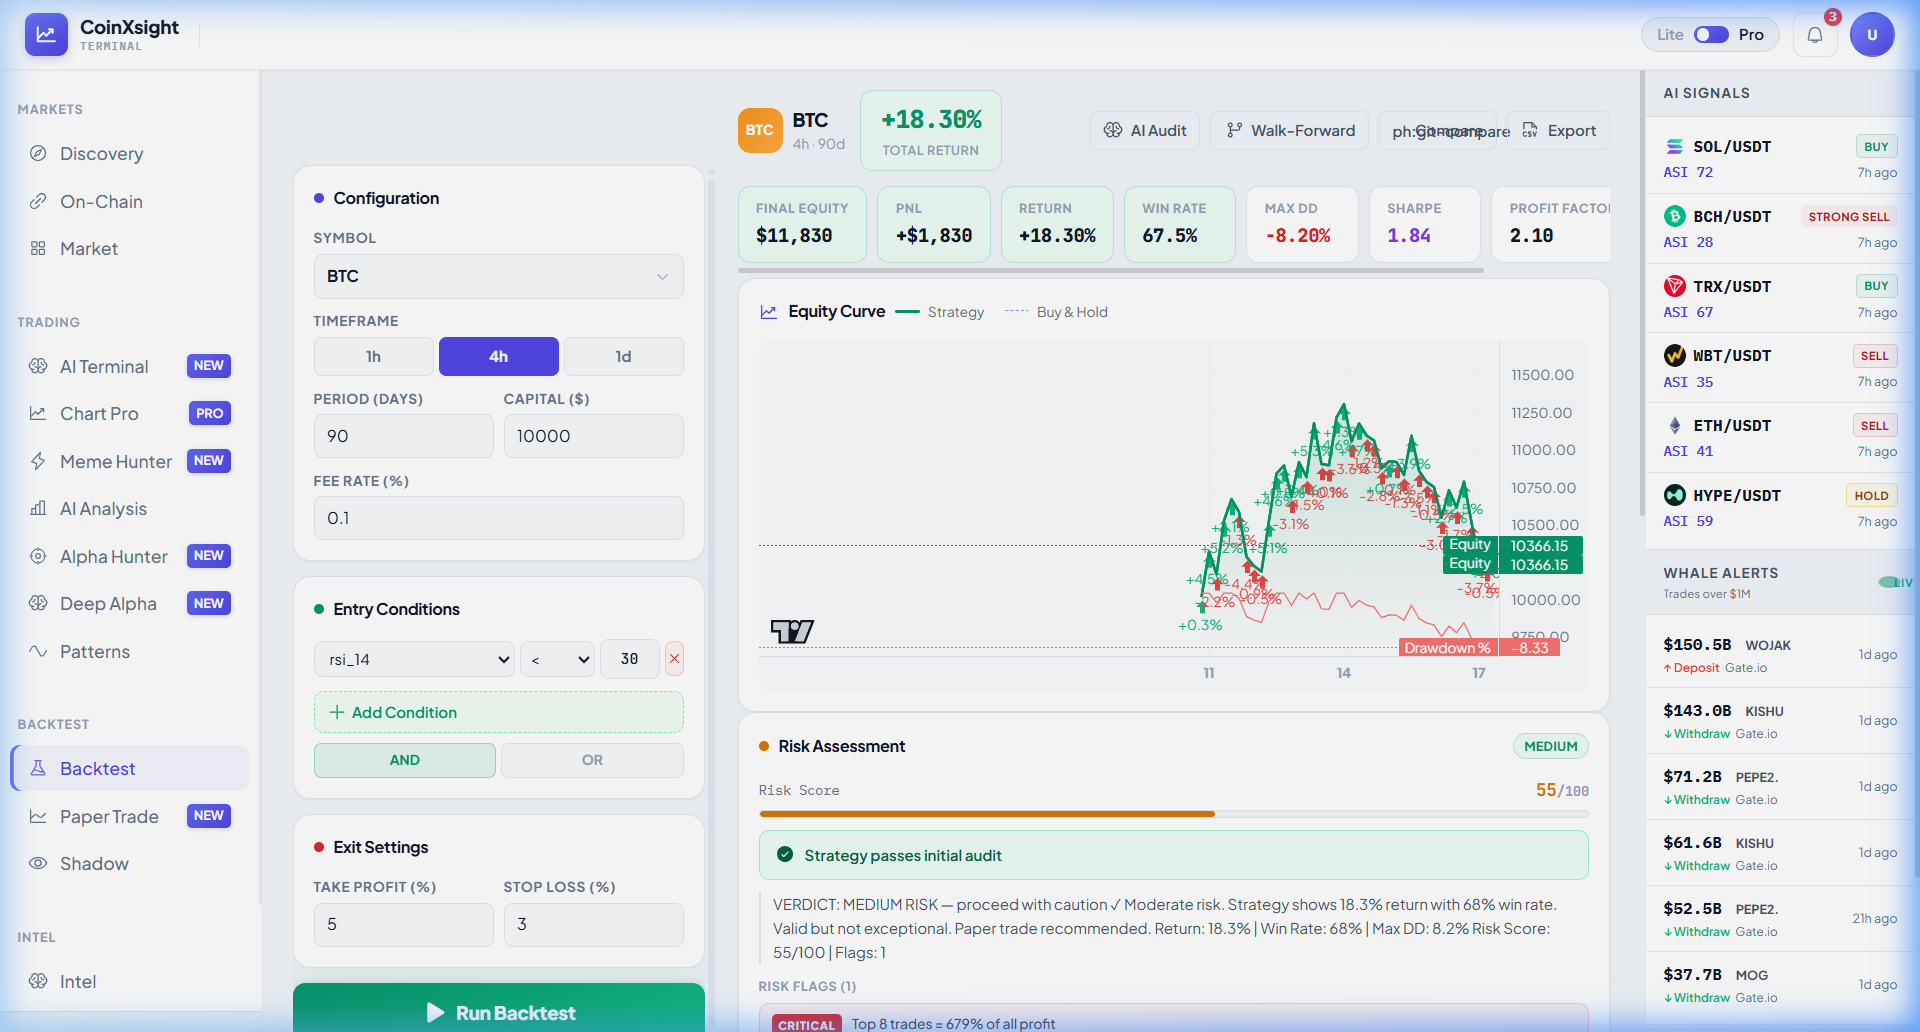
Every strategy must be validated through backtesting before risking real capital. CoinXSight's Backtest module supports 1H and 4H timeframes suitable for intraday strategy validation.
What the AI Risk Audit Reveals
CoinXSight's backtest includes an AI Risk Audit that many platforms lack. The audit for this RSI-based strategy reveals:
Risk Score: 55/100 → MEDIUM RISK — The strategy is profitable but has structural vulnerabilities
Critical Warning: "Top 8 trades = 679% of all profit" — This means the strategy's returns are concentrated in a few large winners. If you miss those 8 trades, the strategy is essentially flat. This is a common problem in trend-following strategies.
What this means for day traders: A strategy where 8 trades generate 679% of total profit is fragile. You must take EVERY signal — skipping trades because you're "busy" or "don't feel confident" will likely cause you to miss the big winners that make the strategy work.
Optimization path for day trading:
Start with the RSI < 38 baseline (proven +18.30% over 90 days)
Add an Order Flow filter → Only enter when Order Flow Score >55 in trade direction
Add EMA trend filter → Only trade in direction of EMA 89 slope
Re-backtest each addition → Keep changes that improve win rate OR reduce drawdown
Day Trading Psychology: The Mental Game
Day trading is 60% skill, 40% psychology. The speed and intensity of intraday trading creates unique psychological challenges:
The 3 Psychological Traps
1. Revenge Trading
After a loss, the urge to "win it back immediately" is powerful. This leads to oversized positions, ignored stop-losses, and emotional decisions. The 2% daily hard stop is your protection against this.
2. Overconfidence After Wins
Three consecutive wins can make you feel invincible. You start taking B and C grade setups. Suddenly, the quality of your trades deteriorates while your position sizes increase. Stick to your checklist regardless of recent results.
3. Analysis Paralysis
Too many indicators, too many confirmations, too much analysis = missed entries. Day trading requires decisiveness. Your pre-session checklist gives you 3-5 candidates. When a candidate hits your entry criteria, execute. The CoinXSight modules have already done the analysis — trust the system.
Is day trading more profitable than swing trading?
Not inherently. Day trading has higher capital efficiency (faster rotation) but also higher costs (more commissions, tighter spreads matter). The best approach depends on your personality, available time, and risk tolerance. Many successful traders do both — swing trading for core positions and day trading for tactical opportunities.
How much capital do I need for crypto day trading?
Minimum $5,000 for effective position sizing with the 0.5-1% risk rule. Below $5,000, your position sizes become too small to generate meaningful returns after fees. $10,000-$25,000 is the optimal range for part-time day traders.
Should I use leverage for day trading?
Only if experienced. Leverage amplifies the speed of losses — a 1% adverse move with 10x leverage is a 10% account loss. If you use leverage, reduce your risk per trade proportionally (e.g., 3x leverage → 0.33% risk per trade instead of 1%). Never exceed 5x leverage for day trading.
What's the best time of day to day trade crypto?
The highest-volume periods are during US market open (9:30 AM EST) and the Asian/European session overlap (8:00-12:00 UTC). Higher volume means tighter spreads, more reliable patterns, and less slippage. Avoid low-volume weekend periods.
How do I avoid overtrading?
Set a maximum trade count per day based on the market regime (see table above). Track every trade in your journal. Review weekly — if your win rate on trades #4+ is significantly lower than trades #1-3, you're overtrading.
How long does it take to become profitable at day trading?
Most traders need 3-6 months of consistent practice (start with a small account or paper trading). The first month is about learning the tools and building your checklist. Months 2-3 are about executing systematically. Months 4-6 are about optimizing based on your journal data.
Summary
Day trading crypto with AI tools transforms the practice from gambling into a structured, repeatable process. The six-step framework — Regime Check → Signal Discovery → Confluence Validation → Order Flow Entry → Risk Management → Performance Review — covers every decision point in a trading session.
CoinXSight's integrated platform provides the complete day trading toolkit: the AI Terminal for pre-session macro assessment, Alpha Hunter on 1H for intraday signal generation, Deep Alpha for multi-layer validation, Chart Pro with Order Flow for precision entry timing, and the Backtest module with AI Risk Audit for strategy validation.
The three critical success factors:
Never skip the regime check — the wrong strategy in the wrong market is guaranteed to lose money
Respect the 2% daily hard stop — one bad day should never threaten your trading capital
Trust the system over your emotions — the checklist exists to prevent impulsive decisions
Master crypto swing trading with AI-powered signal generation, EMA crossover strategies, and risk management. Step-by-step setups using CoinXSight with real…
Master risk management for crypto trading. Learn position sizing formulas, stop-loss strategies, and how CoinXSight's Portfolio module tracks your risk…