Divergence Trading Masterclass: RSI, MACD, and OBV
Master divergence trading with RSI, MACD, and OBV indicators. Learn to identify regular and hidden divergence patterns that signal reversals and continuations in crypto markets.
JV
Julian VanceLead Technical Systems Architect·May 19, 2026 · 12 min read · Updated Oct 6
Divergence occurs when price and an oscillator indicator move in opposite directions. It signals a disconnect between price action and underlying momentum — and it's one of the most reliable early warning systems in technical analysis.
Why divergence works: Price can be pushed in a direction by momentum, market makers, or speculative activity. But the underlying momentum (measured by indicators like RSI, MACD, or OBV) reveals whether that move is sustainable. When price makes new highs but momentum doesn't confirm, the move is running on fumes — a reversal becomes likely.
Both are essential for crypto traders because crypto markets are driven by momentum cycles that divergence patterns detect early. For a complete overview of all crypto indicators and how they work together, see our Cryptocurrency Technical Analysis Indicators guide.
Regular Divergence: Reversal Signals
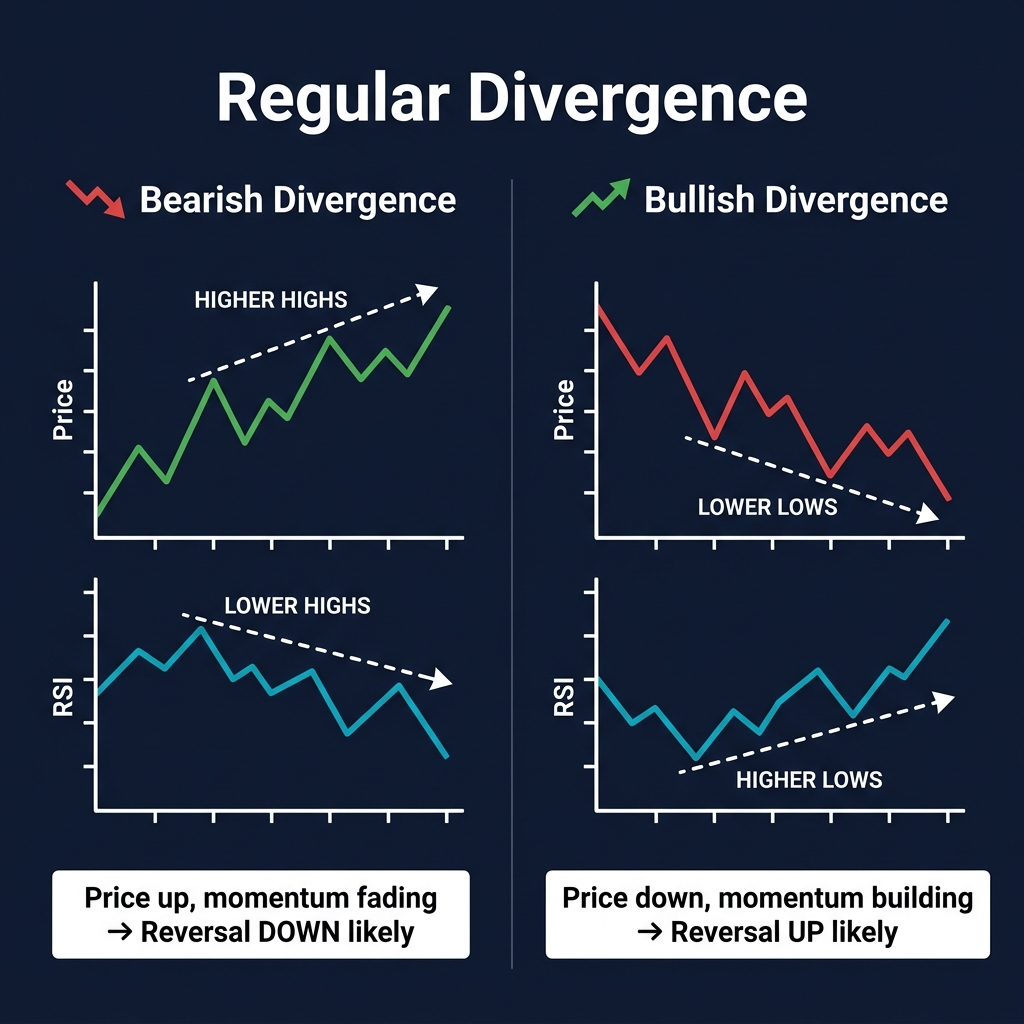
Regular divergence is a counter-trend signal. It warns that the current trend is losing steam and a reversal may be approaching.
Bearish Regular Divergence
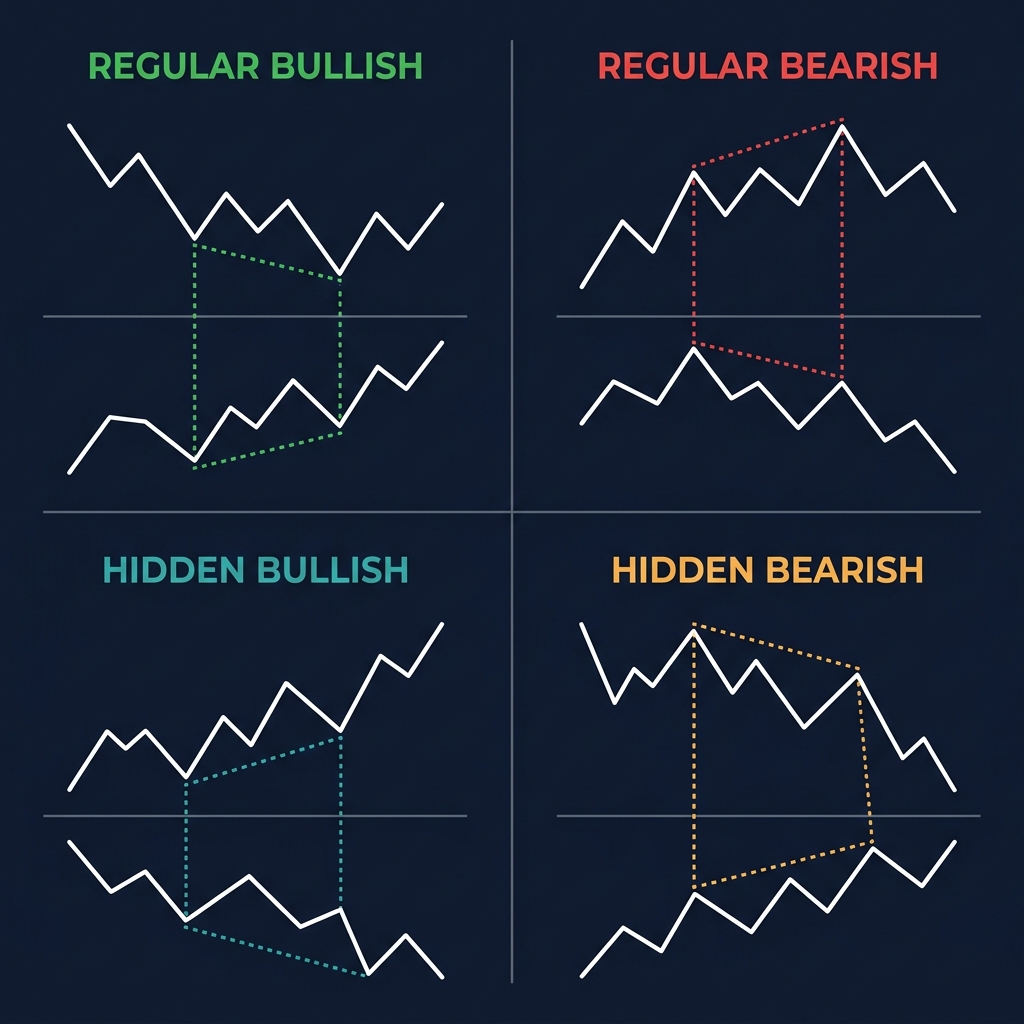
Definition: Price makes a Higher High, but the indicator makes a Lower High.
What it means: Price is reaching new highs, but momentum is weakening. Buyers are losing conviction. Each push higher requires more effort for less result — a classic exhaustion pattern.
How to trade it:
Identify two consecutive swing highs on price (each higher than the previous)
Check RSI/MACD at each swing high — the second reading should be LOWER
Wait for confirmation: a break below the most recent swing low or a bearish candle pattern
Enter SHORT with stop-loss above the most recent swing high
Best timeframes: 4H and Daily. Divergence on 1H is common but less reliable. Weekly divergence is rare but extremely powerful.
Example:
BTC Price:                  RSI:
Swing High 1: $103,000      RSI: 78
Swing High 2: $106,500      RSI: 71 ← LOWER (bearish divergence)

Interpretation: BTC made new ATH but momentum is fading.
Action: Watch for breakdown below $102,000 support.
Bullish Regular Divergence
Definition: Price makes a Lower Low, but the indicator makes a Higher Low.
What it means: Price is falling to new lows, but momentum is actually improving. Sellers are exhausted. The selling pressure is decreasing even as price drops — buyers are stepping in quietly.
How to trade it:
Identify two consecutive swing lows on price (each lower than the previous)
Check RSI/MACD at each swing low — the second reading should be HIGHER
Wait for confirmation: break above the most recent swing high or bullish engulfing candle
Enter LONG with stop-loss below the most recent swing low
Target: previous resistance or Fibonacci extension
Crypto-specific note: Bullish divergence during a sell-off is one of the strongest bottoming signals in crypto. Combine with CoinXSight's exchange flow analysis — if exchange outflows increase (accumulation) during bullish divergence, the signal gains significant conviction.
Hidden Divergence: Continuation Signals
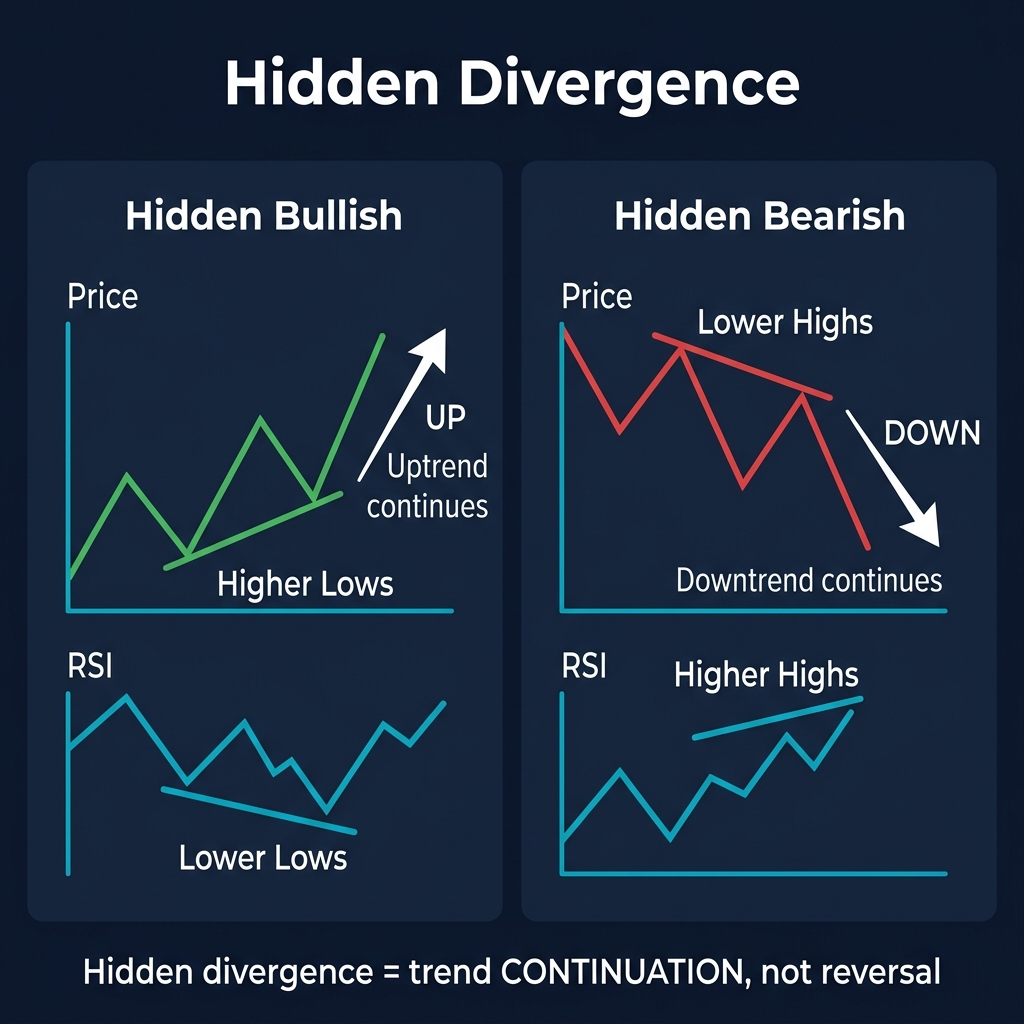
Hidden divergence is less intuitive than regular divergence, but equally valuable. It signals that the current trend will continue despite a temporary pullback.
Hidden Bullish Divergence
Definition: Price makes a Higher Low, but the indicator makes a Lower Low.
What it means: The trend is up. Price pulled back but held above the previous low (healthy trend structure). The indicator dropped below its previous low — this looks scary, but it actually means the pullback was shallow relative to price, indicating the trend has strong underlying support.
How to trade it:
Confirm the overall trend is UP (higher highs and higher lows on the Daily chart)
Price pulls back and makes a Higher Low
RSI/MACD makes a Lower Low at that pullback
Enter LONG at the Higher Low with stop below the previous Low
Target: continuation to previous highs or new highs
Hidden Bearish Divergence
Definition: Price makes a Lower High, but the indicator makes a Higher High.
What it means: The trend is down. Price attempted to rally but failed to reach the previous high (weakness confirmed). The indicator actually rallied higher — but this is a fake-out in momentum. The trend structure (lower highs) overrides the indicator reading.
How to trade it:
Confirm the overall trend is DOWN
Price rallies and makes a Lower High
RSI/MACD makes a Higher High at that rally
Enter SHORT at the Lower High
Target: continuation to new lows
Which Indicator to Use for Divergence
Each indicator detects different types of divergence with varying reliability:
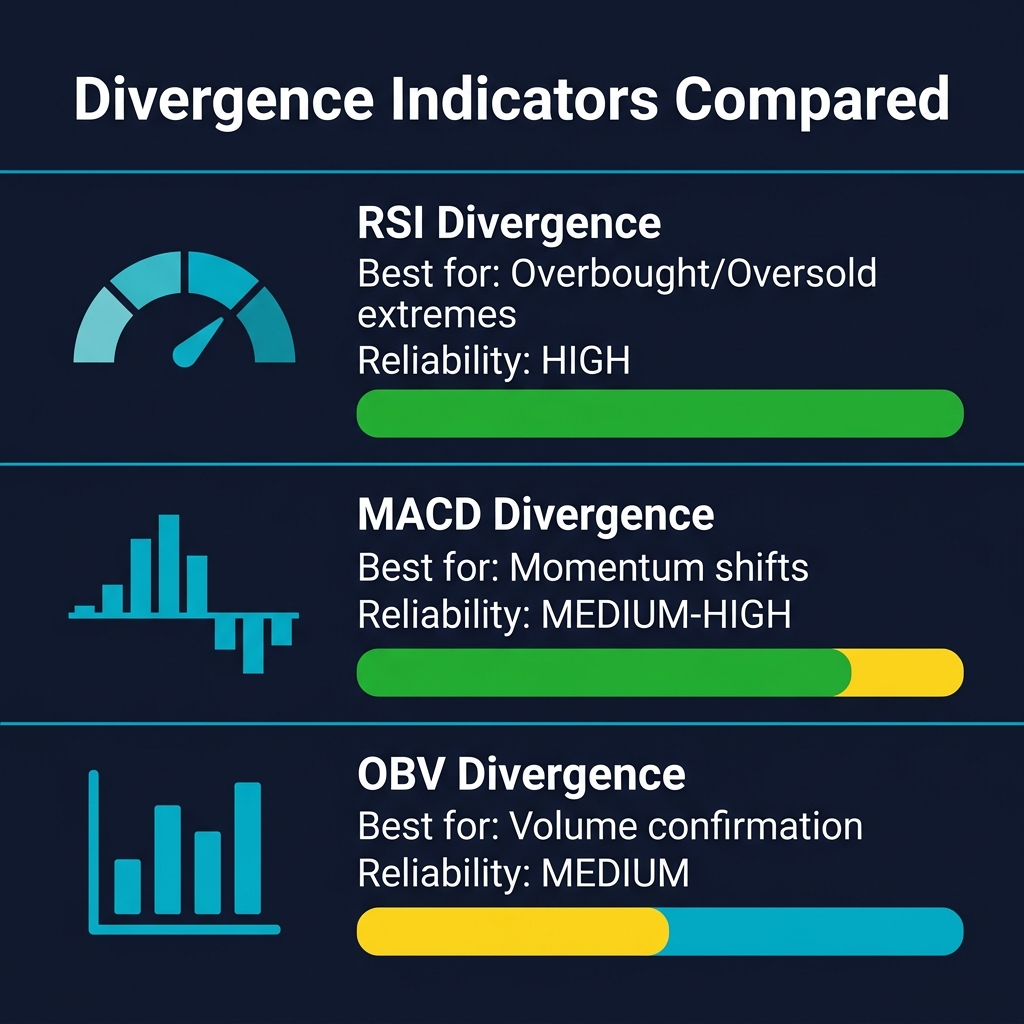
RSI Divergence (Most Reliable)
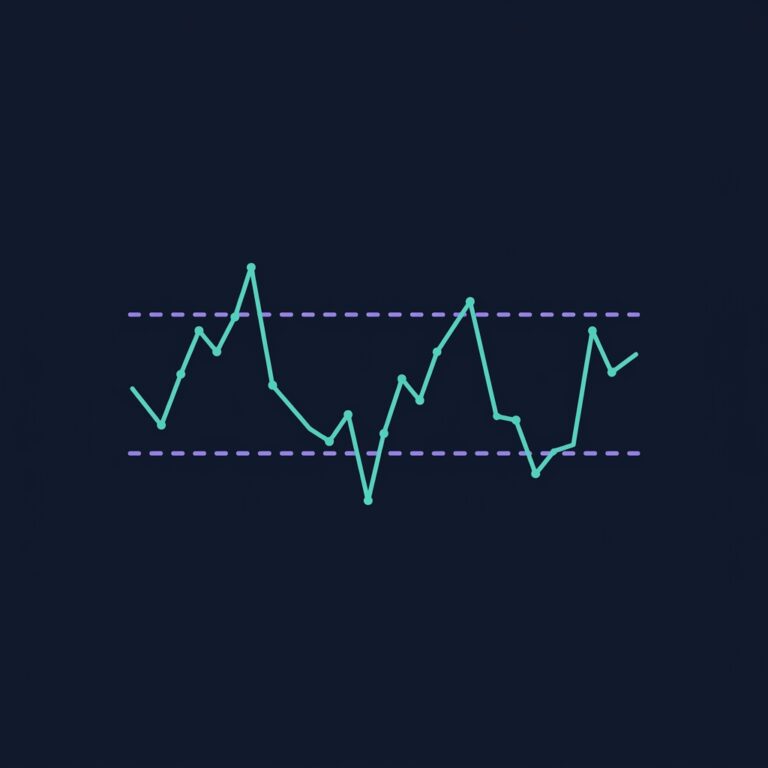
The RSI (Relative Strength Index) is the most popular divergence indicator for good reason:
Strengths:
Clear bounded range (0-100) makes divergence easy to spot
Works exceptionally well at extremes (RSI >70 or <30)
RSI divergence at overbought/oversold levels has the highest win rate (~65-70%)
Best indicator for reversal divergence
Settings: RSI(14) is the standard. RSI(21) for Daily charts in crypto provides smoother, more reliable signals.
When RSI divergence is strongest:
RSI above 70 + bearish divergence = HIGH probability reversal
RSI below 30 + bullish divergence = HIGH probability reversal
RSI between 40-60 + divergence = LOW probability (avoid)
MACD Divergence (Best for Momentum Shifts)
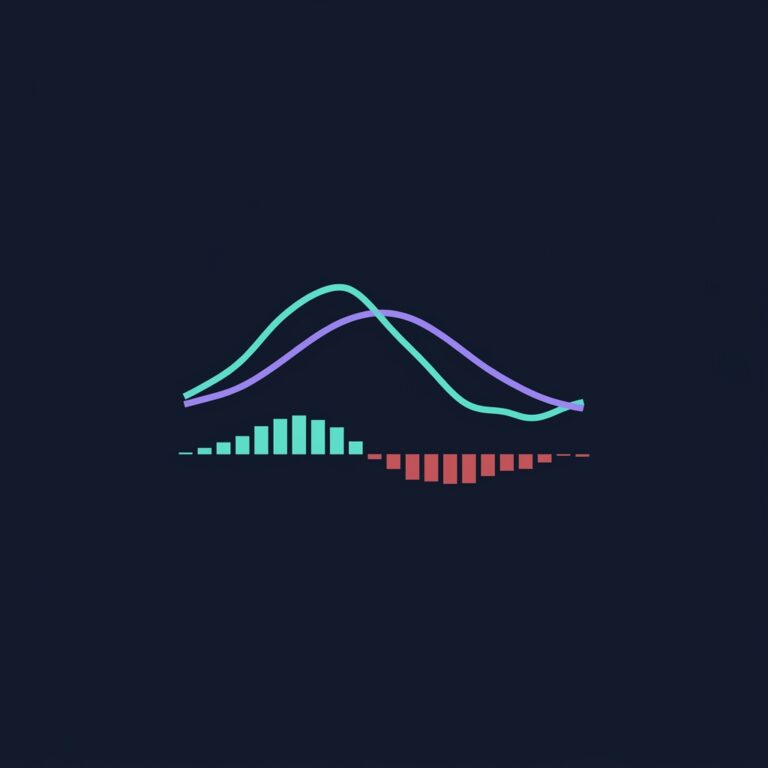
The MACD histogram provides a different perspective — it measures the acceleration of momentum, not just the level.
Strengths:
MACD histogram divergence catches momentum shifts earlier than RSI
Particularly effective on 4H timeframe for crypto
The histogram's visual clarity makes divergence easy to identify
Better for trend continuation divergence than RSI
Settings: MACD(12, 26, 9) standard. Some crypto traders use MACD(8, 21, 5) for faster signals.
Key difference from RSI: MACD divergence doesn't require overbought/oversold levels. It works throughout the indicator's range, making it useful during trending markets where RSI stays elevated.
OBV Divergence (Volume Confirmation)
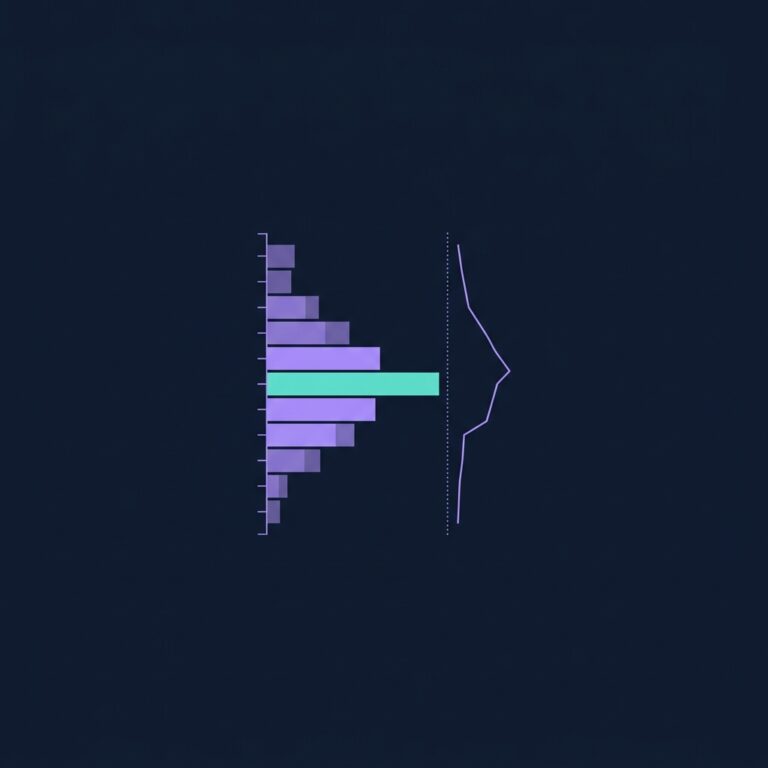
On-Balance Volume (OBV) adds a crucial dimension: volume. While RSI and MACD are purely price-based, OBV tracks cumulative volume flow.
Strengths:
Confirms whether money is flowing in or out during price moves
OBV divergence + RSI divergence = highest conviction signal
Particularly valuable in crypto where volume manipulation is common
Detects distribution (smart money selling into rallies) before price reacts
How OBV divergence works:
Bearish OBV divergence: Price makes higher highs but OBV makes lower highs → volume is declining during rallies → buyers are losing interest → reversal likely
Bullish OBV divergence: Price makes lower lows but OBV makes higher lows → volume is increasing during dips → accumulation happening → bounce likely
Divergence Trading System: Step-by-Step
Step 1: Identify the Trend Context
Before looking for divergence, determine the trend on the higher timeframe:
Rule: Trade regular divergence (reversals) only when the higher timeframe supports the reversal direction. Trade hidden divergence (continuation) only in the direction of the higher timeframe trend.
Step 2: Scan for Divergence
Check the following on your trading timeframe:
RSI(14): Look for new price extremes not confirmed by RSI
MACD histogram: Look for shrinking histogram bars during new price extremes
OBV: Look for volume diverging from price direction
Step 3: Grade the Signal
Factor
Strong
Moderate
Weak
RSI zone
>75 or <25
65-75 or 25-35
40-65
Timeframe
Daily/Weekly
4H
1H or lower
# of swings
3+ touches
2 touches
1 touch
Multi-indicator
RSI + MACD + OBV all diverge
2 indicators diverge
1 indicator only
Volume
Volume declining on new extreme
Flat volume
Volume increasing (contradicts)
Only trade Strong or Moderate signals. Weak divergence signals in crypto have a win rate below 50%.
Step 4: Wait for Confirmation
Divergence is an early warning, not an immediate entry signal. Wait for one of these confirmations:
Break of the trendline connecting the recent swing highs/lows
Bearish/bullish engulfing candle at the divergence point
CoinXSight Alpha Hunter signal confirming the direction
Step 5: Execute with Risk Management
Entry: On confirmation signal
Stop-loss: Beyond the most recent swing high (for shorts) or swing low (for longs)
Position size: Use the risk management framework — maximum 2% portfolio risk per divergence trade
Target: Previous S/R level or 2:1 risk-reward minimum
Common Divergence Traps
1. Trading Divergence Against a Strong Trend
Bearish divergence during a strong bull market can persist for weeks. Price can make 5-6 higher highs while RSI makes lower highs — and price keeps rising. Divergence works best at trend exhaustion, not during momentum-driven breakouts.
Crypto-specific risk: In crypto, parabolic rallies can ignore divergence for extended periods. Never short based on divergence alone during a clear uptrend.
2. Confusing Regular and Hidden Divergence
Regular divergence = reversal signal. Hidden divergence = continuation signal. Trading them backwards leads to entering against the trend.
Quick reference:
Price making new extreme + indicator NOT confirming = Regular (reversal)
Price NOT making new extreme + indicator making new extreme = Hidden (continuation)
3. Ignoring the Timeframe
Divergence on a 5-minute chart is nearly meaningless — noise. Divergence on a Daily chart is a significant signal. Always trade divergence on 4H or higher for crypto.
4. No Confirmation, No Trade
Entering the moment you spot divergence (without waiting for confirmation) leads to early entries that get stopped out. The divergence might deepen before reversing.
5. Neglecting Volume
Price divergence without volume confirmation is weak. If RSI shows bearish divergence but volume is still increasing on rallies, the trend may persist despite the divergence signal.
Whether you want to buy Bitcoin, buy Ethereum, or trade altcoins, this indicator helps you time entries on any crypto exchange with data-driven confidence.
Frequently Asked Questions
How often does divergence occur in crypto?
On the 4H timeframe, significant divergence patterns appear 2-4 times per month for major assets (BTC, ETH, SOL). On the Daily, 1-2 times per month. These are relatively rare signals, which is part of why they're reliable — the market doesn't often diverge from its momentum without reason.
Can divergence fail?
Yes. Divergence has a historical win rate of 60-70% when traded with confirmation on the 4H+ timeframe. The 30-40% failure rate means risk management is essential. Failed divergence (price continues in the original direction despite the signal) is most common during strong momentum-driven markets.
What's the best indicator combination for divergence?
RSI for primary signal detection + MACD histogram for confirmation + OBV for volume validation. When all three show divergence simultaneously, the signal is at its highest reliability.
Is divergence useful for memecoins?
Less so. Memecoins are driven by narrative and social momentum, not by the technical factors that divergence measures. For memecoins, use CoinXSight's Meme Hunter for specialized analysis. Divergence is most effective on tokens with established market structure (top-50 by market cap).
Can AI detect divergence automatically?
Yes. CoinXSight's Chart Pro scans for divergence patterns across multiple indicators and timeframes. The AI Analysis module incorporates divergence detection into its signal generation pipeline, flagging potential divergence-based opportunities before they fully develop.
Summary
Divergence is one of the most reliable predictive patterns in technical analysis — a rare signal type with a 60-70% win rate when traded correctly. Regular divergence warns of trend reversals; hidden divergence confirms trend continuation.
The key to profitable divergence trading is discipline: use it on 4H or higher timeframes, wait for confirmation before entering, and always grade the signal strength before committing capital. Combine RSI for detection, MACD for momentum confirmation, and OBV for volume validation.
Lead Technical Systems Architect·Signals & Metrics Desk
Technical systems developer with a mathematical focus on momentum indicators, volatility metrics (ATR), volume profiles, and multi-timeframe filter models.
QUANTITATIVE SUITE // DEEP ALPHA ENGINEACTIVE
BTC/USDT // LIVE SCANNER
CONFLUENCE 48
LIVE SPOT PRICE$82,988.36NO_TRADE
TP2
$88,158.20
+7.41%
TP1
$84,510.60
+2.96%
ENTRY
$82,078.87
ZONE
SL
$80,863.00
-1.48%
Auto-detect Order Blocks, Fair Value Gaps and risk-adjusted DCA ladders in < 5s.
Master multi-timeframe analysis for crypto trading. Learn the 3-timeframe rule, top-down analysis flow, timeframe alignment signals, and how to combine…