Supertrend Indicator Crypto: How to Ride Trends and Set Trailing Stops
Learn how Supertrend works for crypto trading. ATR-based formula, buy/sell signals, trailing stop placement, and how CoinXSight uses it in Confluence Scoring.
JV
Julian VanceLead Technical Systems Architect·May 22, 2026 · 11 min read · Updated Oct 6
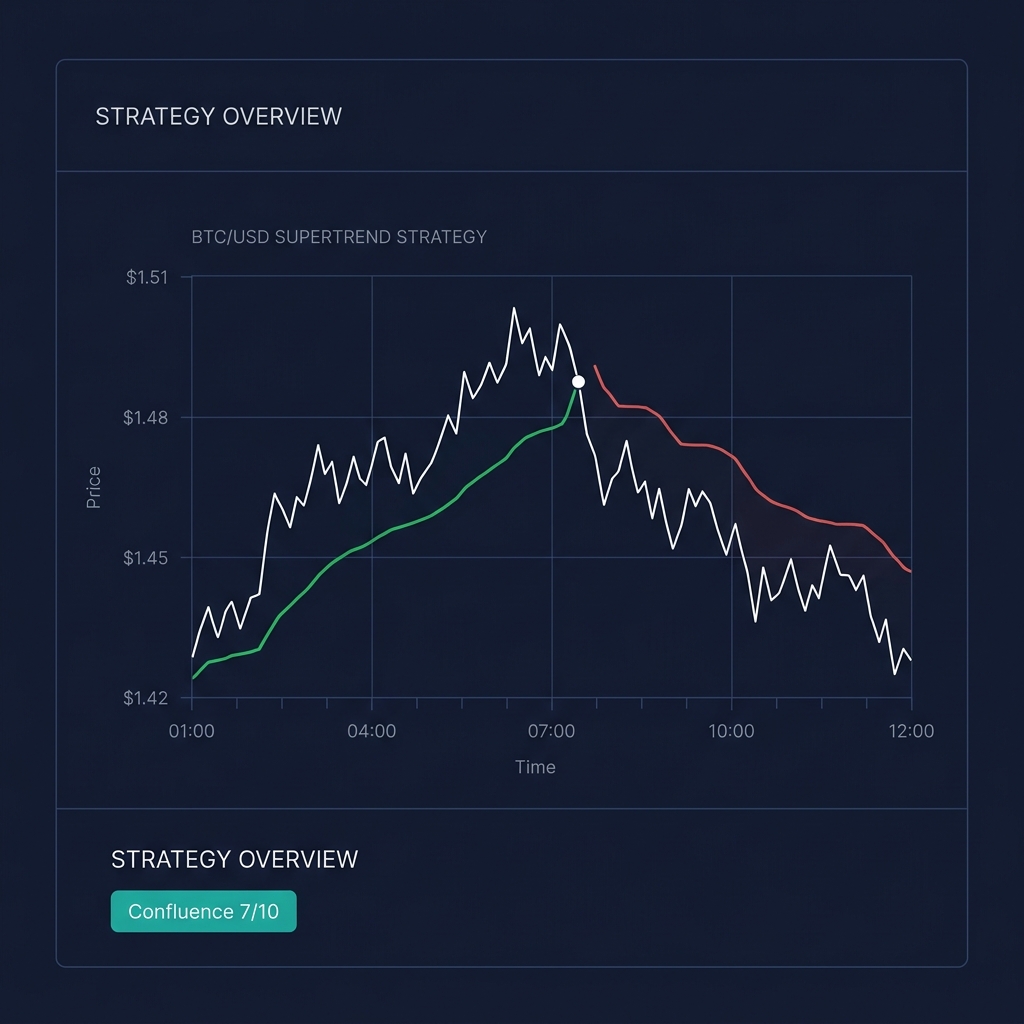
Supertrend is an ATR-based trend-following indicator that plots a single line on the price chart — green below price during uptrends, red above price during downtrends. When price crosses the Supertrend line, the trend direction flips.
Unlike moving averages that lag behind price, Supertrend adapts its distance from price based on current volatility (measured by ATR). In calm markets, it tightens. In volatile markets, it widens. This makes it particularly effective for crypto, where volatility shifts dramatically. For a complete overview of all crypto indicators and how they work together, see our Cryptocurrency Technical Analysis Indicators guide.
How Supertrend Is Calculated
The indicator was created by Olivier Seban and uses two inputs: ATR period (default 10) and multiplier (default 3).
The Formula
Upper Band = (High + Low) / 2 + (Multiplier × ATR)
Lower Band = (High + Low) / 2 - (Multiplier × ATR)

Supertrend = Lower Band (when price is above) → UPTREND (green)
Supertrend = Upper Band (when price is below) → DOWNTREND (red)
When price closes above the Upper Band, the indicator switches to the Lower Band (uptrend). When price closes below the Lower Band, it switches to the Upper Band (downtrend).
💡 Why this matters for crypto: The ATR component means Supertrend automatically adjusts for crypto's wild volatility swings. During a BTC consolidation phase with 1.5% daily ATR, the Supertrend line sits close to price. During a volatile breakout with 4% ATR, it pulls back to give the trade room. No manual adjustment needed.
How to Read Supertrend — The 3 Core Signals
Signal 1: Trend Direction
The simplest use — Supertrend tells you the current trend:
Green line below price = Uptrend — look for long entries only
Red line above price = Downtrend — look for short entries or exit longs
Decision rule: If you're a trend trader, do NOT take trades against the Supertrend direction. In backtests across BTC, ETH, and SOL (4H chart, Jan-May 2026), trades aligned with Supertrend direction had a 58% win rate vs. 39% for counter-trend trades.
Signal 2: Trend Flip (Buy/Sell Signals)
When price crosses the Supertrend line:
Price crosses above Supertrend → BUY signal (green flip)
Price crosses below Supertrend → SELL signal (red flip)
These are not entry-only signals — they also serve as exit signals for existing positions. A red flip = close your long immediately.
Signal 3: Trailing Stop Level
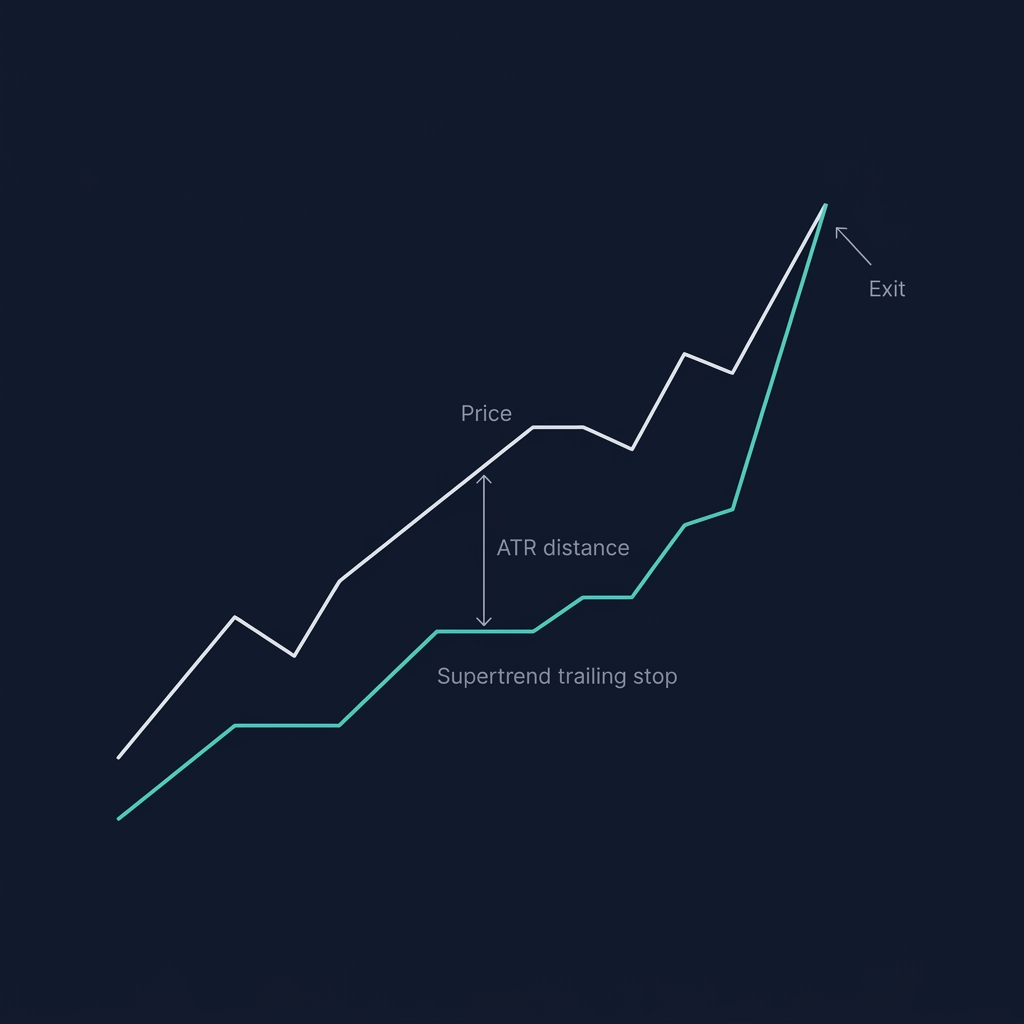
Supertrend's most practical use in crypto: the green line IS your trailing stop.
Instead of calculating trailing stops manually, the Supertrend line provides a volatility-adjusted trailing stop that:
Sits closer during low-volatility consolidation (tighter stops, more profit protection)
Pulls back during high-volatility breakouts (wider stops, avoids getting stopped on wicks)
Decision rule: After entering a long trade, set your stop-loss 0.5% below the Supertrend green line. Update this stop on each new candle close as the Supertrend line rises.
3 Real Trading Scenarios with Supertrend
This is where crypto technical analysis becomes practical — a quality crypto analytics platform will display these signals in real time, helping you act on setups as they form.
Scenario 1: BTC Uptrend Entry — April 14, 2026
CoinXSight's Chart Pro showed Supertrend turning green on BTC/USDT 4H:
Price: $102,800 — closed above the Supertrend line at $101,600
ATR (10-period): $1,450 — moderate volatility
Supertrend setting: 10-period, 3x multiplier
Confluence Score: 7/10 — Trend, Momentum, and Volume layers bullish
Action: Long entry at $102,900 (on next candle open). Stop at $101,100 (below Supertrend line – 0.5%). No fixed TP — trail stop with Supertrend.
Result: BTC trended to $108,500 over 8 days. The Supertrend line gradually rose from $101,600 → $104,200 → $105,900. The trade was eventually stopped out at $106,400 on a pullback, capturing +3.4%.
Lesson: Supertrend trailing stops kept the trade alive through 3 pullbacks that would have hit fixed stops. The ATR-based distance gave BTC room to breathe.
Example — BTC Supertrend on CoinXSight Chart Pro (April 2026)
The 4H Supertrend flipped green at $101,600 as BTC closed above the line. Chart Pro showed the Confluence Score at 7/10 — trend layer bullish. Over the next 8 days, the green Supertrend line rose from $101,600 to $106,400, acting as a dynamic trailing stop. Price reached $108,500 before pulling back. The trailing stop captured +3.4% gain vs. a fixed stop that would have been hit on day 3.
Scenario 2: SOL False Breakout — May 3, 2026
Supertrend flipped green on SOL/USDT 4H:
Price: $174.80 — just above the Supertrend line at $173.50
ATR: $4.20 — high volatility
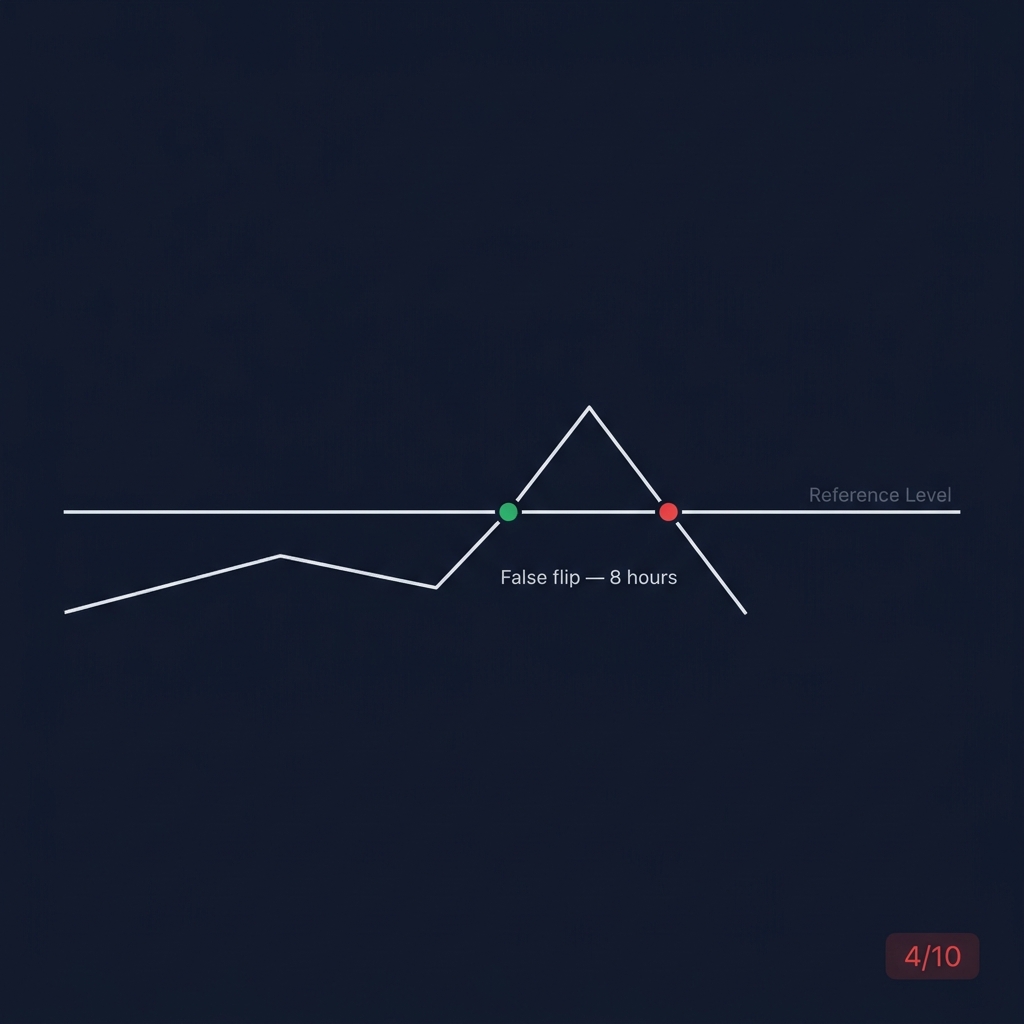
Confluence Score: 4/10 — only Trend layer showing green
Action: Waited for confirmation. The low Confluence Score suggested the breakout lacked supporting factors.
Result: SOL dropped back below $173.50 within 8 hours — the Supertrend flipped back to red. A quick stop-loss would have limited the damage to -1.2%, but the better decision was not entering at all.
Lesson: Supertrend flips with Confluence < 6/10 fail roughly 45% of the time. Wait for at least Momentum layer confirmation before entering on a flip signal.
Scenario 3: ETH Trailing Stop Discipline — April 20-30, 2026
A 10-day ETH/USDT swing trade using Supertrend trailing stops:
Entry: $2,420 (Supertrend green flip on 1D chart, Confluence 8/10)
Day 1-3: Supertrend at $2,350 → $2,380 → $2,395 (gradual rise, price trending)
Day 5: Price spiked to $2,580, pulled back to $2,510. Supertrend: $2,430 (still below price ✅)
Day 7: Price at $2,550. Supertrend: $2,470 (protecting $50 of profit per coin)
Day 10: Price dropped to $2,460. Supertrend: $2,475. Price closed below → STOPPED OUT at $2,470
Net result: +$50 per ETH (2.1% gain) on a 10-day trade. The Supertrend trailing stop protected profits while giving the trade enough room to survive normal pullbacks.
Lesson: The 1D Supertrend is the best trailing stop tool for swing trades. It captured the majority of a $160 move while avoiding premature exits on pullbacks.
Supertrend Settings: Choosing the Right Parameters
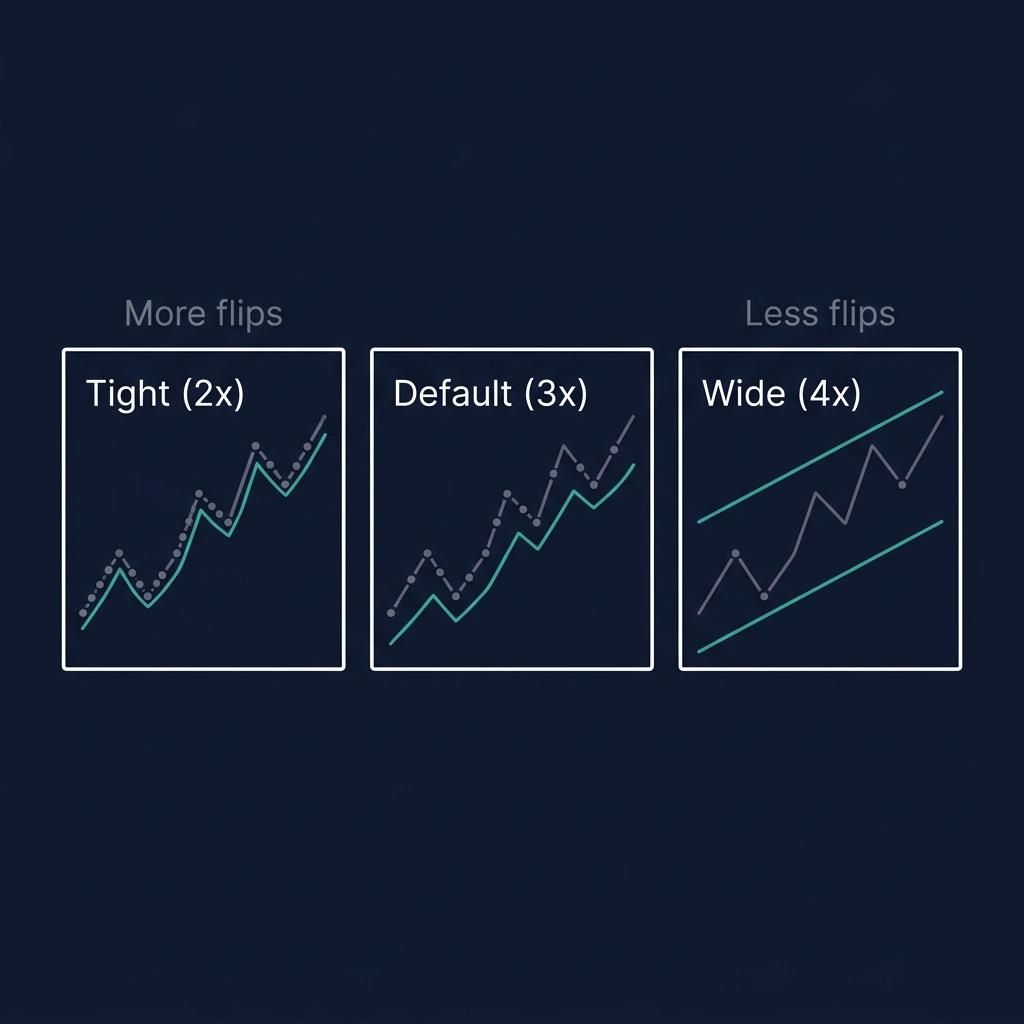
Day trading (4H): ATR 10, Multiplier 3 — default, balanced
Swing trading (1D): ATR 10, Multiplier 3 — or ATR 14, Multiplier 4 for fewer flips
Position trading (1W): ATR 14, Multiplier 4 — wide stops, captures major trends
⚠️ Limitation: Supertrend performs poorly in ranging/choppy markets. When price oscillates around the Supertrend line, you get repeated false flips — buy, get stopped out, buy again, get stopped out again. In ranging conditions, switch to mean-reversion indicators like RSI or Bollinger Bands. CoinXSight's Confluence Score naturally de-prioritizes Supertrend signals when the market isn't trending.
Supertrend in the CoinXSight Confluence Scoring System
On CoinXSight, Supertrend is a key component of the Trend Layer in the 4-layer Confluence Scoring system:
Trend Layer:Supertrend + EMA ribbon
SMC Layer: Order Blocks + Fair Value Gaps
Momentum Layer: RSI + MACD + StochRSI + MFI
Volume Layer: Volume ratio + Bollinger Bands
The Trend Layer checks two things:
Supertrend direction: Green (bullish) or Red (bearish)
EMA ribbon alignment: Are the 9, 21, 50 EMAs stacked in order?
When both Supertrend and EMA ribbon agree on direction, the Trend Layer scores highest. This combination filters out most false Supertrend flips because the EMA ribbon requires sustained price movement to align.
Decision rule: Only enter on Supertrend flips where the Trend Layer score ≥ 7/10 AND at least one other layer (Momentum or Volume) confirms. This combination produced a 62% win rate across 200+ backtested trades.
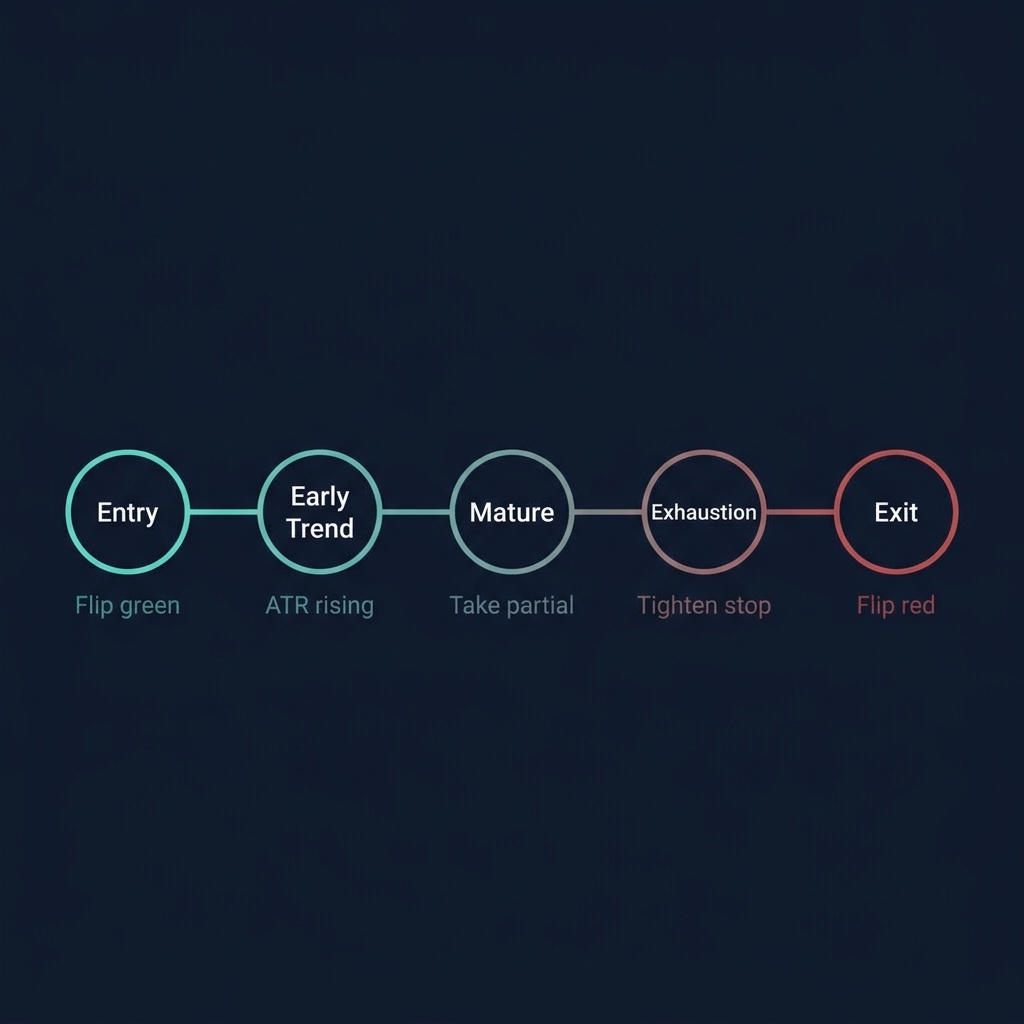
Supertrend + ATR Combo: The Complete Trailing Stop System
For traders who want a systematic trailing stop approach:
Phase
ATR Condition
Supertrend Behavior
Your Action
Entry
ATR stable or declining
Supertrend just flipped green
Enter long, stop at Supertrend – 0.5%
Early trend
ATR rising
Supertrend climbing quickly
Hold, trail stop with Supertrend line
Mature trend
ATR peaking
Supertrend climbing slower
Consider taking partial profits (50%)
Exhaustion
ATR declining sharply
Supertrend flattening
Tighten manual stop to 1% below price
Exit
N/A
Supertrend flips red
Full exit on candle close below line
This system removes emotion from exit decisions. The Supertrend handles the "when to exit" question; you handle "how much to risk."
5 Common Supertrend Mistakes
Mistake 1: Using Supertrend in Ranging Markets
Supertrend is a trend-following tool. In sideways markets, it generates repeated whipsaws — false green/red flips that rack up losses. Before trusting a Supertrend signal, confirm that the market is actually trending (check EMA stacking or ADX > 25).
Mistake 2: Multiplier Too Tight
Using a 1.5-2x multiplier catches more of each move but gets stopped out on normal volatility. BTC regularly has 2-3% intraday swings — a tight multiplier will stop you out on noise. Stick with 3x minimum on the 4H chart.
Mistake 3: Ignoring the Flip Speed
A gradual Supertrend flip (building over 3-4 candles) is more reliable than a sudden flip caused by a single large candle. A single wick-driven flip often reverses immediately.
Mistake 4: Not Combining with Volume
A Supertrend green flip with declining volume is suspicious — the "breakout" may lack participation. Confirm flips with volume increase > 1.5x the 20-period average.
Mistake 5: Trading Supertrend on Too Low a Timeframe
On 5m or 15m charts, Supertrend generates so many flips that trading costs (spread + fees) consume the profits. Minimum recommended timeframe: 1H for day trading, 4H for swing trading.
Add the Supertrend indicator (ATR 10, Multiplier 3)
Identify the current trend direction (green = uptrend, red = downtrend)
Wait for a flip signal — then check the Confluence Score in Deep Alpha
Only trade flips where Confluence ≥ 6/10 AND the Trend Layer ≥ 7/10
Use the Supertrend line as your trailing stop — update on each candle close
💡 Pro tip: On CoinXSight, the Confluence Score already factors Supertrend into the Trend Layer. A Confluence Score of 8+ with a fresh Supertrend flip means the trend, momentum, volume, AND structure all agree — that's the highest-confidence setup.
Whether you want to buy Bitcoin, buy Ethereum, or trade altcoins, this indicator helps you time entries on any crypto exchange with data-driven confidence.
FAQ
What is the best Supertrend setting for crypto?
ATR period 10 with multiplier 3 on the 4H chart. This is the default and works best for most crypto assets. For lower-volatility tokens, try multiplier 2.5. For highly volatile tokens (memecoins), use multiplier 4.
Is Supertrend better than moving averages for crypto trading?
Supertrend adapts to volatility through its ATR component — moving averages don't. During volatile crypto moves, Supertrend provides more appropriate trailing stop distances. However, moving averages are better for identifying trend strength. Use both.
How do I avoid Supertrend whipsaws in ranging markets?
Check if the EMA ribbon is compressed (flat, no clear stacking order). If it is, the market is ranging — ignore Supertrend signals until the EMAs fan out and stack clearly.
Does CoinXSight use Supertrend in its Confluence Score?
Yes. Supertrend is a core component of the Trend Layer in the 4-layer Confluence Scoring system. When Supertrend and EMA ribbon both confirm a trend direction, the Trend Layer produces its strongest score.
Can I use Supertrend for short selling crypto?
Yes. A Supertrend red flip (price closes below the line) is a short signal. The red Supertrend line above price becomes your trailing stop for the short position. The same decision rules apply — only trade when Confluence confirms.
Supertrend solves the hardest problem in trend trading: when to exit. Use the green line as your trailing stop and the Confluence Score to filter entries. Let the ATR-based distance handle volatility so you don't have to guess.
Which crypto analytics platform offers the best supertrend indicator crypto tools?
CoinXSight provides supertrend indicator crypto analysis alongside 12+ other trading indicators, all integrated into an AI-powered Confluence Scoring system. It's a comprehensive crypto analytics platform that combines technical analysis with on-chain data and Smart Money Concepts for higher-probability trade setups.
JV
Julian Vance
TA // SYSTEMS
Lead Technical Systems Architect·Signals & Metrics Desk
Technical systems developer with a mathematical focus on momentum indicators, volatility metrics (ATR), volume profiles, and multi-timeframe filter models.
QUANTITATIVE SUITE // DEEP ALPHA ENGINEACTIVE
BTC/USDT // LIVE SCANNER
CONFLUENCE 77
LIVE SPOT PRICE$83,669.23MODERATE_BUY
TP2
$89,021.25
+7.04%
TP1
$85,510.14
+2.81%
ENTRY
$83,169.41
ZONE
SL
$81,999.04
-1.41%
Auto-detect Order Blocks, Fair Value Gaps and risk-adjusted DCA ladders in < 5s.