This is not a tutorial. This is the crypto technical analysis cheat sheet you keep open on a second monitor while you trade.
Every table below is designed for instant lookup — find the indicator, pattern, or rule you need, get the signal criteria, and move on. No theory, no backstory. If you want the full explanation behind any concept here, follow the linked deep-dive guides.
How to use this page:
⌘/Ctrl + F to search for any indicator or pattern name
Tables are sorted by practical frequency of use
Bookmark this page — it's updated quarterly with current market parameters
All example prices reflect June 2026 levels (BTC ~$105K, ETH ~$2,800, SOL ~$170)
[!TIP]
CoinXSight's Deep Alpha module calculates most of these signals automatically. Use this cheat sheet to understand what the platform is telling you and why.
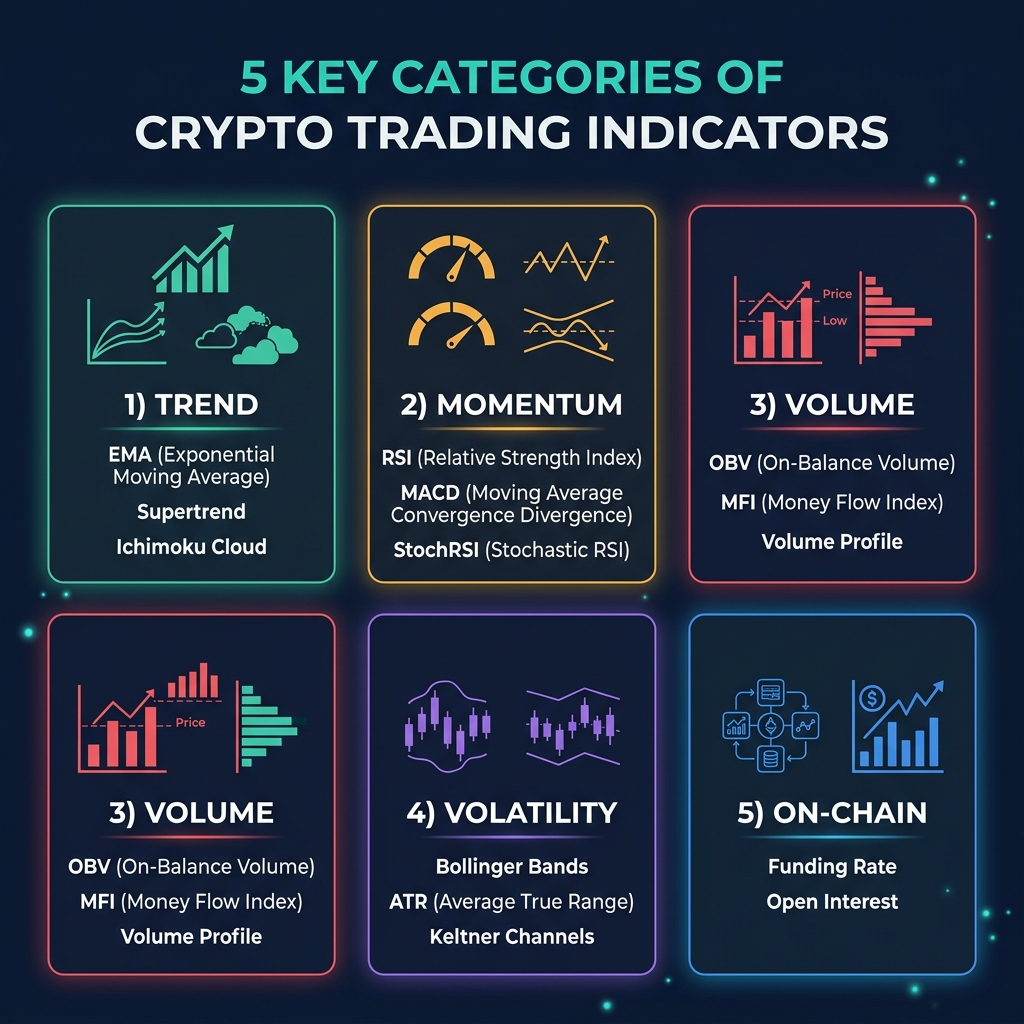
Indicator Quick Reference Table
One table. Every major indicator. Find it, read the signal, take the trade.
[!NOTE]
Quick rule: If ADX is above 25, use trend indicators (EMA, MACD, Supertrend, Parabolic SAR). If ADX is below 20, switch to oscillators (RSI, StochRSI, Bollinger Bands, CCI). This single decision filter eliminates most false signals.
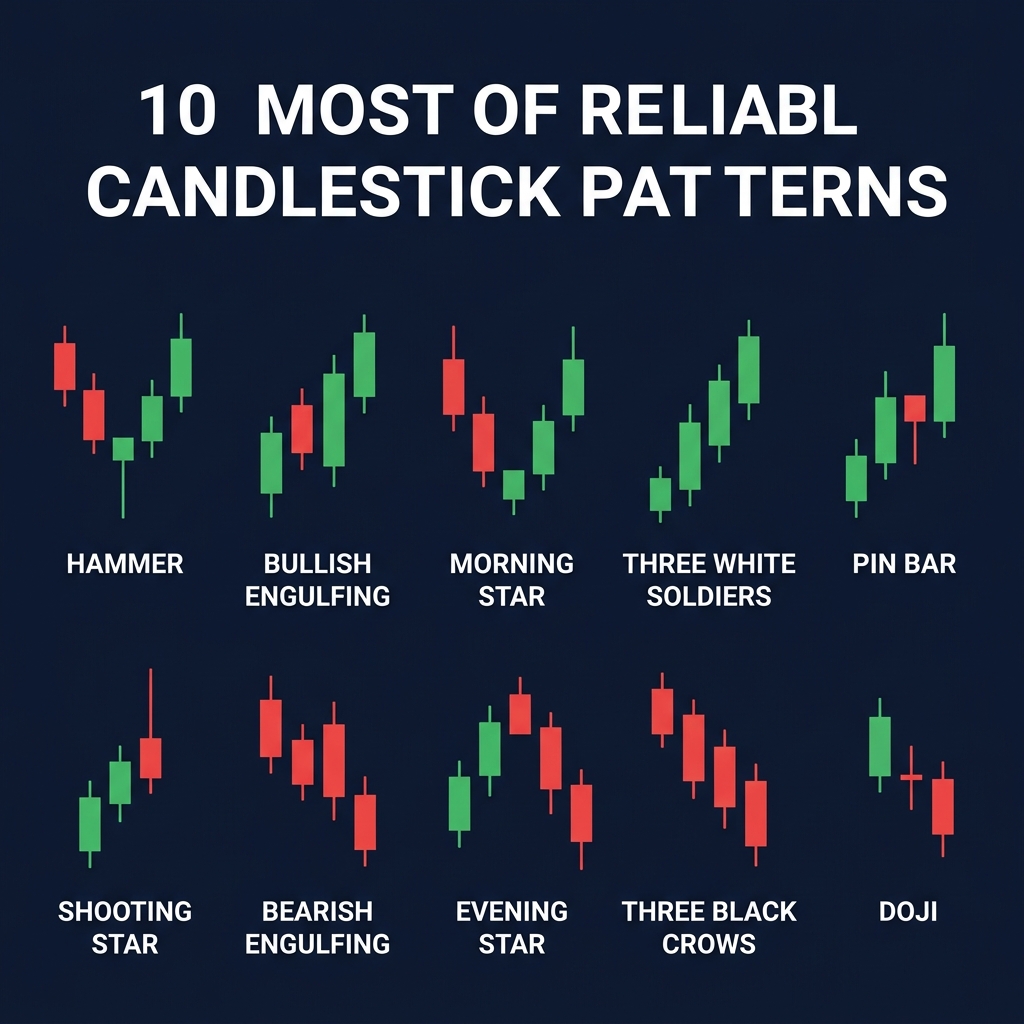
The 10 highest-reliability candlestick patterns. Skip the exotic ones — these are the patterns that consistently produce tradeable signals in 2026 crypto markets.
Pattern
Type
Bullish / Bearish
Reliability
Confirmation Needed
Hammer
Reversal
✅ Bullish
⭐⭐⭐⭐ High
Close above hammer high on next candle
Shooting Star
Reversal
🔴 Bearish
⭐⭐⭐⭐ High
Close below shooting star low on next candle
Bullish Engulfing
Reversal
✅ Bullish
⭐⭐⭐⭐ High
Higher close + rising volume on engulfing candle
Bearish Engulfing
Reversal
🔴 Bearish
⭐⭐⭐⭐ High
Lower close + rising volume on engulfing candle
Morning Star
Reversal
✅ Bullish
⭐⭐⭐⭐⭐ Very High
3-candle pattern; third candle closes above midpoint of first
Evening Star
Reversal
🔴 Bearish
⭐⭐⭐⭐⭐ Very High
3-candle pattern; third candle closes below midpoint of first
Three White Soldiers
Continuation
✅ Bullish
⭐⭐⭐ Moderate
Three consecutive bullish bodies with higher closes; check volume trend
Three Black Crows
Continuation
🔴 Bearish
⭐⭐⭐ Moderate
Three consecutive bearish bodies with lower closes; check volume trend
Doji (at S/R)
Reversal
⚪ Neutral
⭐⭐⭐ Moderate
Requires next-candle confirmation; direction depends on location
Pin Bar (Long Wick)
Reversal
✅/🔴 Both
⭐⭐⭐⭐ High
Wick ≥ 2× body size; close in opposite direction on next candle
Candlestick Reliability Multipliers
Not every candlestick is equal. These factors increase or decrease reliability:
Classic chart patterns with target calculations and realistic success rates for crypto. Success rates assume you trade with the dominant trend and use volume confirmation.
Pattern
Type
Direction
Target Calculation
Confirmation
Success Rate
Double Bottom
Reversal
Bullish
Neckline + (Neckline − Bottom)
Break above neckline on 2×+ volume
65–70%
Double Top
Reversal
Bearish
Neckline − (Top − Neckline)
Break below neckline on 2×+ volume
65–70%
Head & Shoulders
Reversal
Bearish
Neckline − (Head − Neckline)
Break below neckline + RSI < 50
60–65%
Inv. Head & Shoulders
Reversal
Bullish
Neckline + (Neckline − Head)
Break above neckline + RSI > 50
60–65%
Bull Flag
Continuation
Bullish
Flagpole height added to breakout
Breakout above flag + 2× volume
70–75%
Bear Flag
Continuation
Bearish
Flagpole height subtracted from breakdown
Breakdown below flag + 2× volume
70–75%
Ascending Triangle
Continuation
Bullish
Flat top − triangle base, added to breakout
Break above flat resistance
65–70%
Descending Triangle
Continuation
Bearish
Triangle base − flat bottom, subtracted from breakdown
Break below flat support
65–70%
Symmetrical Triangle
Continuation
Either
Height of triangle added/subtracted from breakout
Break in trend direction + volume spike
55–60%
Cup & Handle
Continuation
Bullish
Cup depth added to handle breakout
Handle breakout on rising volume
60–65%
Quick Target Calculation Formula
For any chart pattern, the universal formula is:
Target = Breakout Price ± Pattern Height
Example with BTC at $105,000:
Double bottom at $100,000, neckline at $105,000
Pattern height = $105,000 − $100,000 = $5,000
Target = $105,000 + $5,000 = $110,000
Stop-loss = below $100,000 (the bottom) = $99,500
Risk = $5,500 | Reward = $5,000 | R:R = 1:0.9 — not ideal, wait for a better entry
[!IMPORTANT]
Always calculate R:R before entering. If the pattern target doesn't give you at least 1:2 risk-reward, skip it — no matter how clean the pattern looks.
Funding rate extremely positive; open interest spiking
☐
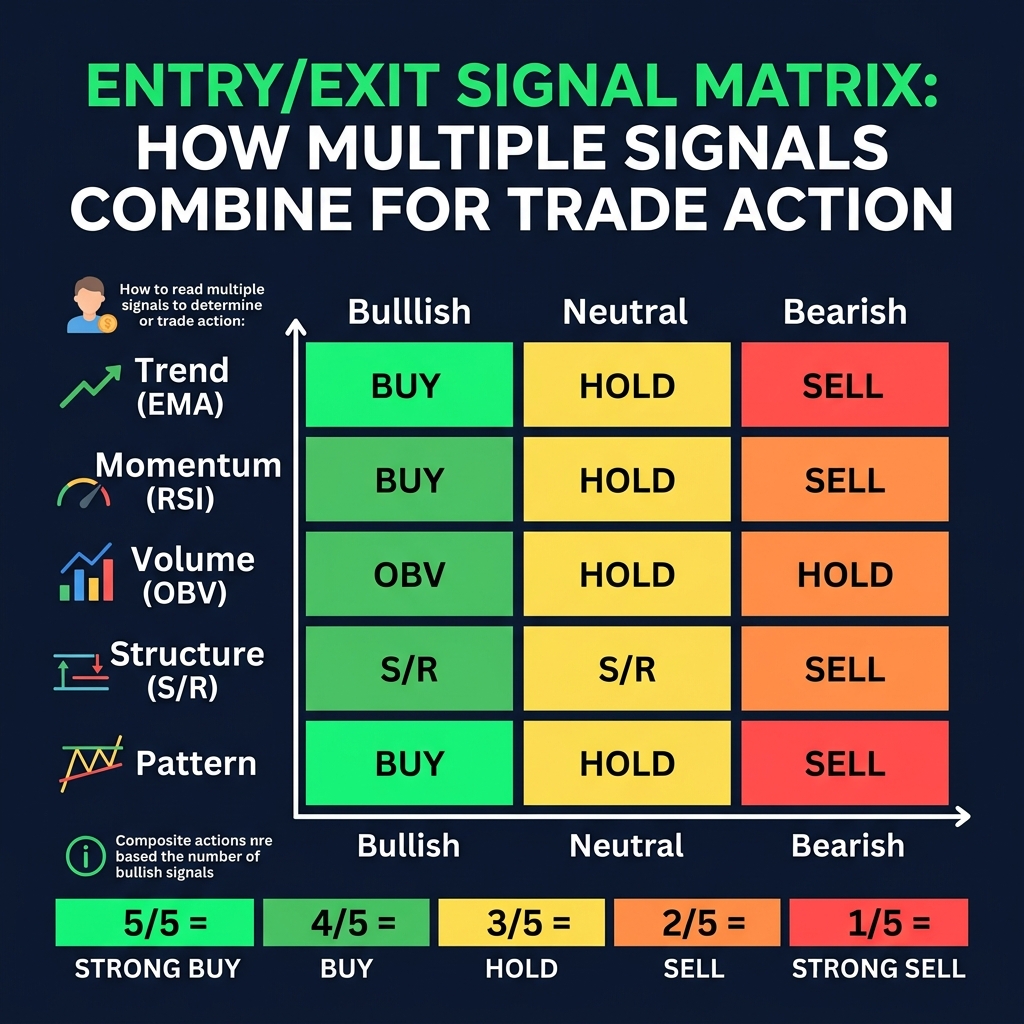
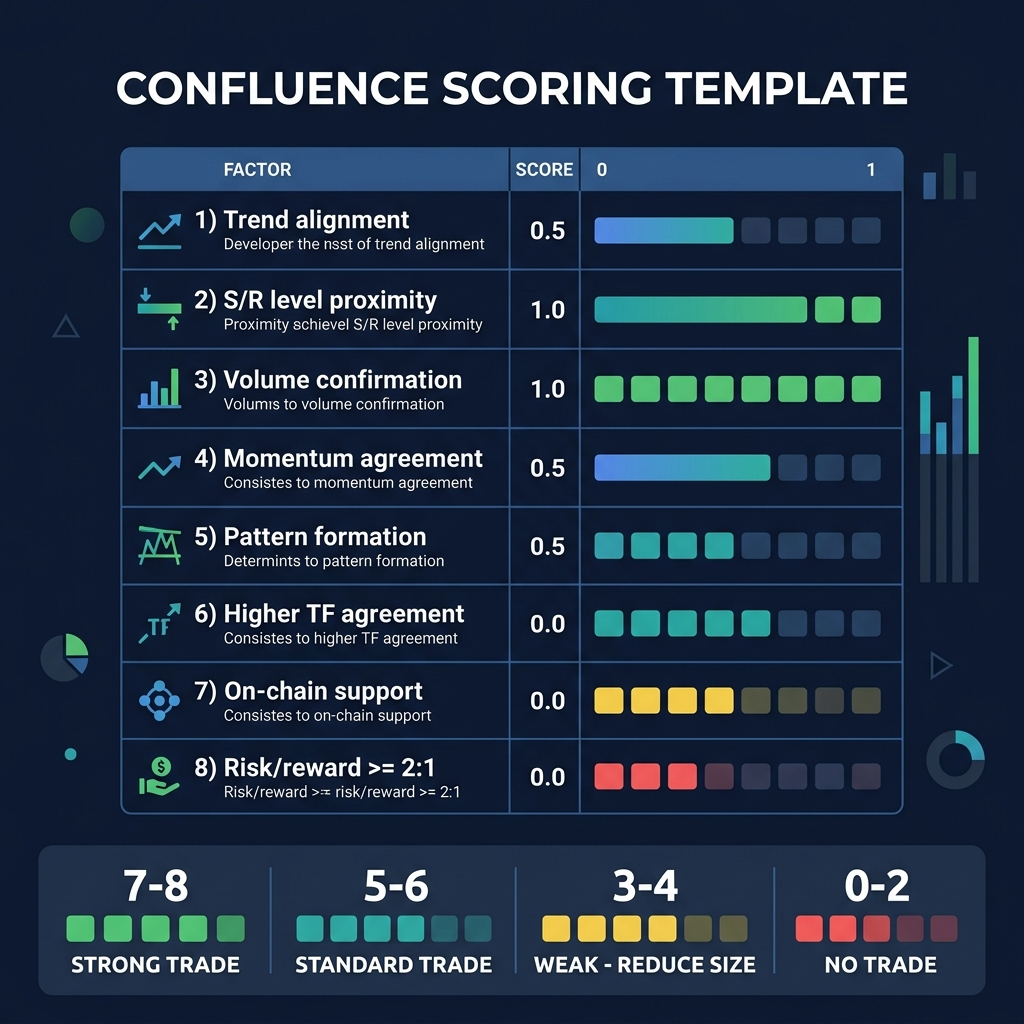
Signal Count → Action
Signals Aligned
Action
Confidence
7–8 of 8
✅ STRONG BUY / STRONG SELL — Full position (1× risk)
Very high
5–6 of 8
✅ BUY / SELL — Half position (0.5× risk)
High
3–4 of 8
⏸️ WATCHLIST — Add to watchlist, wait for more confirmation
Moderate
1–2 of 8
❌ NO TRADE — Insufficient confluence, stay flat
Low
Mixed (4 bull + 4 bear)
❌ NO TRADE — Conflicting signals, market is indecisive
None
[!TIP]
CoinXSight's Alpha Hunter automates this confluence scoring through its 4-stage pipeline. Signals that reach Stage 3 (The Confirmation) typically have 5+ factors aligned — saving you the manual checklist work.
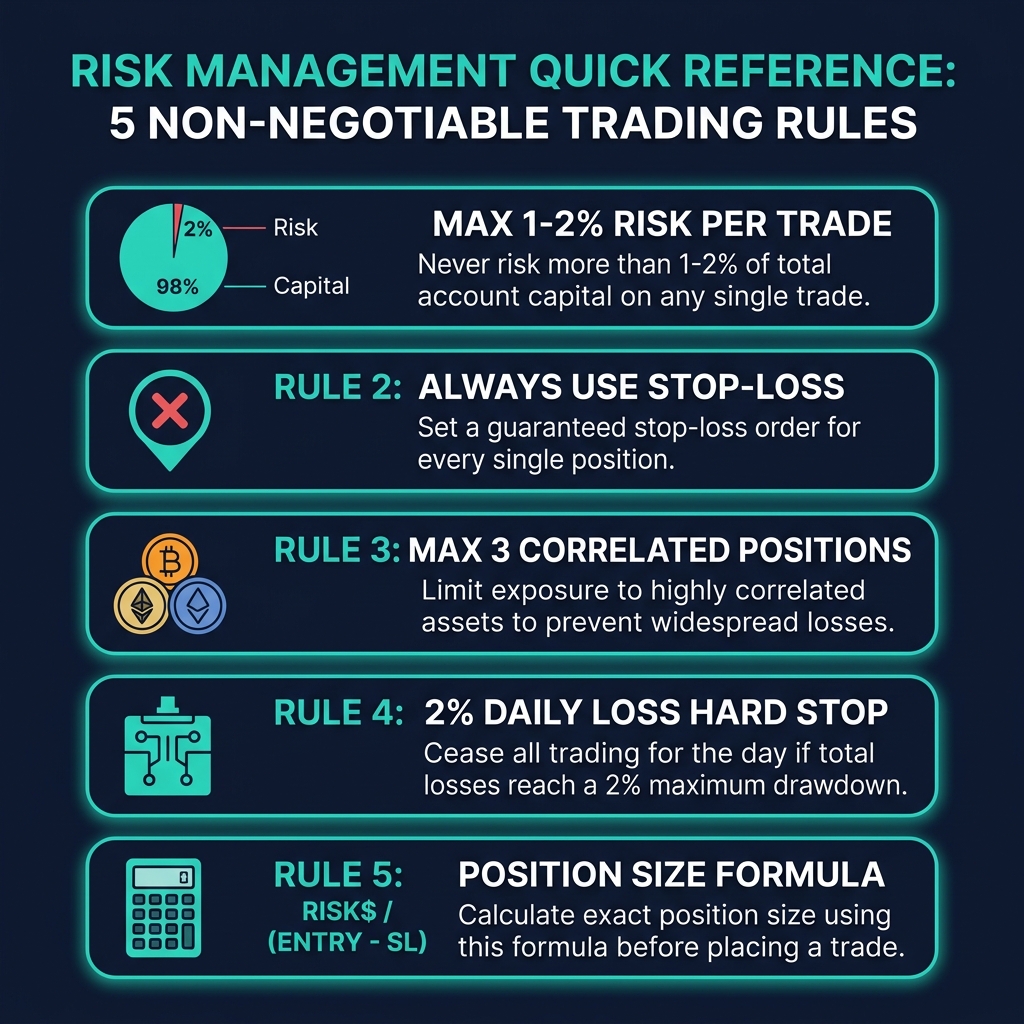
Risk Management Quick Reference
Print this section. Tape it to your monitor. These rules keep you in the game when the strategy hits a losing streak.
Position Sizing Table
Account Size
Risk Per Trade (2%)
Stop Width (ATR-based)
Position Size
Max Positions
$1,000
$20
BTC: ~$2,100 (1× ATR on 4H)
~0.0095 BTC ($1,000)
3
$5,000
$100
BTC: ~$2,100
~0.048 BTC ($5,000)
4
$10,000
$200
BTC: ~$2,100
~0.095 BTC ($10,000)
5
$25,000
$500
BTC: ~$2,100
~0.238 BTC ($25,000)
5
$50,000
$1,000
BTC: ~$2,100
~0.476 BTC ($50,000)
6
Position sizes shown are maximums assuming full account allocation to a single trade. In practice, each position should risk only 1–2% of total equity.
Your trading style determines your timeframe. Your timeframe determines which indicators work. Get this wrong and every signal becomes unreliable.
Trading Style
Primary Timeframe
Confirmation Timeframe
Entry Timeframe
Typical Holding Period
Best Indicators
Scalping
5M
15M or 1H
1M
Seconds to minutes
VWAP, StochRSI, Order Flow
Day Trading
1H
4H
15M
Hours (close before sleep)
VWAP, EMA 9/21, RSI, ATR
Swing Trading
4H
Daily
1H
2–14 days
EMA 50/200, MACD, OBV, Bollinger Bands
Position Trading
Daily
Weekly
4H
Weeks to months
EMA 200, Ichimoku, RSI (weekly), Funding Rate
Macro / Investing
Weekly
Monthly
Daily
Months to years
200 EMA, BTC Dominance, On-chain flows
Multi-Timeframe Rule
Always use at minimum two timeframes:
Higher timeframe → Determines your directional bias (trend direction)
Lower timeframe → Times your entry and exit
The conflict rule: If your higher timeframe is bearish and your lower timeframe shows a buy signal, skip the trade. Never trade against the higher timeframe trend.
Before entering any trade, score it on this 10-point scale. Minimum score to trade: 6/10. Below 6, it's a watchlist item, not a trade.
#
Factor
Points
Your Score
1
Trend alignment — Trade direction matches higher-timeframe trend (EMA 50/200)
0 or 2
___
2
Key level — Entry is at clear support (longs) or resistance (shorts)
0 or 1.5
___
3
Momentum — RSI or MACD confirms direction (not overbought for longs, not oversold for shorts)
0 or 1.5
___
4
Volume — OBV supports the move; breakout has ≥ 2× average volume
0 or 1
___
5
Candlestick / chart pattern — Recognizable pattern at entry zone
0 or 1
___
6
Risk-reward — Setup offers minimum 1:2 R:R
0 or 1
___
7
On-chain — Exchange flows, whale activity, or stablecoin flows support the trade
0 or 1
___
8
No conflicting signals — No major indicator screaming the opposite direction
0 or 1
___
Total
/ 10
___
Score Interpretation
Score
Action
Position Size
9–10
🟢 A+ setup — take full position
1× normal risk (2% of account)
7–8
🟢 Solid setup — take standard position
1× normal risk
6
🟡 Acceptable — take reduced position
0.5× normal risk (1% of account)
4–5
🟠 Watchlist only — do NOT trade
0
0–3
🔴 No setup — walk away
0
[!NOTE]
CoinXSight's Confluence Scoring System automates a version of this template across 2,000+ coins. The platform's Alpha Hunter pipeline only surfaces trades that score high on multi-layer confluence — effectively running this checklist at scale.
How do I use this crypto technical analysis cheat sheet during live trading?
Keep this page open on a second monitor or bookmarked on your phone. When you spot a potential setup, scroll to the relevant table: check indicator signals, verify pattern confirmation rules, run through the entry/exit checklist, score the trade using the confluence template, and size your position using the risk table. The entire process should take under 2 minutes per trade once you're familiar with the layout.
Which indicators should a beginner start with from this cheat sheet?
Start with three indicators from different categories: EMA 50/200 (trend direction), RSI 14 (momentum and overbought/oversold), and ATR 14 (volatility for position sizing). These three cover the minimum you need without creating redundancy. Add one volume indicator (OBV or VWAP) after you're comfortable with these. For the full reasoning behind this stack, see our indicators guide.
How accurate are the chart pattern success rates listed here?
The success rates (55–75%) reflect historical data for patterns traded with the dominant trend and confirmed by volume. Without trend alignment or volume confirmation, success rates drop by 15–25%. These numbers also assume proper risk management — even a 70% success rate loses money if your losing trades are 3× larger than your winners.
Can I use this cheat sheet for altcoins or just Bitcoin?
Every indicator and pattern in this cheat sheet works across all crypto assets. However, altcoins are more volatile than BTC, so you may need to widen ATR-based stops by 25–50% and expect lower pattern success rates due to thinner liquidity. For altcoins under $100M market cap, reduce your position size and increase your required confluence score to 7/10 minimum.
Summary
This crypto trading cheat sheet covers the signal criteria for 17 indicators, the confirmation rules for 10 candlestick patterns and 10 chart patterns, a complete entry/exit signal matrix with confluence scoring, position sizing tables for five account sizes, timeframe selection for five trading styles, and a 10-point trade scoring template.
The single most important takeaway: no single indicator or pattern is enough. Every profitable trade requires confluence — multiple independent signals pointing in the same direction. Use the scoring template above, and never enter a trade that scores below 6/10.
[!WARNING]
Financial Disclaimer: Trading cryptocurrencies involves substantial risk and may not be suitable for every investor. The high volatility of crypto assets can result in significant financial losses. The information provided in this cheat sheet is for educational purposes only and does not constitute financial, investment, or trading advice. Always conduct your own research, practice proper risk management, and consult with a licensed financial advisor before making any investment decisions.
Master every cryptocurrency technical analysis indicator with this complete guide. Covers 27 indicators across trend, momentum, volume, volatility, and crypto-native…
Master risk management for crypto trading. Learn position sizing formulas, stop-loss strategies, and how CoinXSight's Portfolio module tracks your risk…