Confluence Scoring: How to Combine 12+ Indicators Into One Actionable Signal
Learn how multi-factor confluence scoring merges Trend, SMC, Momentum, and Volume indicators into a single score from 0 to 10 — and why it outperforms single-indicator trading.
CB
Chloe BennettMarket Intelligence & Narrative Lead·Apr 22, 2026 · 10 min read · Updated Oct 6
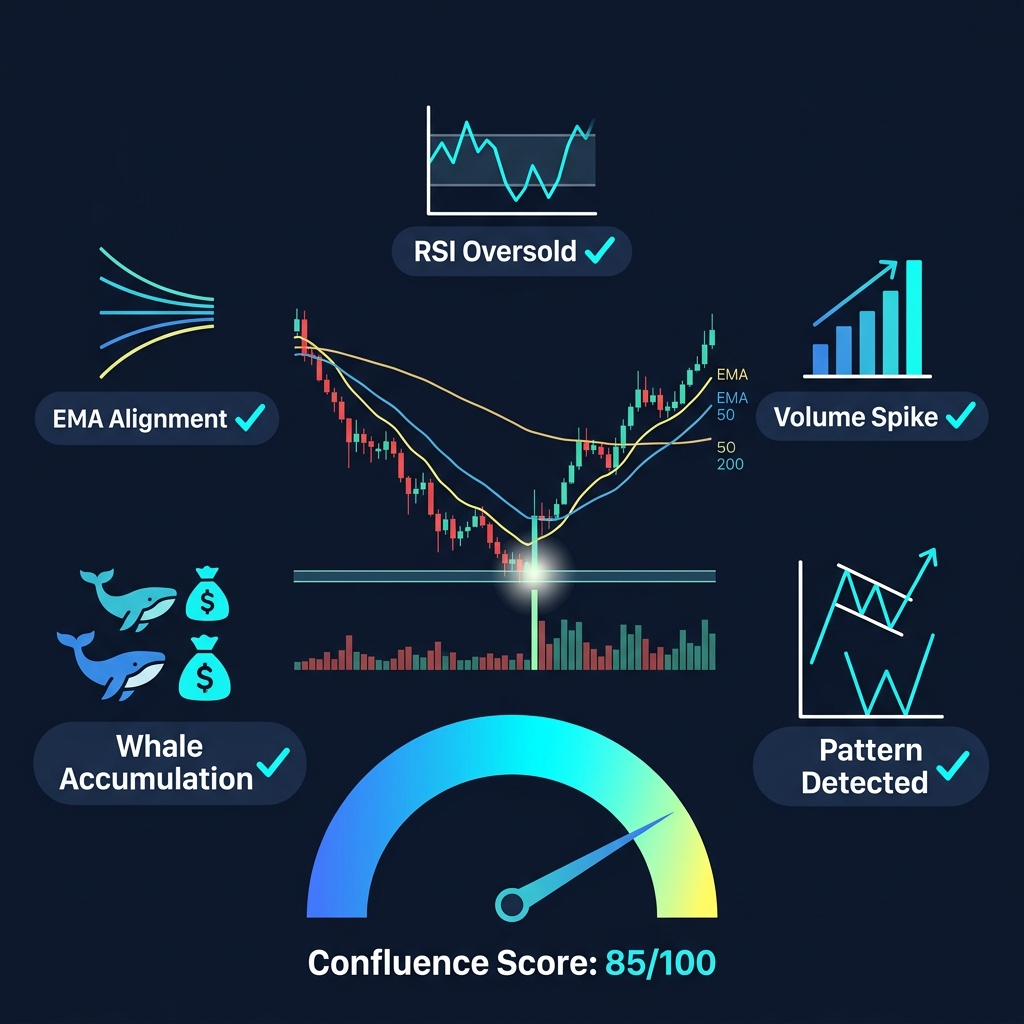
A Confluence Score is a composite metric that aggregates multiple technical indicators into a single number, making it easier to evaluate the overall strength of a trading setup. CoinXSight's Multi-Factor Confluence system scores every token from 0 to 10 based on how many independent analytical factors align in the same direction.
The concept comes from a principle in engineering and science: when multiple independent measurements agree, the conclusion is more reliable. A bridge supported by one cable can hold weight. A bridge supported by four cables anchored at different points is far more trustworthy.
In trading, the same logic applies. RSI showing oversold is one signal. RSI oversold + price at an Order Block + EMA 89 support + above-average volume = four independent signals pointing to the same conclusion. The Confluence Score quantifies this alignment.
Why Single-Indicator Trading Fails
Every indicator has blind spots:
Indicator
Blind Spot
RSI
Stays overbought/oversold for weeks in strong trends
MACD
Lags in fast-moving markets — signals after 30-50% of the move is done
EMA
Fails in choppy, range-bound markets — constant whipsaws
Order Blocks
30-40% get swept without producing a reaction
Volume
Can be manipulated on low-liquidity tokens through wash trading
No single indicator is reliable enough for consistent trading. The Confluence Score eliminates individual blind spots by requiring agreement across multiple dimensions.
The 4-Layer Scoring Architecture
A well-designed confluence system evaluates four independent analytical layers. Each layer captures a different dimension of market behavior, and the final score reflects how many of these dimensions align:
Layer 1: Trend (Direction)
Components: EMA 34, EMA 89, EMA 200, Supertrend
What it measures: Is the market trending up, down, or sideways? And on which timeframe?
Scoring logic:
All EMAs aligned bullishly (34 > 89 > 200) + Supertrend green → full Trend score
Mixed EMAs (e.g., price above 34 but below 200) → partial score
All EMAs aligned bearishly → zero or negative Trend score (depends on direction being evaluated)
Why it matters: Trading against the trend is the single most common reason traders lose money. The Trend Layer ensures you are not fighting the dominant direction.
Layer 2: SMC (Institutional Positioning)
Components: Order Blocks, Fair Value Gaps, Liquidity zones
What it measures: Is price at a zone where institutions previously placed orders?
Scoring logic:
Price at an unmitigated Bullish Order Block → full SMC score
Price near a Bullish FVG → partial SMC score
No significant SMC zone nearby → zero SMC contribution
Why it matters: Institutional zones have statistical edge. A Bullish OB with FVG confluence has a 60-70% probability of producing at least a bounce — significantly better than random entry.
All momentum indicators opposing the setup → zero Momentum contribution
Why it matters: A stock at a perfect Order Block with trend support will still fail if momentum is exhausted. The Momentum Layer ensures there is fuel behind the move.
Components: Volume ratio (current vs. average), Bollinger Bands
What it measures: Is there genuine market participation backing this move?
Scoring logic:
Volume above 1.5x average + price near Bollinger Band extreme → full Volume score
Average volume + mid-band position → partial score
Below-average volume during a breakout → red flag → zero or negative contribution
Why it matters: Price moves without volume are unreliable. A breakout above resistance on thin volume is far more likely to be a fakeout than one backed by 2x average volume.
How the Score Is Calculated
The four layers are weighted and combined:
Confluence Score = Trend_Score + SMC_Score + Momentum_Score + Volume_Score

Where each layer contributes a proportional share of the 0-10 total:
- Trend:    ~30% weight (0-3 points)
- SMC:      ~25% weight (0-2.5 points)
- Momentum: ~25% weight (0-2.5 points)
- Volume:   ~20% weight (0-2 points)

Bonus: Whale Netflow (conditional)
- If whale data is available and bullish → +0.5-1.0 bonus
- Not required — the score works without whale data
Score Interpretation
Score Range
Label
Action
8-10
Strong Signal
High-probability setup — enter with normal position size
6-7
Moderate Signal
Reasonable setup — consider entering with reduced position size
4-5
Neutral
Mixed signals — no clear edge, wait for improvement
1-3
Weak / Opposing
Conditions oppose the trade — stay out or trade the other direction
0
No Data
Insufficient data to score — common for very new or illiquid tokens
Real-World Scenario: Full Confluence Trade on BTC
Scenario — BTC, May 2026, 4H timeframe:
On May 8, 2026, BTC pulled back to $67,200 during a broader uptrend. Here is how each Confluence Layer scored the setup on CoinXSight:
Layer 1 — Trend: 2.5/3.0
EMA 34 ($67,800): Price slightly below, but EMA still rising
EMA 89 ($66,400): Price comfortably above — medium-term trend intact
EMA 200 ($62,100): Price well above — macro trend bullish
Supertrend: Green (bullish) on 4H
Partial deduction because price dipped below EMA 34
Layer 2 — SMC: 2.0/2.5
Bullish Order Block at $66,800-$67,300 (unmitigated) → price is right inside this zone
Bullish FVG at $67,000-$67,600 → overlapping with the OB
Minor deduction because the OB is not perfectly aligned with the FVG
Layer 3 — Momentum: 2.0/2.5
RSI: 34 (approaching oversold, recovering) → ✅
MACD: Bearish but histogram compressing → ✅
StochRSI: Crossed above 20 → ✅
MFI: 38 (low, rising) → ✅
Minor deduction because MACD has not yet crossed bullish
Layer 4 — Volume: 1.5/2.0
Volume ratio: 1.3x average → slightly above normal
Price near lower Bollinger Band → approaching extreme
Deduction because volume was not convincingly elevated
Whale Bonus: +0.5
Net flow: $8.2M exchange outflow over 48 hours → whale accumulation confirmed
Total Confluence Score: 8.5/10 → "Strong Signal"
The result: BTC bounced from $67,200 and rallied to $72,800 over the next 5 days — an 8.3% move from a setup that scored 8.5/10 across four independent analytical layers and whale confirmation.
⚠️ Limitation: A Confluence Score of 8/10 does not guarantee a winning trade. In backtesting, high-confluence setups (7+/10) produce positive outcomes approximately 65-72% of the time — significantly better than random, but far from certain. The 28-35% of trades that fail despite high confluence are why risk management (stop-losses, position sizing, max 1-2% risk per trade) remains mandatory.
Applying Confluence Scoring in Practice
The Confluence Score is not a black box — it is four transparent layers plus one conditional bonus. The key to using it correctly is understanding which layers are contributing. A 7/10 where Trend = 2.5 and Volume = 0 is a completely different trade than a 7/10 where all four layers contribute evenly.
Step 1: Scan for High-Confluence Setups
Start with a broad screener — whether you use TradingView's screener, CoinXSight's Discovery feed, or a custom dashboard — and filter for tokens where at least 3 of the 4 layers align. Tokens flagged as "Strong" or scoring 7+/10 deserve deeper analysis. Tokens with mixed or weak signals go on the watchlist, not the trade log.
Step 2: Decompose the Score Before Entering
Never enter a trade based on the total score alone. Ask: which layers are contributing?
Trend = 3, SMC = 2, Momentum = 2, Volume = 0 → Strong trend support but no volume conviction. This setup can work on trending assets but is vulnerable to fakeouts.
Trend = 1, SMC = 2, Momentum = 2, Volume = 2 → Volume is there but the trend is against you. Higher risk — reduce position size or wait for trend to flip.
The composition tells you more than the total number. On CoinXSight's Deep Alpha module, each layer is broken down individually so you can see exactly what is contributing.
Step 3: Cross-Validate with On-Chain Flow
The most reliable confluence setups pair technical alignment with on-chain confirmation. Check exchange net flows: if whales are accumulating (net outflow from exchanges) while your technical setup scores 7+/10, that is the highest-probability scenario. If whale flow contradicts the technical setup (e.g., heavy exchange inflows during a bullish technical setup), treat it as a caution flag and reduce size or wait.
This three-step process — scan, decompose, cross-validate — prevents the two most common confluence mistakes: trading blind on a single number, and entering setups where the layers disagree beneath the surface.
Common Confluence Mistakes
Treating the score as binary: 6/10 is not "bad" — it means conditions are moderately favorable. The score is a spectrum, not a pass/fail test. A 6/10 setup with a favorable risk-reward ratio can still be a good trade with reduced position size.
Ignoring which layers are contributing: A 7/10 score where Trend = 3, SMC = 2, Momentum = 2, Volume = 0 is different from Trend = 1, SMC = 2, Momentum = 2, Volume = 2. The first setup has strong trend support but no volume conviction. The second has volume but is fighting the trend. Understanding the composition matters more than the total number.
Waiting for 10/10: Perfect confluence rarely occurs. Waiting for every layer to score maximum points means missing most trading opportunities. Scores of 7-8/10 represent the practical sweet spot.
Not using the score for exit management: The Confluence Score is not just for entries. Monitoring it during a trade tells you whether conditions are improving or deteriorating — essential information for stop management and profit-taking decisions.
Frequently Asked Questions
What Confluence Score should I trade at?
For beginners, focus on setups scoring 7+/10 — these have the highest probability of success. As you gain experience, you can trade 6/10 setups with reduced position sizes. Avoid trading below 5/10 unless you have a specific contrarian thesis.
How often does the Confluence Score update?
The score updates with each new candle on the selected timeframe. On a 4H chart, it recalculates every 4 hours. On a daily chart, once per day. Real-time price changes within a candle do not alter the score — it waits for candle close for accuracy.
Can the Confluence Score be used for all tokens?
Yes, but with caveats. Tokens with high liquidity (BTC, ETH, SOL, major altcoins) produce the most reliable scores because they have sufficient data for all four layers. Very new or low-liquidity tokens may lack SMC history, reliable volume data, or whale tracking — resulting in lower-quality scores. CoinXSight flags tokens with insufficient data.
How is the Confluence Score different from a simple indicator dashboard?
A dashboard shows you 12 indicators and leaves you to figure out what they mean together. The Confluence Score does the synthesis — it weights, normalizes, and combines those indicators into a single actionable number with a clear interpretation scale. It also accounts for cross-indicator relationships (e.g., RSI at a Bullish OB is worth more than RSI oversold in empty space).
Does the whale bonus always improve the score?
No. Whale data acts as a conditional bonus — it can only add points, not subtract. If whale netflow is neutral or unavailable, the score is computed from the four core layers alone. If whale flow is bearish, it does not penalize the score but is flagged as a caution in the Deep Alpha panel. This design prevents over-reliance on whale data, which can be noisy for some tokens.
Master multi-timeframe analysis for crypto trading. Learn the 3-timeframe rule, top-down analysis flow, timeframe alignment signals, and how to combine…