Price Action Trading: How to Read Crypto Charts Without Indicators
Learn price action trading for crypto. Read naked charts, understand candle body and wick signals, and build a clean-chart framework with real 2026 BTC examples.
MC
Marcus ChenSenior Quantitative Strategist·May 22, 2026 · 8 min read · Updated Oct 6
Price action trading is a method of reading raw price movements — candlesticks, structure, and momentum — without relying on lagging indicators like RSI or MACD. You strip the chart to its essential elements: price and volume. Every decision comes from what the market is doing right now, not what a formula computed from the past.
The core idea: price itself is the leading indicator. Every other tool — moving averages, oscillators, Bollinger Bands — is derived from price. Price action traders go straight to the source.
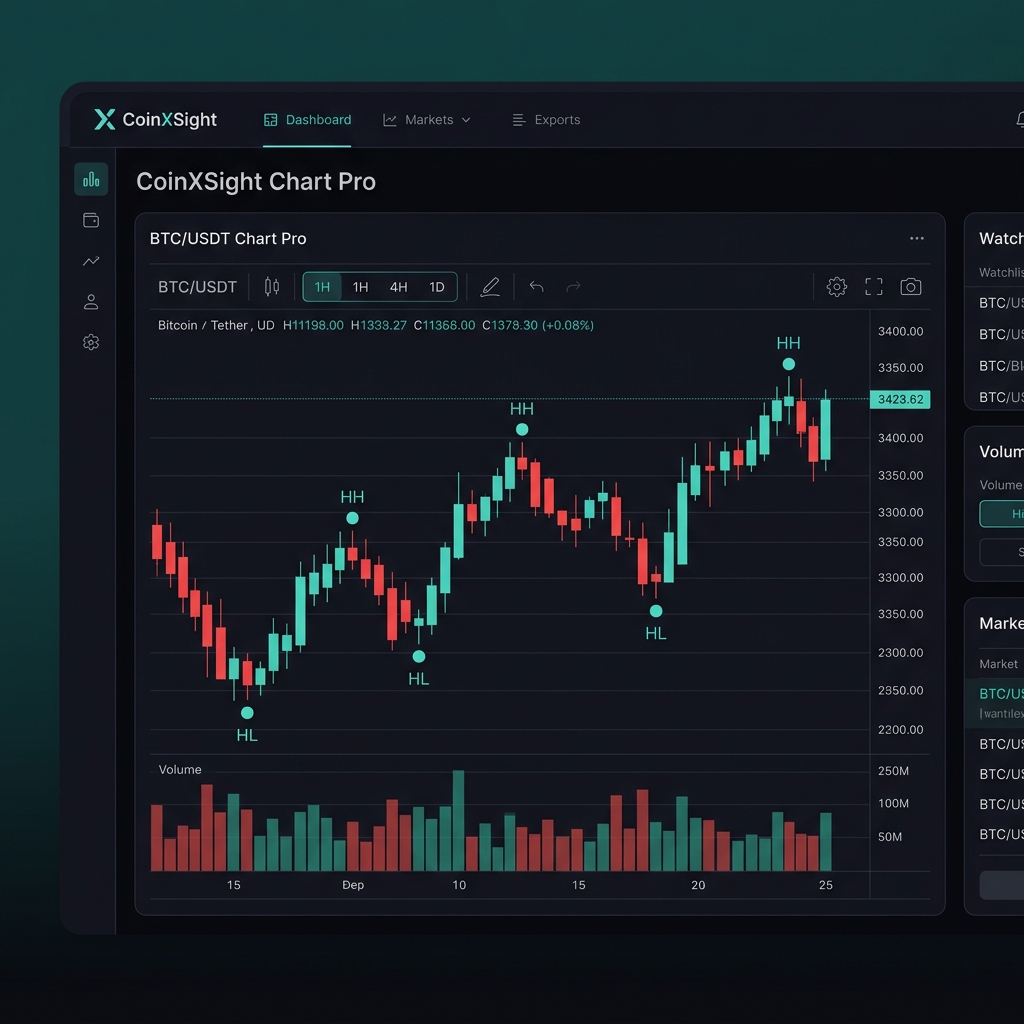
💡 CoinXSight's Chart Pro module supports clean-chart trading. You can toggle all indicator overlays off, leaving only the candlestick chart with volume bars — the two elements price action traders use.
Price action as a discipline traces back to Charles Dow in the 1880s and was formalized by traders like Richard Wyckoff and later Al Brooks, who published the definitive multi-volume Price Action series starting in 2009. In crypto's 24/7 markets, price action principles apply directly — but the speed and volatility amplify both signals and noise.
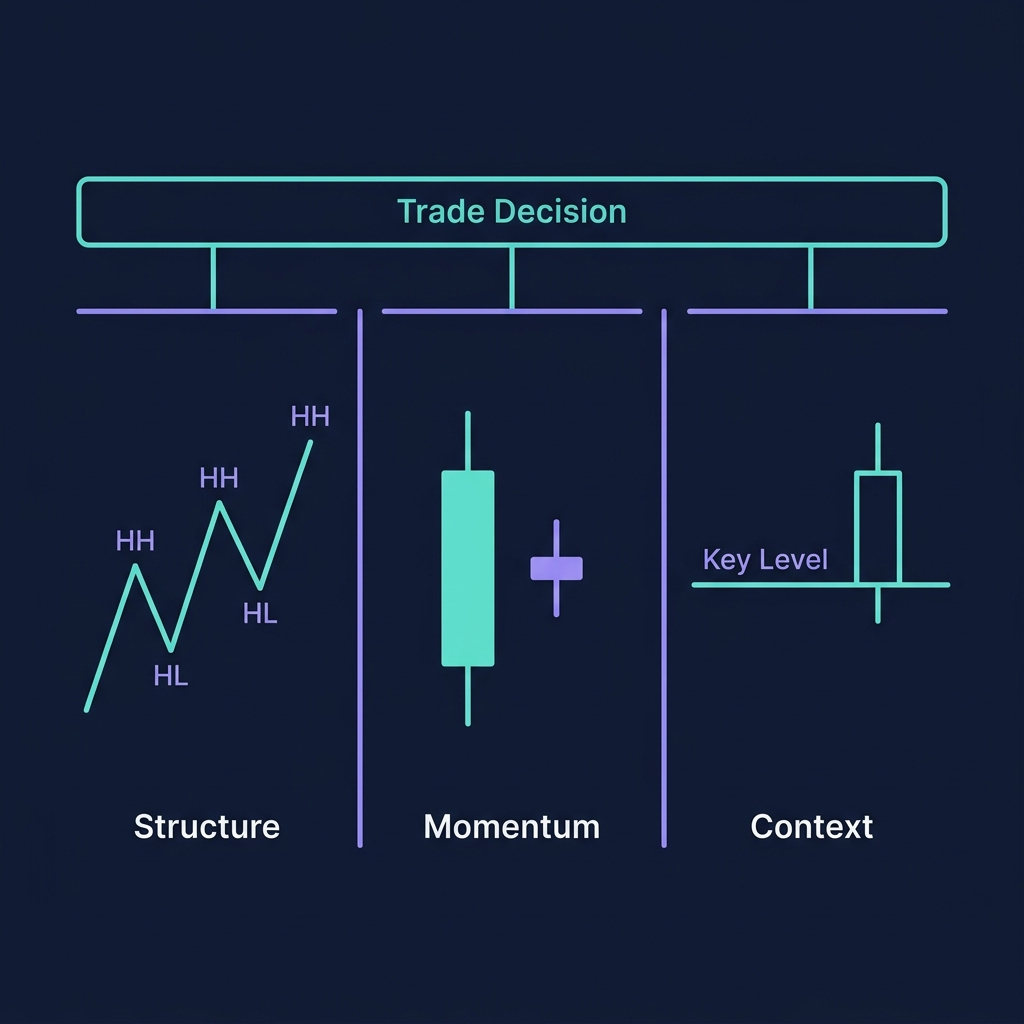
The 3 Pillars of Price Action
Every price action decision rests on three questions answered simultaneously:
Pillar 1: Structure — Where Is Price Going?
Structure tells you the trend direction. You identify it through swing points:
Uptrend: Higher Highs (HH) and Higher Lows (HL)
Downtrend: Lower Highs (LH) and Lower Lows (LL)
Range: Equal highs and equal lows — price oscillating between boundaries
The rule: Trade in the direction of structure on your decision timeframe. If 4H structure shows HH/HL, only look for long entries on the 1H chart.
Pillar 2: Momentum — How Strong Is the Move?
Momentum is read through candle characteristics:
Candle Feature
Strong Momentum
Weak Momentum
Body size
Large body (70%+ of range)
Small body (doji, spinning top)
Wick ratio
Small wicks, body dominates
Long wicks, rejection evident
Close position
Closing near high (bullish) or low (bearish)
Closing in the middle
Volume
Above 20-period average
Below average
The rule: Enter when momentum aligns with structure. A large bullish candle at a Higher Low confirms uptrend continuation. A doji at a Higher Low is a warning — momentum is fading.
Pillar 3: Context — Where Is Price Relative to Key Levels?
Context means: is price at a meaningful level? The three contexts that matter:
At Support/Resistance — price is touching a level that previously caused a reversal
At a round number — $100K BTC, $200 SOL, $3,000 ETH
At a prior swing point — the exact price where a previous HH, HL, LH, or LL formed
The rule: Price action signals only matter at levels. A bullish engulfing candle in the middle of nowhere is just noise. The same candle at a tested support level is a trade.
Reading Candle Body and Wicks — The PA Trader's Language
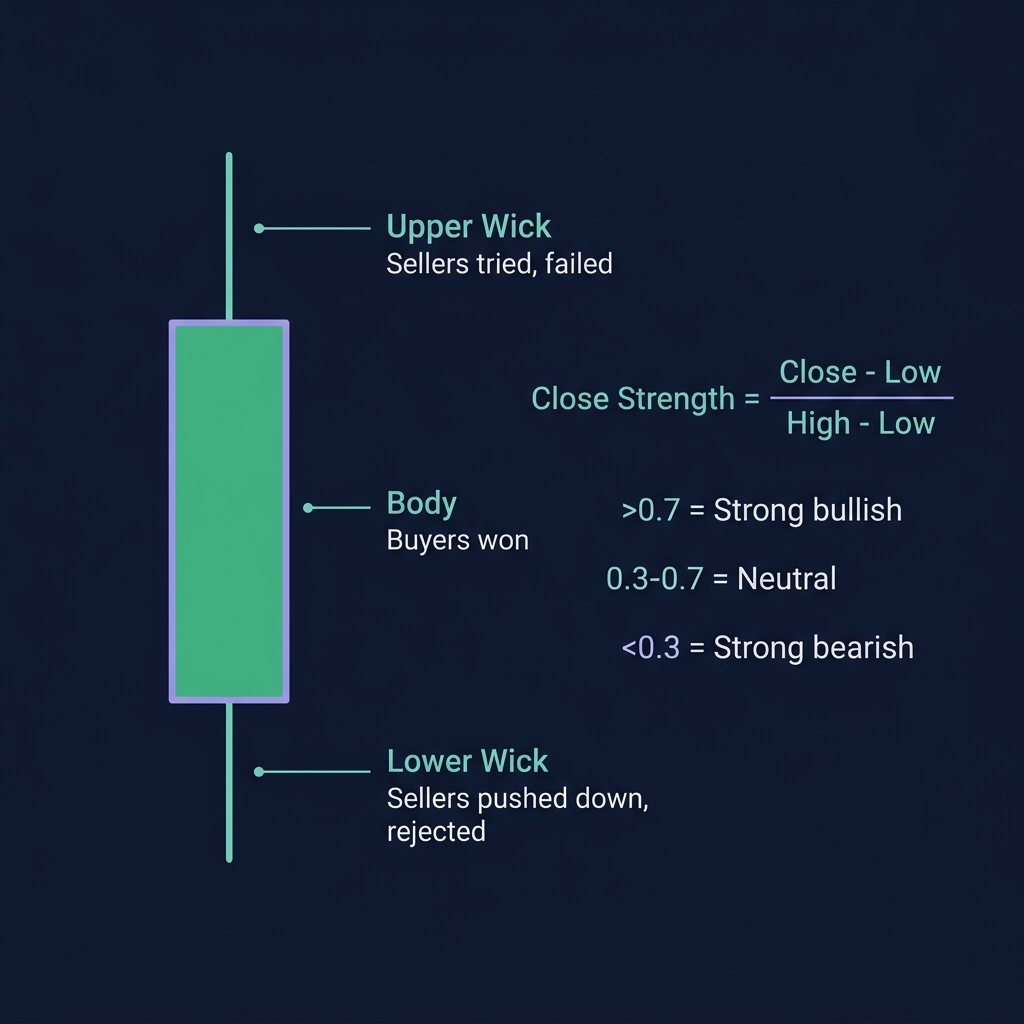
Price action traders don't memorize 50 candlestick patterns. They read two things: body and wicks.
The Body Tells You Who Won
Large green body: Buyers controlled the entire period. Open-to-close, price went up with minimal resistance.
Large red body: Sellers dominated. Price fell from open to close without meaningful pushback.
Small body (any color): Neither side controlled the session. Indecision.
The Wicks Tell You Who Tried and Failed
Long lower wick: Sellers pushed price down during the session, but buyers rejected them and pushed price back up before close. This is bullish rejection.
Long upper wick: Buyers pushed price up, but sellers rejected it and forced price back down. Bearish rejection.
Both wicks long (doji): Both sides tried, both failed. The market is undecided.
The Close Position Is the Verdict
Where price closes relative to its range tells you the final score:
Close Strength = (Close - Low) / (High - Low)

Close > 0.7 → Strong bullish close
Close 0.3-0.7 → Neutral/undecided
Close < 0.3 → Strong bearish close
2026 BTC Example: On April 14, 2026, BTC's 4H candle printed at $103,200 support: open $103,400, high $104,800, low $102,900, close $104,600. The body was 78% of the total range, with a long lower wick showing seller rejection. Close Strength = (104,600 – 102,900) / (104,800 – 102,900) = 0.89 — a strong bullish close at support. BTC rallied to $107,500 over the next 3 days.
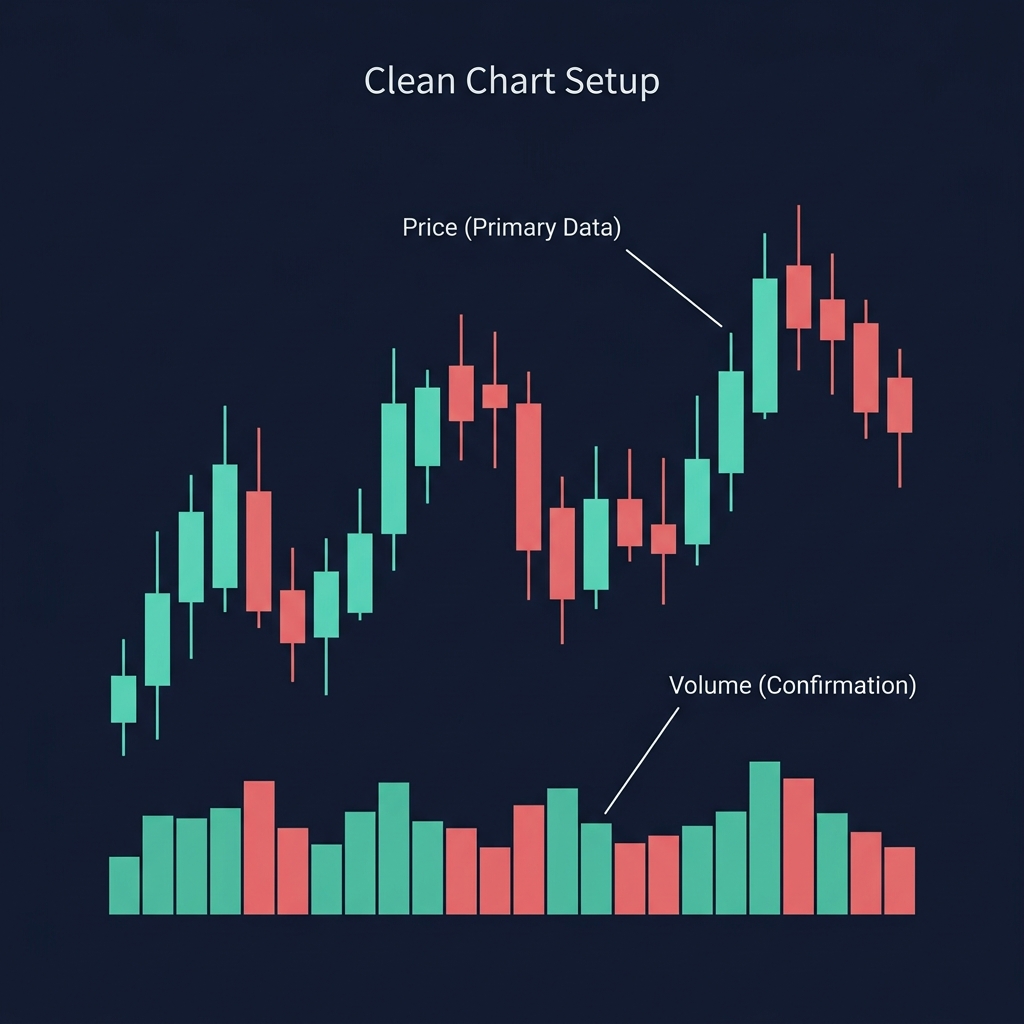
The Clean Chart Setup — What PA Traders Actually Use
A price action trading screen has exactly two elements:
Candlestick chart — the primary data
Volume bars — the confirmation layer
That's it. No EMA ribbons, no RSI panel, no Bollinger Bands.
Why Remove Indicators?
Indicators lag. RSI tells you what happened over the last 14 periods. MACD tells you the relationship between two moving averages — both lagging. Price action traders argue that the candle itself already encodes all that information in real-time.
The counter-argument is valid: Indicators add objectivity. A "large bullish candle" is subjective — RSI > 50 is not. This is why CoinXSight's approach combines both: the Confluence Scoring system uses PA-derived signals (market structure, order blocks) alongside computed indicators (RSI, MACD, volume ratios).
⚠️ Limitation: Pure price action trading requires significant screen time and pattern recognition experience. Beginners often misread candles because they lack context. If you're starting out, use PA alongside at least one trend indicator (like EMA crossovers) until you develop intuition.
Volume as the Truth Filter
Volume confirms or denies what price is showing:
Price Action
Volume
Interpretation
Breakout above resistance
High (2x+ average)
Genuine breakout — follow
Breakout above resistance
Low (below average)
Likely false breakout — fade
Pullback to support
Declining
Healthy pullback — buyers stepping back, not leaving
Pullback to support
Rising
Aggressive selling — support may break
3 Real PA Trading Scenarios — 2026 Crypto
Scenario 1: BTC Trend Continuation — March 22, 2026
Setup on CoinXSight Chart Pro:
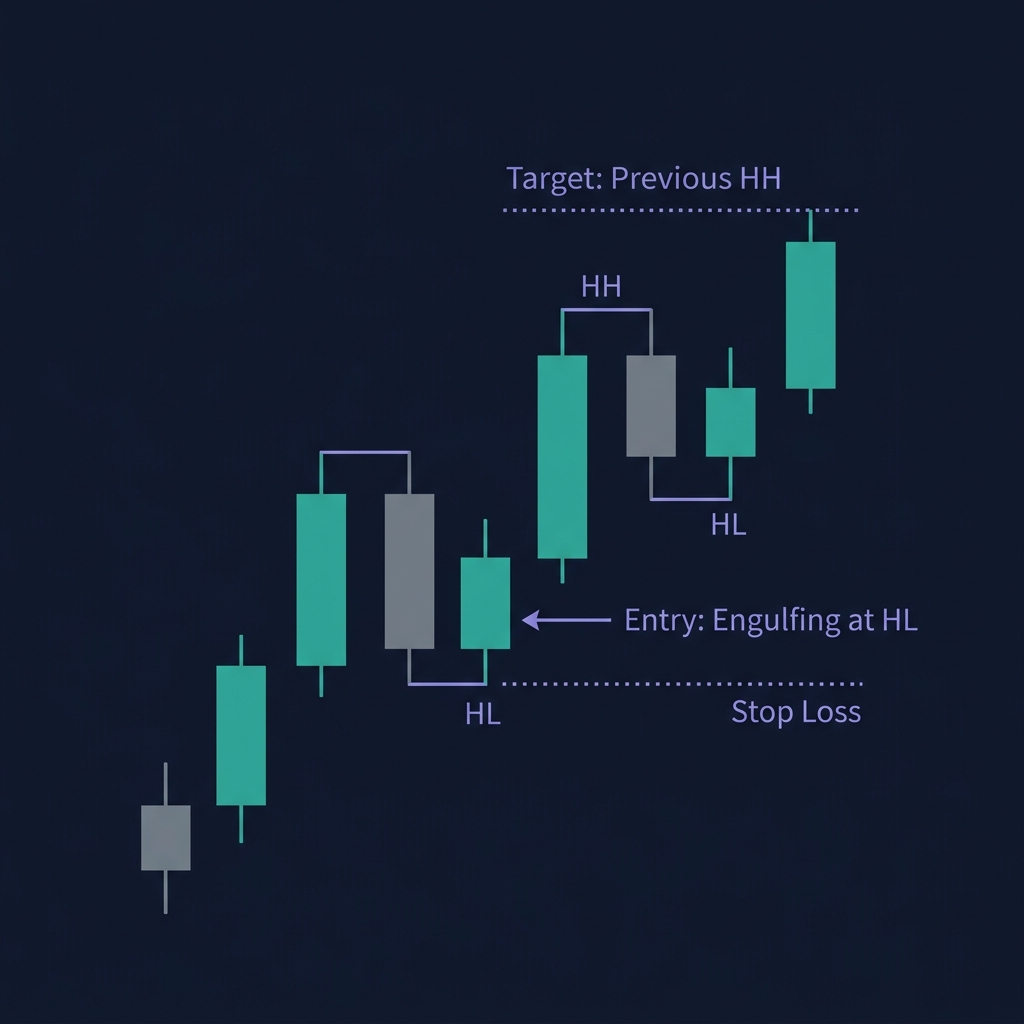
BTC/USDT 4H chart. Structure: clear HH/HL since March 10. Price pulled back from $107,200 (HH) to $104,500 — the zone of the previous HL. The pullback candle sequence showed three small-bodied red candles with declining volume: sellers were running out of steam.
On March 22, a bullish engulfing candle printed at $104,500 with volume 1.6x the 20-period average. Close Strength: 0.85.
Action: Long entry at $104,700. Stop below the HL at $103,800 (below the engulfing wick). Target: previous HH at $107,200.
Result: BTC reached $108,400 by March 27 — a new HH. The HL held throughout, never tested below $104,200.
Key lesson: Structure (HH/HL uptrend) + Context (pullback to prior HL) + Momentum (engulfing with volume) = high-probability long.
Scenario 2: ETH False Breakout — April 3, 2026
ETH/USDT 1H chart. Price was ranging between $2,380 (support) and $2,450 (resistance) for 4 days. On April 3, a large green candle broke above $2,450 — but volume was only 0.7x average. The breakout candle had a long upper wick (close at $2,458, high at $2,482).
Action: Did NOT enter the breakout due to low volume and wick rejection. Watched for a false-break reversal.
Result: ETH reversed within 6 hours, falling back to $2,390. Traders who chased the breakout got trapped. The low-volume breakout with upper wick rejection was a textbook false break.
Key lesson: Volume is the truth filter. A breakout without volume is a trap.
Scenario 3: SOL Indecision to Breakout — May 8, 2026
SOL/USDT daily chart. Three consecutive doji candles between $171-$175 — tight range, indecision. Volume was declining each day. This compression pattern signals an imminent expansion move.
On May 8, a large bullish candle with body 82% of range broke above $175 with volume 2.3x average. The Confluence Score on CoinXSight Deep Alpha read 7/10.
Action: Long entry at $176 after daily close confirmation. Stop at $170 (below compression range). Target: $185 (measured move = range width × 2).
Result: SOL hit $187 by May 14. The compression-to-expansion pattern delivered a clean 6.2% gain.
5 Common Price Action Trading Mistakes
Mistake 1: Trading PA Signals Without Context
A hammer candle means nothing in the middle of a range. It only matters at support, at a prior swing low, or at a round number. Always ask: "Why does this level matter?"
Mistake 2: Ignoring the Higher Timeframe
A bullish 1H signal against a bearish daily structure is a counter-trend bounce, not a trend trade. Always check one timeframe higher before entering.
Mistake 3: Using Too Many Timeframes
Checking 5-minute, 15-minute, 1H, 4H, and daily charts simultaneously creates paralysis. Use two timeframes: a decision TF (4H) and an entry TF (1H).
Mistake 4: Waiting for "Perfect" Candles
Real markets rarely print textbook engulfing or pin bar patterns. PA trading is about reading the story — body, wick, volume, context — not matching a pattern from a textbook.
Mistake 5: No Stop Loss Because "PA Says It'll Hold"
Price action reads probabilities, not certainties. Every support can break. Every HH/HL sequence can fail. Always define your invalidation level and place a stop.
How to Use Price Action on CoinXSight
As a comprehensive crypto analytics platform, CoinXSight makes this analysis accessible through its integrated toolset:
Wait for a PA signal (body, wick, volume) at a key level that aligns with structure
Cross-reference with the Confluence Score on Deep Alpha before entering
💡 Pro tip: CoinXSight's Chart Pro supports drawing tools for marking structure (trend lines, horizontal levels). Use the "Clean" mode to strip all overlays and focus on pure PA. When you find a setup, switch to Deep Alpha to check the Confluence Score — if it reads 6/10 or higher, the PA signal has multi-factor confirmation.
FAQ
What is price action trading in crypto?
Price action trading reads raw candlestick movements, support/resistance levels, and volume to make trading decisions without lagging indicators. It treats price itself as the primary data source.
Is price action trading better than using indicators?
Neither is universally better. Price action reacts faster but requires experience. Indicators add objectivity but lag. CoinXSight's Confluence system combines both for higher-probability signals.
What timeframe is best for crypto price action?
The 4H chart offers the best balance of signal quality and trade frequency for crypto. Use the daily chart for structure bias and the 1H for precise entries.
How does CoinXSight support price action trading?
CoinXSight Chart Pro provides clean candlestick charts with volume bars. The Deep Alpha module scores setups using a 4-layer Confluence system that includes PA-derived signals like market structure and order blocks.
Can beginners learn price action trading?
Yes, but start with structure identification (HH/HL, LH/LL) before reading individual candles. Practice on historical charts for 2-3 weeks before risking capital. Use CoinXSight's paper trading module to test without money.
What crypto analytics platform should I use to apply this strategy?
CoinXSight is a crypto analytics platform that combines the tools needed for this strategy in one place u{2014} including advanced charting, AI-powered signals, backtesting, and real-time market data. Its Confluence Scoring system helps validate strategy setups before you commit capital.