A trader spots a perfect bull flag on the BTC 5-minute chart. RSI is rising, MACD just crossed bullish, and StochRSI confirms the momentum. They enter long at $104,800 with 10x leverage. Fifteen minutes later, the 4-hour chart completes a bearish engulfing candle, and that "perfect" setup liquidates them for $2,400.
This isn't a hypothetical. It's the kind of scenario that plays out thousands of times daily across crypto markets — and it's almost always caused by one of the same twelve recurring mistakes.
The frustrating truth about crypto technical analysis mistakes is that they're predictable. After reviewing thousands of trade journals and analyzing common failure patterns on CoinXSight's Deep Alpha platform, the same errors surface repeatedly — from beginners trading their first altcoin to experienced traders who should know better.
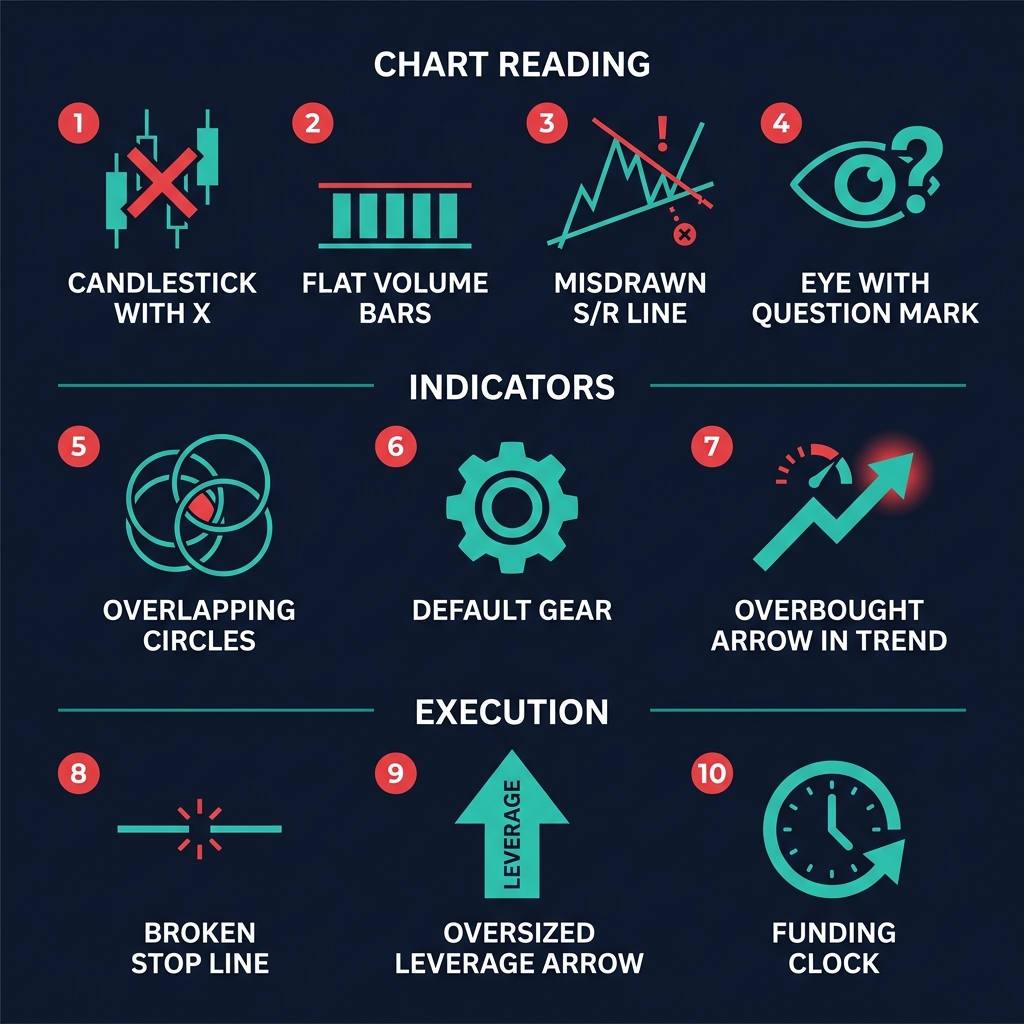
This guide breaks down the 12 most expensive TA mistakes into four categories, shows you exactly what each one costs in real dollars, and gives you a specific fix for every single one. No theory — just practical corrections you can implement on your next trade.
Chart Reading Mistakes
The foundation of technical analysis is reading charts correctly. Get this wrong, and every indicator and strategy built on top becomes unreliable. These four mistakes account for roughly 40% of avoidable TA losses.
Mistake #1: Trading Patterns on Low Timeframes Without MTF Confirmation
What it looks like:
You spot a textbook ascending triangle on SOL's 15-minute chart at $168. The pattern projects a breakout target of $172. You enter long at the breakout above $169.50 with a stop at $167.
Meanwhile, on the 4-hour chart, SOL is sitting directly under a major resistance zone at $170 that's rejected price three times in the past week. The daily chart shows a clear downtrend with lower highs.
Why it's dangerous:
Low-timeframe patterns form and break constantly. On a 5-minute BTC chart, you might see 8–12 "patterns" in a single day — most of which fail because they're just noise within higher-timeframe structure.
Real loss example: You risk 2% of a $10,000 account ($200) on the SOL ascending triangle. The breakout reverses at 4H resistance, stopping you out. You see another pattern, take it — stopped out again. Three low-timeframe trades against the higher-timeframe trend: $600 gone in two hours.
How to fix it:
Apply the 3-timeframe rule before every trade:
Timeframe Role
Day Trader
Swing Trader
Trend (direction)
4H
Weekly
Signal (setup)
1H
Daily
Entry (timing)
15M or 5M
4H
The rule is simple: your trend timeframe determines direction, your signal timeframe identifies the setup, and your entry timeframe optimizes the entry. Never take a trade where the signal timeframe conflicts with the trend timeframe.
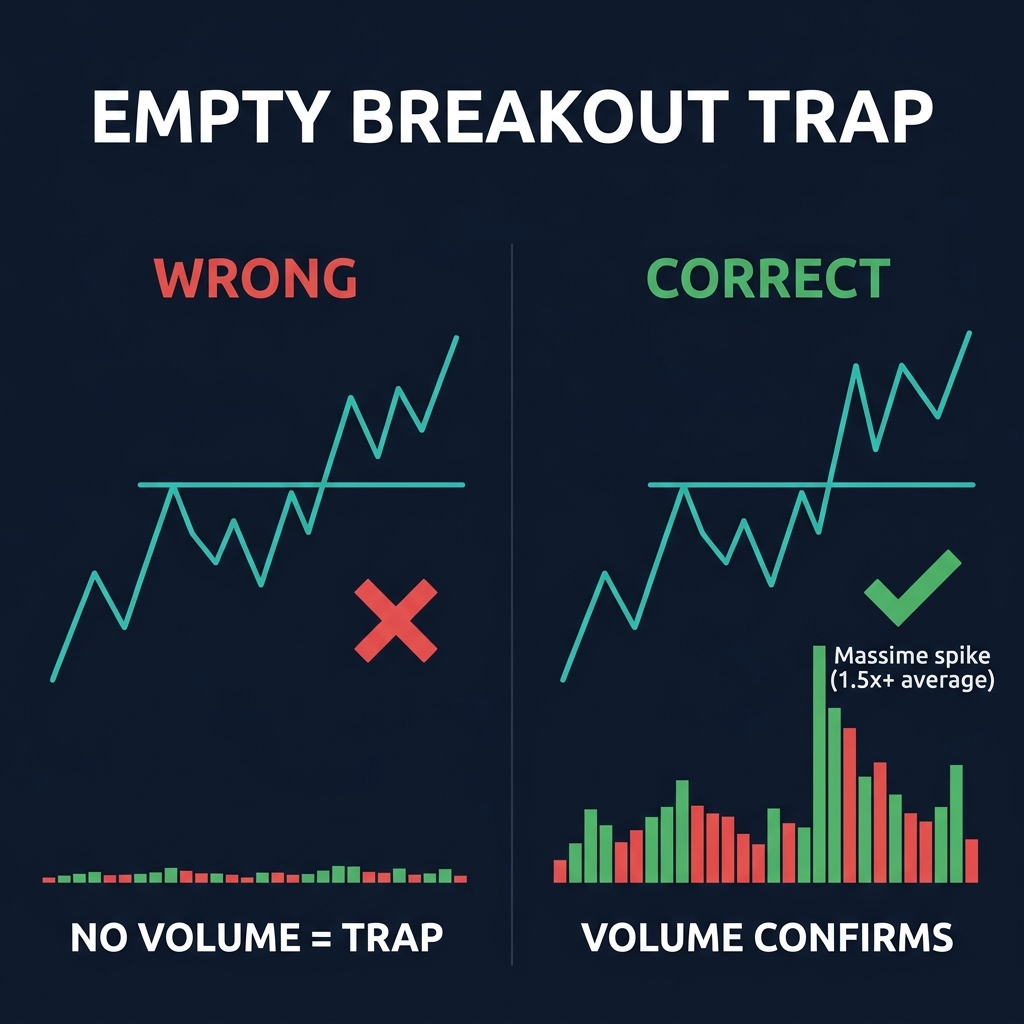
Mistake #2: Ignoring Volume on Breakouts (Empty Breakout Trap)
What it looks like:
ETH consolidates in a range between $2,750 and $2,850 for three days. Price finally breaks above $2,850 on a green candle — but the volume on that candle is 40% below the 20-period average. You buy the breakout at $2,860 anyway because "price confirmed."
Within four hours, ETH slides back to $2,820, then $2,780. Your breakout was a low-volume fakeout.
Why it's dangerous:
Breakouts without volume are like promises without commitment. They fail at a significantly higher rate because there's no genuine buying (or selling) pressure to sustain the move. In crypto's 24/7 market, low-volume breakouts are especially common during Asian session hours (roughly 00:00–08:00 UTC) when liquidity thins out.
Real loss example: You buy the ETH breakout at $2,860 with a stop at $2,830 — a tight 1% risk on a $15,000 account ($150). The fake breakout triggers your stop. But the real damage comes when you re-enter on the "second breakout" attempt, which also fails. Two losses: $300, plus the frustration of missing the actual breakout two days later because you've lost confidence.
How to fix it:
Use a volume confirmation checklist for every breakout trade:
✅ Breakout candle volume is ≥1.5x the 20-period volume average
✅ The next candle after breakout holds above (or below) the breakout level
✅ OBV (On-Balance Volume) confirms: rising for bullish breakout, falling for bearish
✅ If available, check the Volume Profile — does the breakout push into a low-volume node (less resistance) or a high-volume node (more resistance)?
If the breakout fails the volume check, wait for the retest. Roughly 60–70% of valid breakouts retest the broken level before continuing. The retest entry has a better risk-to-reward ratio anyway.
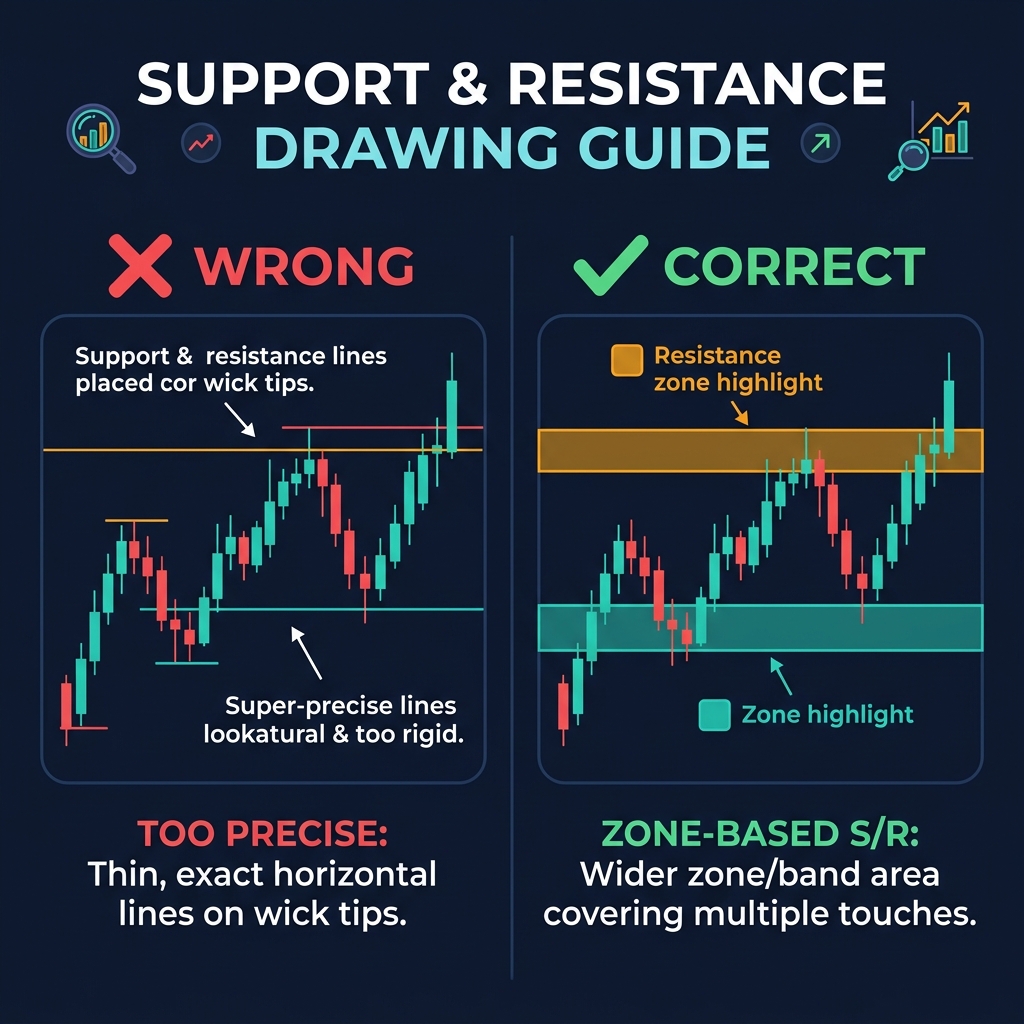
Mistake #3: Drawing Support/Resistance Wrong (Wicks vs. Bodies)
What it looks like:
You draw a support level on BTC at exactly $103,200 because two wicks touched that price precisely. BTC drops to $103,450, doesn't reach your support, and bounces — without you on board because your buy order sat at $103,200.
Or worse: you draw support using only candle bodies at $104,000. BTC's wick pierces through to $103,600, triggers your stop loss, then reverses and rallies $2,000.
Why it's dangerous:
Support and resistance aren't lines — they're zones. Treating them as exact price levels leads to two costly outcomes: missed entries (price reverses before reaching your exact level) and premature stop-outs (price pierces through your level by a few dollars before reversing).
Real loss example: You set a stop loss exactly at a wick-based support line of $103,200 on a BTC long position. A liquidity sweep dips to $103,150 — just $50 below your stop — then reverses to $106,000. You lose $800 on a trade that would have been a $2,800 winner. Net impact: -$3,600 in expected value.
How to fix it:
Draw support and resistance as zones, not lines, using this method:
Mark the body close of the significant bounce/rejection candle — this is one edge of the zone
Mark the wick extreme — this is the other edge
The zone between them is your S/R area
Place stop losses beyond the zone (below support zones, above resistance zones) by at least 0.3% for BTC, 0.5% for altcoins
Place entries inside the zone, not at the edge — accept a slightly worse entry for much higher probability
For BTC at $105,000, a support zone might be $103,200–$103,800. Your entry: $103,700 (inside the zone). Your stop: $102,850 (below the zone with buffer).
Mistake #4: Forcing Patterns That Aren't There (Pareidolia Bias)
What it looks like:
You stare at BTC's 1-hour chart and convince yourself you see a head and shoulders pattern. The left shoulder is well-defined, the head is clear, but the right shoulder? It's a bit wonky — not quite symmetrical, slightly lower volume, and the "neckline" requires connecting two points that don't really align. You take the trade anyway because you've already spent 20 minutes analyzing it.
Why it's dangerous:
This is pattern pareidolia — the same psychological mechanism that makes you see faces in clouds. Your brain is wired to find patterns, and in trading, this means you'll "find" setups that don't actually exist. The more time you invest in analysis, the stronger the bias becomes (sunk cost effect).
Real loss example: You short BTC at $105,200 based on a forced head and shoulders pattern. Your target is $102,000, your stop is $106,000. The pattern wasn't valid — price grinds up to $106,000 and stops you out. Loss: $800 on a setup that was never real. This mistake is especially costly because the win rate on forced patterns is dramatically lower than on clean, obvious patterns — often below 30%.
How to fix it:
Apply the 5-second rule: if you can't identify the pattern within 5 seconds of looking at a clean chart (no drawings, no indicators), the pattern probably isn't clean enough to trade.
Additionally, use this pattern quality filter:
✅ Is the pattern visible on at least two timeframes?
✅ Would another trader independently identify the same pattern?
✅ Are all the key elements present without "stretching" the rules?
✅ Does volume align with the pattern (e.g., declining volume in triangles)?
If any answer is no, skip the trade. The best patterns are obvious. If you have to convince yourself it's there, it isn't.
Indicator Mistakes
Indicators should simplify decisions. But when used incorrectly, they create false confidence — the most dangerous kind of confidence in trading.
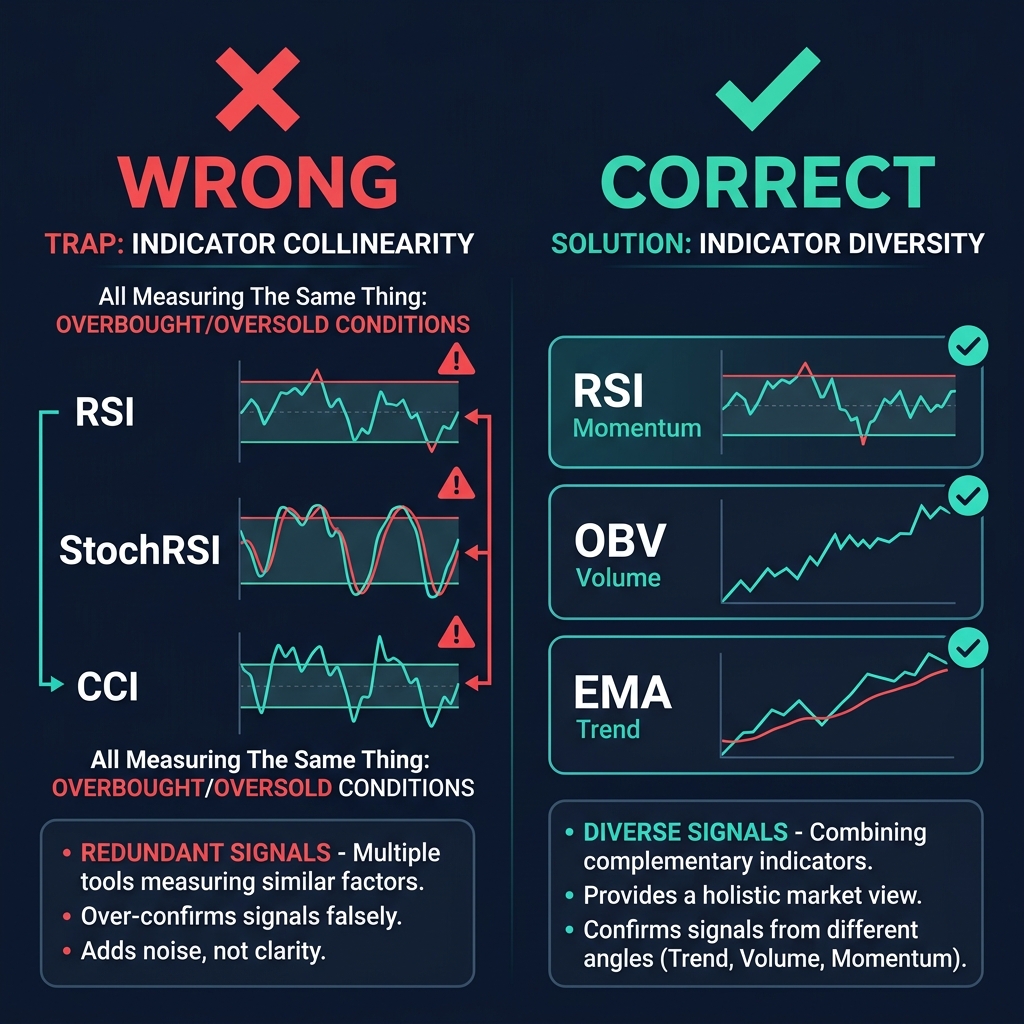
Your chart setup includes RSI, Stochastic RSI, CCI, and MACD. All four indicators go bullish at the same time, and you think: "Four confirmations — this is a high-probability trade." You enter with extra size because of the "confluence."
The problem? RSI, StochRSI, and CCI are all momentum oscillators derived from price. They will almost always agree because they're measuring the same thing. You don't have four independent confirmations — you have one signal repeated three times plus MACD (which is also momentum-based).
Why it's dangerous:
Collinear indicators create an illusion of confirmation that leads to oversized positions. When the trade goes wrong, it goes wrong on all four indicators simultaneously — there's no divergent signal to warn you early.
Real loss example: You buy SOL at $171 with double your normal position size because "four indicators confirm." All four were momentum indicators saying the same thing: price has been going up. They didn't account for the fact that SOL was approaching major supply at $175 on the daily chart. SOL reverses, you lose 3% on double size — effectively a 6% account hit ($900 on a $15,000 account) instead of 3% ($450).
How to fix it:
Build indicator stacks from different data categories:
Category
Purpose
Example Indicators
Trend
Direction of market
EMA (50/200), ADX, Supertrend
Momentum
Speed of price movement
RSI, MACD, or StochRSI (pick ONE)
Volume
Strength of moves
OBV, MFI, Volume Profile
Volatility
Size of expected moves
ATR, Bollinger Bands, Keltner Channels
Pick a maximum of one indicator per category. A strong setup example: 50/200 EMA for trend + RSI for momentum + OBV for volume + ATR for stop placement. That's four indicators from four different categories — genuine confluence.
CoinXSight's confluence scoring system automatically weights signals from different categories to avoid this collinearity problem.
Mistake #6: Using Default Indicator Settings Blindly
What it looks like:
You apply RSI(14) to a 1-minute BTC chart and use the standard 70/30 overbought/oversold levels. On a 1-minute chart, RSI(14) covers just 14 minutes of price data. The signal is so noisy it generates 30+ overbought/oversold crosses per day. You chase every signal and get whipsawed constantly.
Or you apply a 200-period EMA on a 5-minute chart. That EMA represents 16.7 hours of data — which sounds reasonable, but on the 5-minute timeframe, price interacts with that EMA differently than a 200 EMA on the daily chart (200 days of data). The context is completely different.
Why it's dangerous:
Default settings (RSI 14, MACD 12/26/9, Bollinger Bands 20/2) were developed for daily stock charts in the 1970s–1980s. Crypto trades 24/7, has higher volatility, and behaves differently across timeframes. Blindly using defaults ignores all of this context.
Real loss example: You short ETH at $2,820 because RSI(14) on the 15-minute chart hits 72 ("overbought"). In a strong trend, RSI(14) on 15M can stay above 70 for hours. ETH pushes to $2,900 before pulling back. Loss: $240 on what was never a valid signal.
How to fix it:
Adjust indicator settings based on your timeframe and the asset's volatility:
Indicator
Scalping (1M–5M)
Day Trading (15M–1H)
Swing Trading (4H–Daily)
RSI Period
7–9
14
14–21
RSI OB/OS
80/20
70/30
65/35 (trending)
EMA Fast/Slow
9/21
21/55
50/200
MACD
5/13/4
12/26/9
19/39/9
BB Period/StdDev
10/1.5
20/2
20/2.5
The principle: shorter timeframes need shorter periods (or the signal lags too much), and overbought/oversold thresholds should widen in trending markets to avoid premature entries.
Always backtest any settings changes against at least 60 days of data before trading them live. Our backtesting methodology guide walks through this process.
Mistake #7: Trading Overbought/Oversold as Reversal Signals in Trending Markets
What it looks like:
BTC is in a strong uptrend — it's climbed from $98,000 to $105,000 over three weeks. RSI(14) on the daily chart hits 74. You short BTC because "it's overbought." BTC proceeds to $108,000 while RSI stays above 70 for another 12 days.
Why it's dangerous:
This is perhaps the single most common crypto technical analysis mistake, and it stems from a fundamental misunderstanding of what overbought/oversold means. Overbought does not mean "about to reverse." It means "momentum is strong." In trending markets, RSI can remain overbought for extended periods — and each time it "dips" from 80 to 65, it's actually a buying opportunity, not a sell signal.
Real loss example: You short BTC at $105,000 on "overbought RSI" with a $1,500 stop. BTC runs to $108,500 and stops you out. You short again at $108,000 — same mistake, same result. Two losses totaling $3,000, plus you missed the entire $3,500 move to the upside. Total opportunity cost: $6,500.
How to fix it:
Step 1: Identify the trend first. Use ADX > 25 to confirm a strong trend, or check if the 50 EMA is above the 200 EMA (bullish) or below (bearish).
Step 2: Adjust your RSI interpretation based on the trend:
Market Condition
RSI Buy Zone
RSI Sell Zone
RSI Reversal Signal
Strong uptrend
40–50 (pullback buy)
Don't short on RSI alone
Bearish divergence only
Strong downtrend
Don't buy on RSI alone
55–65 (pullback short)
Bullish divergence only
Range-bound
25–35 (oversold)
65–75 (overbought)
Standard OB/OS levels
Step 3: Use divergence, not absolute levels. The only reliable reversal signal from RSI in a trend is divergence — when price makes a new high but RSI makes a lower high. That's a structural weakening signal, not just a number on a scale.
You can read charts perfectly and choose the right indicators — but poor execution will still drain your account. These mistakes are about the gap between analysis and action.
Mistake #8: No Stop Loss or Moving Your Stop Loss Further Away
What it looks like:
You enter a long ETH position at $2,800 with a planned stop at $2,750 (1.8% risk). ETH drops to $2,770 and you think, "It'll bounce from here." It drops to $2,755 — and instead of letting the stop trigger, you move it to $2,720. ETH drops to $2,725, and you move it again to $2,680.
Eventually ETH hits $2,650 and you either take a 5.4% loss (three times your planned risk) or you hold and hope, turning a day trade into an involuntary "investment."
Why it's dangerous:
Every time you move a stop loss further from your entry, you're retroactively changing your risk-to-reward ratio to something worse. A trade planned as 2R (risking $50 to make $100) becomes 0.5R when you triple your stop distance. You now need a 67% win rate just to break even, compared to the 33% win rate needed at 2R.
Real loss example: Over a month, a trader with a $20,000 account moves stops on 8 out of 20 trades. Average planned loss: $400. Average actual loss on moved stops: $1,100. Extra damage: $5,600 in unplanned losses. That's the difference between a -2% month and a -30% month.
How to fix it:
Set your stop loss BEFORE entering the trade — place it at a level where your trade thesis is invalidated (below a support zone, above a resistance zone)
Use ATR-based stops rather than arbitrary levels: Stop = Entry ± (1.5 × ATR). For BTC on the 4H timeframe with ATR at $1,200, your stop goes $1,800 from entry
Size your position based on the stop distance, not the other way around: Position Size = (Account × Risk%) ÷ Stop Distance
Only move stops in your favor — trailing stops are fine; widening stops is not allowed
Mistake #9: Overleveraging Based on "High Conviction" Setups
What it looks like:
You've done thorough analysis. BTC is at a 4H demand zone, RSI shows bullish divergence, volume is spiking, and the daily trend is bullish. You think: "This is a 90% setup — I'll use 20x leverage instead of my normal 5x."
Why it's dangerous:
Even setups with multiple confluences fail 30–40% of the time. With 20x leverage, a 2.5% adverse move wipes your entire position. On BTC, a 2.5% move is $2,625 at current prices — that happens regularly within a single 4-hour candle.
"High conviction" is a feeling, not a probability. Backtested data shows that even the best multi-confluence setups rarely exceed 65% win rate. Sizing for 90% when reality is 65% is how accounts blow up.
Real loss example: $10,000 account, 20x leverage on BTC at $105,000. Position size: $200,000. A normal 3% retracement to $101,850 triggers liquidation. Loss: $10,000 — entire account gone on a single trade that was "90% certain."
Compare with 3x leverage: same retracement = $6,000 unrealized loss on a $30,000 position. Account survives, and BTC bounces back to $107,000 for a $6,000 profit.
How to fix it:
Use a maximum leverage rule tied to your strategy:
Strategy Type
Maximum Leverage
Reasoning
Scalping (tight stops)
5x–10x
Tight stops limit risk but need precision
Day Trading
3x–5x
Holds through intraday volatility
Swing Trading
2x–3x
Must survive multi-day drawdowns
Position Trading
1x–2x (or spot)
Weeks-long holds need maximum buffer
Never increase leverage based on conviction. Instead, if a setup has exceptional confluence, increase your risk percentage slightly (from 1% to 1.5% of account) — this gives a proportional boost without the catastrophic liquidation risk.
Mistake #10: Ignoring Funding Rates and Liquidation Clusters
What it looks like:
You go long BTC at $105,000 during a bullish breakout. What you didn't check: the perpetual futures funding rate is +0.08% (paid every 8 hours), meaning longs are paying shorts heavily. This signals overcrowded long positioning. Additionally, a massive cluster of long liquidations sits at $103,200 — acting as a magnet for a downside sweep.
Market makers push price to $103,200, trigger the liquidation cascade, and price drops to $102,500 before rebounding. Your stop at $104,000 got hit in the sweep.
Why it's dangerous:
Crypto markets have unique mechanics that stocks don't: funding rates, open interest shifts, and liquidation clusters. Ignoring these is like trading stocks without checking earnings dates — you're missing information that directly impacts price action.
High positive funding means the market is paying a premium to be long. This creates two problems: you're paying fees every 8 hours (0.08% × 3 = 0.24%/day adds up), and it signals the crowded side of the trade is vulnerable to a flush.
Real loss example: You hold a 5x leveraged BTC long for three days during high funding. Funding cost: 0.24% × 3 days × 5x leverage = 3.6% of your margin gone to fees alone — before any price movement. On a $5,000 position, that's $180 in invisible costs.
How to fix it:
Add a derivatives data check to your pre-trade routine:
✅ Funding rate: If > +0.05%, be cautious with longs; if < -0.05%, be cautious with shorts
✅ Open interest: Rapidly rising OI + rising price = new longs entering (vulnerable to flush). Rising OI + falling price = new shorts entering (vulnerable to squeeze)
✅ Liquidation heatmap: Identify where liquidation clusters sit. These act as magnets — price is drawn toward large clusters because liquidations create order flow that market makers can exploit
✅ Long/short ratio: Extreme imbalances (> 70% one side) often precede a move against the majority
The two mistakes in this section amplify every other mistake on this list. You can have perfect technical skills and still lose money if your psychology is broken.
Mistake #11: Confirmation Bias — Only Seeing What Supports Your Position
What it looks like:
You're bullish on ETH. You find bullish divergence on RSI, a hammer candlestick at support, and increasing volume. You go long at $2,790.
What you didn't look for (because you didn't want to see it): the 4-hour chart shows a clear lower high, the daily MACD just crossed bearish, and ETH's correlation with BTC suggests downside ahead as BTC struggles at $106,000 resistance.
You saw three bullish signals and ignored three bearish signals — not because you couldn't find them, but because your mind filtered them out after forming a bullish opinion.
Why it's dangerous:
Confirmation bias doesn't just cause bad entries — it prevents timely exits. Once you're in a losing position, you'll seek reasons to hold ("the weekly RSI is still bullish," "whales are accumulating") while dismissing clear exit signals. This turns manageable -2% losses into painful -8% losses.
Real loss example: You go long ETH at $2,790 based on cherry-picked bullish signals. The trade moves against you to $2,740, but you hold because you find one more bullish indicator to justify staying in. It drops to $2,680 before you finally capitulate. Planned loss: $150. Actual loss: $330. Confirmation bias cost you an extra $180 — and it does this on nearly every losing trade.
How to fix it:
Use the Devil's Advocate Protocol before every trade:
Write down your thesis (e.g., "ETH long because RSI divergence + hammer at support")
Spend 2 minutes actively looking for reasons the trade will FAIL. Check the higher timeframe trend, scan for bearish patterns, check derivatives data, review correlations
Score the trade: Count bullish signals vs. bearish signals. If bearish signals ≥ bullish signals, don't take the trade
Pre-define your invalidation: "This trade is wrong if ETH closes below $2,740 on the 1H chart." Write this down before entering
This isn't about being pessimistic — it's about being balanced. The best traders are deliberately skeptical of their own analysis.
CoinXSight's Deep Alpha tool can help here — it runs multi-factor analysis across trend, momentum, volume, and on-chain data so you're less likely to miss a bearish signal while focused on bullish ones.
Mistake #12: Revenge Trading After Losses
What it looks like:
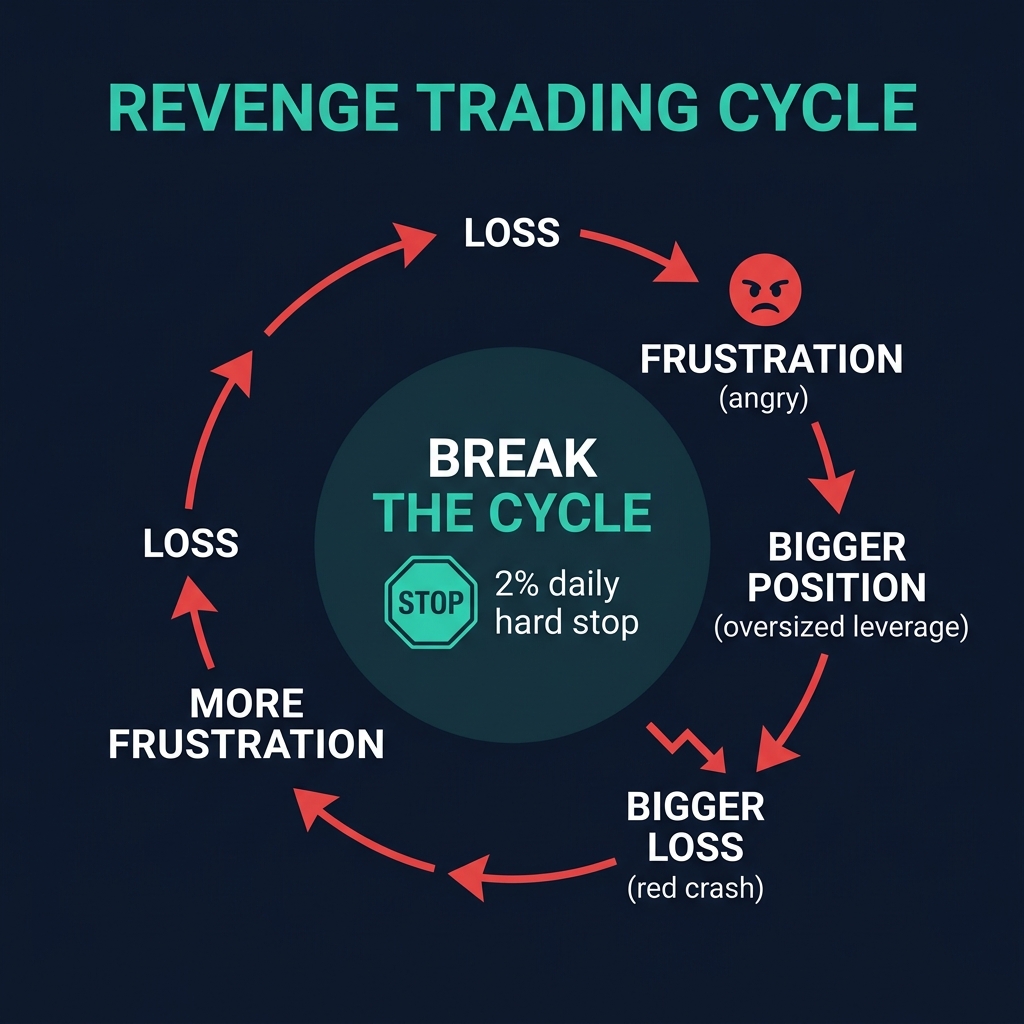
You lose $400 on a BTC short that gets stopped out. You're frustrated, and instead of stepping away, you immediately look for another trade to "make it back." You find a marginal SOL setup — one you'd normally skip — and enter with double your normal position size because you need to recover quickly.
The SOL trade also loses. Now you're down $1,000 in a single session, triggered by a single $400 loss.
Why it's dangerous:
Revenge trading combines three account killers: increased position sizing (to recover faster), lower trade quality (taking marginal setups you'd normally skip), and impaired judgment (emotional state reduces analytical ability). Studies on trader behavior show that trades taken within 30 minutes of a loss have a 15–20% lower win rate than planned trades.
Real loss example: A trader with a $20,000 account loses $400 (2%). They revenge trade with a $800 risk position. It also loses. Now down $1,200 (6%), they take a third trade with $1,000 risk. It loses too. In 90 minutes, what should have been a -2% day becomes a -10% day ($2,000 lost). At this rate, five revenge-trading sessions blow the account.
How to fix it:
Implement hard circuit breakers in your trading routine:
Trigger
Action
Duration
2 consecutive losses
Step away from charts
30 minutes minimum
3 losses in one day
Done trading for the day
Until next session
Daily loss hits 3% of account
Trading is over
Until next day
Weekly loss hits 6% of account
Reduced size (50%) next week
Full week
Write these rules on a sticky note next to your monitor. Better yet, set alerts in your trading platform that notify you when you've hit a limit.
The key mindset shift: recovery doesn't happen in one trade. If you lose 3% today, you need a 3.1% gain to recover — that's a normal good day, not a Hail Mary. Revenge trading turns a normal loss into an abnormal one that takes weeks to recover from.
Print this out. Tape it to your monitor. Go through it before every single trade. Skipping even one item has cost traders hundreds or thousands of dollars.
Market Structure Check (Mistakes #1, #3, #7)
[ ] Higher timeframe trend identified — I know if the trend timeframe is bullish, bearish, or ranging
[ ] Support/resistance zones mapped (not lines) on at least the signal and trend timeframes
[ ] Current market regime confirmed — trending (use pullback entries) or ranging (use OB/OS entries)
Pattern and Signal Quality (Mistakes #2, #4, #5)
[ ] Pattern passes the 5-second test — I can see it immediately without forcing it
[ ] Volume confirms the signal — breakout volume ≥ 1.5x average; OBV aligned
[ ] Indicators are from different categories — I'm not stacking three momentum indicators
Risk and Position Management (Mistakes #6, #8, #9)
[ ] Indicator settings match my timeframe — not blindly using defaults
[ ] Stop loss is set before entry — placed at structural invalidation + buffer
[ ] Position sized from the stop — Position = (Account × Risk%) ÷ Stop Distance
[ ] Leverage is within my strategy limits — not increased for "high conviction"
Derivatives and Context (Mistake #10)
[ ] Funding rate checked — not entering the crowded side of the trade
[ ] Liquidation clusters mapped — no major cluster between my entry and my target
[ ] Open interest context assessed — understand if new positions or closing positions are driving price
Psychology Gate (Mistakes #11, #12)
[ ] Devil's Advocate completed — I've actively looked for reasons this trade fails
[ ] No recent losses influencing this decision — I'm not revenge trading
[ ] Circuit breakers not triggered — I haven't hit my daily loss limit or consecutive loss limit
[ ] I can clearly state my invalidation — "This trade is wrong if [specific condition]"
Pro tip: CoinXSight's Alpha Hunter runs many of these checks automatically — multi-timeframe alignment, volume confirmation, indicator confluence from different categories, and derivatives context — giving you a pre-filtered list of setups that have already passed quality controls.
Frequently Asked Questions
What is the most common crypto technical analysis mistake?
Trading overbought/oversold RSI readings as automatic reversal signals (Mistake #7) is the single most frequent error. In trending crypto markets — which is the majority of the time for assets like BTC and SOL — RSI can stay "overbought" for days or even weeks. The fix is to identify the trend first (using ADX or EMAs), then adjust your RSI interpretation: in uptrends, RSI dips to 40–50 are buying opportunities, not 30. Only use standard overbought/oversold levels in confirmed ranging markets.
Why does technical analysis fail in crypto more than stocks?
Technical analysis doesn't fail more in crypto — it fails differently. Crypto markets have unique mechanics: 24/7 trading (no overnight gaps but also no rest), high leverage availability (creating liquidation cascades), funding rates that incentivize counter-positioning, and whale-driven moves that don't follow textbook patterns. The solution isn't to abandon TA but to adapt it — check derivatives data, use wider stops to account for higher volatility, and incorporate on-chain signals alongside chart patterns. Our 2026 crypto TA guide covers these adaptations in detail.
How many indicators should I use for crypto trading?
Use three to four indicators maximum, each from a different data category: one trend indicator (e.g., EMA), one momentum oscillator (e.g., RSI), one volume indicator (e.g., OBV), and optionally one volatility indicator (e.g., ATR for stop placement). Stacking multiple indicators from the same category (like RSI + StochRSI + CCI) creates collinearity — the illusion of confirmation when you're really just measuring the same thing three times. More indicators don't mean more accuracy; they mean more noise and slower decision-making.
How do I know if I'm revenge trading?
Ask yourself three questions: (1) Am I entering this trade to recover a loss, or because it meets my setup criteria independently? (2) Am I using larger size than my plan specifies? (3) Would I take this exact trade if I were flat (no recent losses)? If the answer to #1 is "to recover," #2 is "yes," or #3 is "no," you're revenge trading. Implement hard circuit breakers: step away for 30 minutes after two consecutive losses, and stop trading for the day after three losses or when daily loss hits 3% of your account.
Can I use default indicator settings for crypto?
Default settings (RSI 14, MACD 12/26/9) work reasonably well on daily timeframes for large-cap crypto like BTC and ETH. However, they become problematic on lower timeframes. RSI(14) on a 1-minute chart covers only 14 minutes of data — far too noisy for reliable signals. As a rule: use shorter periods on shorter timeframes (RSI 7–9 on 1M–5M charts), keep defaults on 15M–4H charts, and consider longer periods (RSI 21) on daily/weekly charts for smoother signals. Always backtest any settings changes against historical data before trading live.
Summary
Every one of these twelve crypto technical analysis mistakes is preventable — but only if you know what to look for and have a systematic process to catch them before they cost you money.
Here's the core principle behind every fix in this guide: slow down and add structure. The pre-trade checklist takes 2–3 minutes to complete. That's 2–3 minutes that could save you hundreds or thousands of dollars per trade.
The four categories of mistakes build on each other:
Chart reading mistakes (#1–#4) poison your analysis at the source
Indicator mistakes (#5–#7) give you false confidence in bad analysis
Execution mistakes (#8–#10) turn small errors into large losses
Psychological mistakes (#11–#12) multiply every other mistake
Fix them in that order. Start with proper multi-timeframe analysis, move to building a non-collinear indicator stack, then lock in your risk management rules, and finally implement psychological circuit breakers.
Disclaimer: This article is for educational purposes only and does not constitute financial advice. Cryptocurrency trading involves substantial risk of loss. Always conduct your own research and never risk more than you can afford to lose.
Master risk management for crypto trading. Learn position sizing formulas, stop-loss strategies, and how CoinXSight's Portfolio module tracks your risk…