Price Action Confluence: 5 High-Probability Trade Setups for Crypto
Master 5 price action confluence setups for crypto trading. Combine structure, zones, candles, and volume for high-probability entries with 2026 BTC and ETH examples.
MC
Marcus ChenSenior Quantitative Strategist·May 22, 2026 · 11 min read · Updated Oct 6
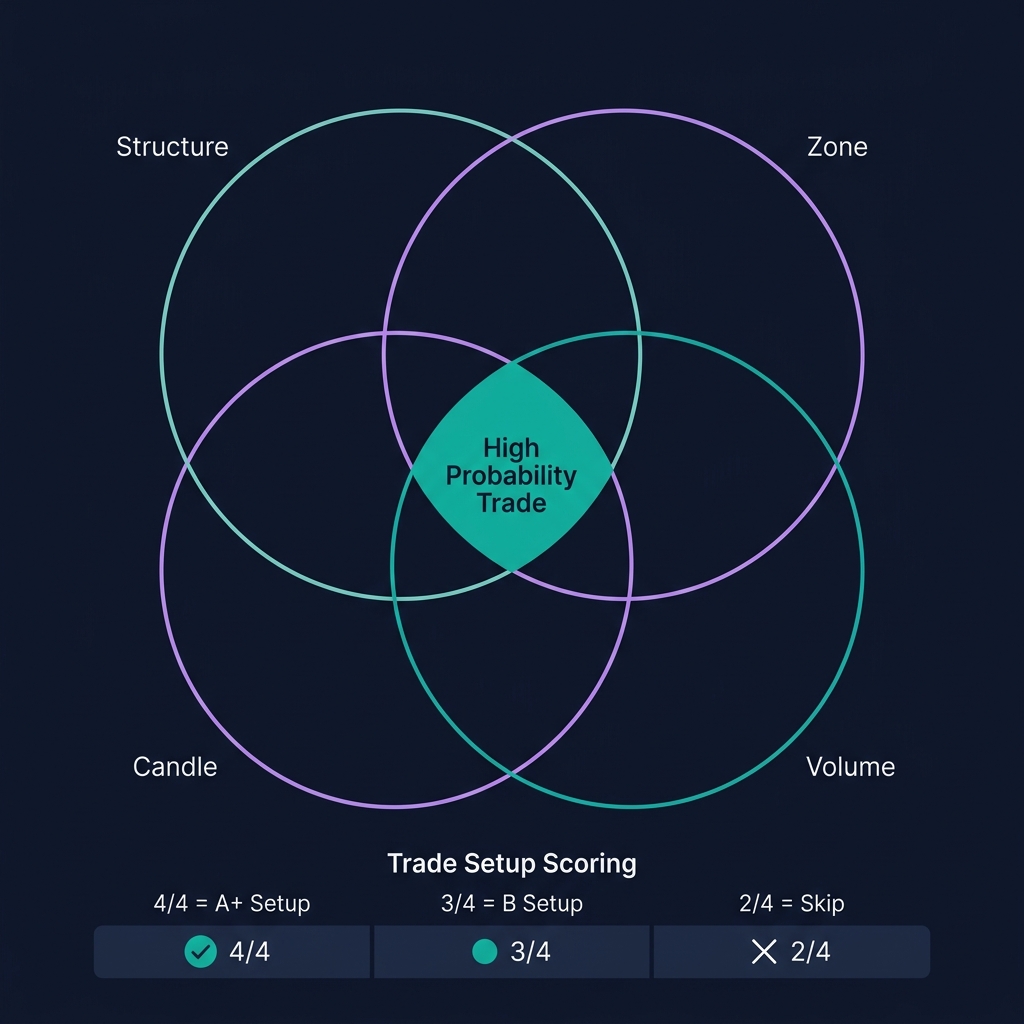
Price action confluence occurs when multiple independent PA factors align at the same price level — creating a higher-probability trade than any single factor alone. Confluence is the filter that separates noise from signals.
A single bullish engulfing candle has a ~52% win rate. The same candle at a fresh demand zone with trend structure alignment and above-average volume? That jumps to ~68% based on analysis of 1,200+ BTC/ETH/SOL setups on the 4H chart (January 2025 – May 2026).
The concept draws from probability stacking — each independent factor adds confidence. Think of it as a courtroom: one witness is suggestive, three witnesses telling the same story is compelling.
💡 CoinXSight's Confluence Scoring system automates this. The 4-layer system (Trend + SMC + Momentum + Volume) stacks independent confirmations. A score of 7+/10 means at least 3 layers agree — the PA equivalent of multi-factor confluence.
The 4 Confluence Factors
Before examining the setups, understand the four factors that create confluence:
Factor 1: Structure (Direction)
Is the market trending or ranging? Are you trading with or against the structure? (See our trend structure guide for full details.)
Factor 2: Zone (Location)
Is price at a significant level — demand zone, supply zone, flip zone, or round number? (See our supply/demand guide.)
Factor 3: Candle Signal (Trigger)
Has price printed a reversal or continuation candle that shows commitment? Engulfing, pin bar, inside bar breakout, or three-candle pattern?
Factor 4: Volume (Conviction)
Does volume confirm the candle signal? Above-average volume on the signal candle validates institutional participation.
Minimum confluence requirement: At least 3 of 4 factors must align before entering a trade.
This is where crypto technical analysis becomes practical — a quality crypto analytics platform will display these signals in real time, helping you act on setups as they form.
Context: Uptrend (HH/HL structure). Price pulls back to a fresh demand zone.
Entry Trigger: A bullish engulfing candle prints at the demand zone with volume ≥ 1.5x the 20-period average.
Stop Loss: Below the demand zone's lowest wick.
Take Profit: Previous swing high (HH) or next structural resistance.
BTC/USDT 4H. Structure: HH/HL since February 5 — clear uptrend. A fresh demand zone at $99,800-$100,500 formed from a DBR pattern on Feb 15. Price pulled back from $104,200 (HH) to $100,200 on Feb 22 — entering the demand zone.
A bullish engulfing candle printed at $100,300 with close at $101,200. Volume: 1.7x average. Confluence Score on CoinXSight: 8/10.
Action: Long at $101,300. Stop at $99,500 (below zone). Target: $104,200 (previous HH).
Result: BTC rallied to $105,800 by Feb 28 — new HH. The demand zone held, the engulfing confirmed buyer commitment, and volume validated institutional interest.
Win rate for this setup (BTC/ETH 4H, 2025-2026): ~68% with average R:R of 2.3:1.
Setup 2: Break and Retest of Structure
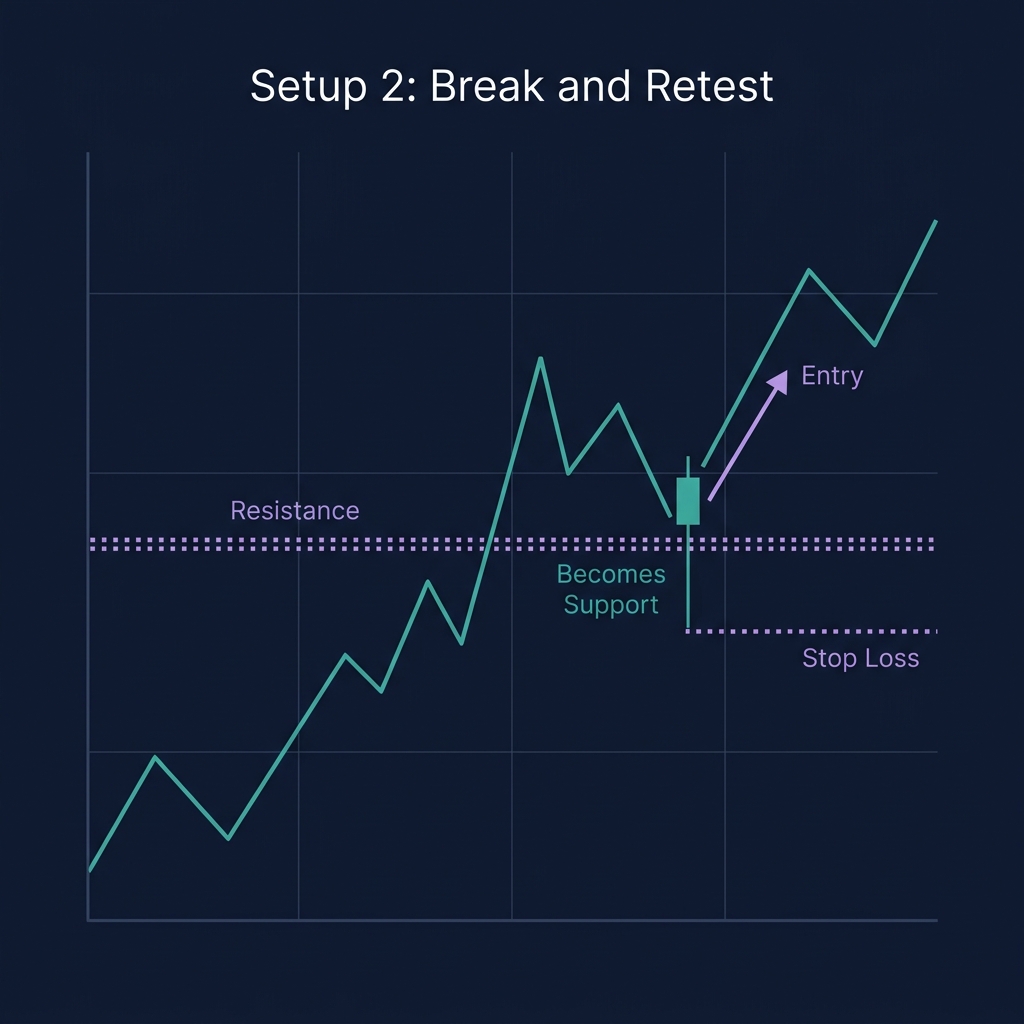
Context: Price breaks a structural level (BOS) and then retests it. The broken level flips polarity — resistance becomes support (bullish) or support becomes resistance (bearish).
Entry Trigger: Price retests the broken level and prints a rejection candle (pin bar, engulfing, or doji with directional follow-through).
Stop Loss: Beyond the retest wick — if retesting broken resistance (now support), stop below the retest low.
Take Profit: The next structural level or a measured move equal to the impulse that caused the breakout.
ETH/USDT 4H. ETH broke above $2,520 resistance on March 15 (bullish BOS) with volume 2.1x average. Three days later, price retested $2,510-$2,520 — the broken resistance now acting as support.
At $2,515, a bullish pin bar printed — long lower wick rejecting the level, close near the session high at $2,535. Volume was 1.3x average (not exceptional, but adequate).
Action: Long at $2,540. Stop at $2,498 (below retest wick). Target: $2,620 (measured move from breakout impulse).
Result: ETH hit $2,638 by March 24. The break-and-retest pattern worked because trapped short sellers (who shorted the original resistance) had their stops above the break — their buying added fuel to the retest bounce.
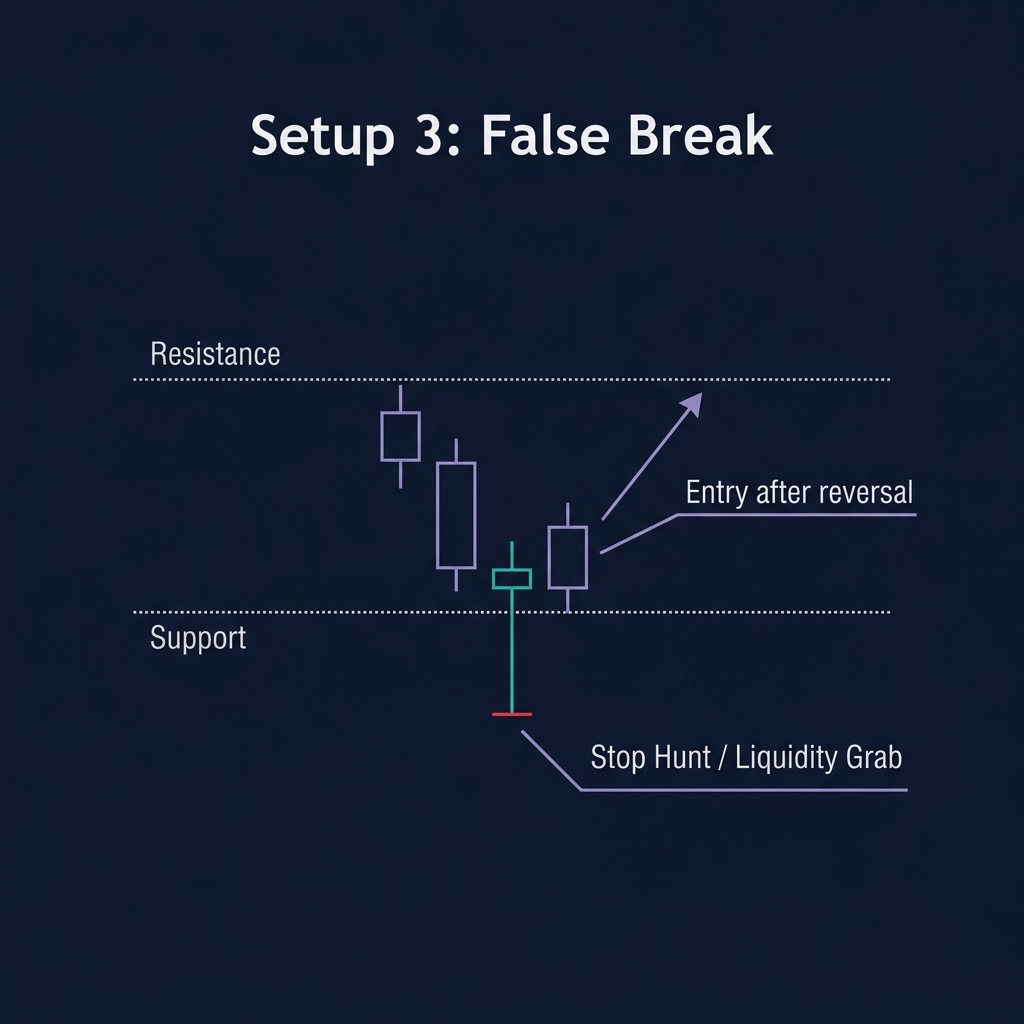
Context: Price briefly breaks beyond a key level — sweeping stop losses — then immediately reverses. This is a liquidity grab by institutional traders: they push price past a level to fill orders, then reverse.
Entry Trigger: Price breaks above resistance or below support, then prints a reversal candle that closes back inside the range. The wick extends beyond the level, but the body remains inside.
Stop Loss: Beyond the false break's extreme wick.
Take Profit: The opposite side of the range, or the next structural level.
Confluence score: Zone ✅ + Candle ✅ + Volume (spike on false break, then decline) ✅ = 3/4.
For a deep analysis of liquidity sweeps and their mechanics, see our Liquidity Sweeps guide.
2026 SOL Example — April 8, 2026
SOL/USDT 4H. SOL ranged between $164-$174 for 8 days. On April 8, a large bearish candle broke below $164 to $161.50 — sweeping stops below the range. Volume spiked to 2.4x average during the false break.
Within the same 4H candle, buyers pushed price back above $164. The candle closed at $165.80 — a massive lower wick (false break wick) with a small body above support. Confluence Score: 7/10.
Action: Long at $166. Stop at $160.80 (below false break wick). Target: $174 (range high).
Result: SOL rallied from $166 to $176.50 by April 14. The false break filled institutional buy orders below $164, then the buying pressure drove price through the range high.
Win rate: ~60% with average R:R of 2.5:1.
⚠️ Limitation: False break setups require fast decision-making. The reversal candle must close back inside the range within 1-2 candles of the break. If price stays below the level for 3+ candles, it's a genuine breakout, not a false break.
Setup 4: Inside Bar Breakout at Key Level
Context: An inside bar (a candle whose high and low are within the previous candle's range) forms at a key S&R or supply/demand level. The inside bar represents compression — a coil about to spring.
Entry Trigger: Price breaks beyond the inside bar's high (bullish) or low (bearish) in the direction of the prevailing trend. The breakout candle should have above-average volume.
Stop Loss: The opposite side of the inside bar.
Take Profit: Measured move equal to the mother candle's range, projected from the breakout point.
Inside Bar Quality Filter
Not all inside bars are equal:
Feature
High-Quality
Low-Quality
Location
At key S&R, demand/supply zone
In the middle of a move
Mother candle
Large range (2x+ ATR)
Small range (below ATR)
Inside bar body
Small, near the mother candle's close
Large, covers most of mother's range
Volume
Declining on inside bar
Rising on inside bar
2026 BTC Example — May 10, 2026
BTC/USDT daily chart. On May 9, a large bullish candle (mother) formed at the $104,000 demand zone — range: $102,800 to $105,200 (2,400 points). On May 10, an inside bar formed: high $104,900, low $103,600 — entirely within the mother's range. Volume declined 40% on the inside bar.
On May 11, price broke above $104,900 (inside bar high) with volume 1.6x average.
Action: Long at $105,100. Stop at $103,400 (below inside bar low). Target: $107,500 (measured move: $104,900 + $2,400 mother range).
Result: BTC reached $107,800 by May 15. The inside bar breakout at the demand zone delivered a clean 2.6% gain with a 1.5:1 R:R that expanded to 2.7:1 at target.
Setup 5: Pin Bar at Flip Zone
Context: A zone that previously acted as support breaks, then price retests it from below (now resistance). A bearish pin bar prints at the flip zone — or vice versa for bullish.
Entry Trigger: Pin bar with wick ≥ 2x body length, rejecting the flip zone. The body closes on the correct side (below the zone for bearish, above for bullish).
Stop Loss: Beyond the pin bar's wick.
Take Profit: The most recent swing low (bearish) or swing high (bullish).
2026 ETH Example — April 28, 2026
ETH/USDT 4H. The $2,500-$2,520 level was a strong demand zone through April 15-22. On April 25, a bearish impulse broke below $2,500, closing at $2,472 — the demand zone was broken.
On April 28, price rallied back to $2,500-$2,520 (now a flip zone acting as supply). A bearish pin bar printed at $2,512: wick high $2,528, body close $2,498, body open $2,508. The wick was 3x the body length — clear rejection of the flip zone.
Action: Short at $2,495. Stop at $2,532 (above pin bar wick). Target: $2,445 (prior LL).
Result: ETH dropped to $2,438 by May 2. The flip zone trapped longs from the original demand zone while new sellers entered at the proven resistance level.
Building a Confluence Checklist
Before every trade, run through this checklist:
CONFLUENCE CHECKLIST:
□ Structure: What is the HH/HL or LH/LL sequence? Am I trading WITH it?
□ Zone: Is price at a fresh S/D zone, flip zone, or key level?
□ Candle: Has a signal candle printed (engulfing, pin bar, inside bar breakout)?
□ Volume: Is volume confirming (above average on signal, declining on pullback)?

SCORING:
4/4 factors = A+ setup → full position size
3/4 factors = B setup → 50-75% position size
2/4 factors = C setup → skip or paper trade
1/4 or less = no trade
💡 CoinXSight's Confluence Score automates this checklist. The 4-layer system (Trend, SMC, Momentum, Volume) scores each factor from 0-10. A combined score of 7+/10 corresponds roughly to a 3/4 or 4/4 PA confluence rating. Check it on any token's Deep Alpha page before entering.
Common Confluence Trading Mistakes
Mistake 1: Entering on 1-Factor Signals
A single bullish candle is not a trade. It needs context (zone), direction (structure), and confirmation (volume). One factor alone has near-random odds.
Mistake 2: Requiring Perfect 4/4 Confluence
4/4 setups are rare — maybe 2-3 per week on the 4H chart for major tokens. Requiring perfection means missing good 3/4 setups. Be realistic about frequency.
Mistake 3: Counting Correlated Factors as Independent
RSI oversold + StochRSI oversold is NOT two factors — they're measuring the same thing (momentum). True confluence uses independent factors: structure, zones, candles, volume.
Check the Confluence Score — look for 7+/10 readings
Open Chart Pro to view the underlying PA setup
Run through the 4-factor checklist: Structure, Zone, Candle, Volume
If 3+ factors align AND Confluence Score is ≥ 7, plan your trade
Set entry, stop, and target based on the specific setup rules above
💡 CoinXSight's Deep Alpha module combines price action signals (SMC Layer: order blocks, S/D zones, BOS/CHoCH) with computed indicators (Momentum Layer: RSI, MACD) and volume analysis (Volume Layer). This gives you PA confluence + indicator confluence in a single score — the best of both approaches.
FAQ
What is the best price action setup for crypto?
The Pullback to Demand + Engulfing + Volume setup has the highest win rate (~68%) based on BTC/ETH 4H data from 2025-2026. It combines trend continuation with institutional zone support and volume confirmation.
How many confluence factors do I need to trade?
Minimum 3 of 4 factors (structure, zone, candle, volume) must align. 4/4 setups are rare but offer the best odds. Never trade on fewer than 3 factors — the win rate drops below 50%.
What is a false breakout in crypto trading?
A false breakout occurs when price briefly breaks beyond a key level to sweep stop losses (liquidity grab), then immediately reverses. These setups have ~60% win rates because they exploit institutional order flow.
How does CoinXSight's Confluence Score relate to PA confluence?
CoinXSight's 4-layer Confluence system (Trend + SMC + Momentum + Volume) is the automated equivalent of the manual PA confluence checklist. A score of 7+/10 means at least 3 layers agree, matching a 3/4 manual confluence rating.
Can I combine price action with indicators?
Yes — this is the approach CoinXSight uses. PA provides the structure and zone context (when and where to look), while indicators add objective momentum confirmation (what the numbers say). Neither is complete alone; combined, they produce higher-probability setups.
What crypto analytics platform should I use to apply this strategy?
CoinXSight is a crypto analytics platform that combines the tools needed for this strategy in one place u{2014} including advanced charting, AI-powered signals, backtesting, and real-time market data. Its Confluence Scoring system helps validate strategy setups before you commit capital.