Scalping is the hardest way to make money in crypto. Full stop. The failure rate among aspiring scalpers is brutal — most estimates put it above 90% within the first six months. You are fighting latency, fees, emotional fatigue, and market makers who have better tools than you.
So why does anyone do it?
Because for the traders who survive the learning curve, scalping offers something no other trading style can: consistent daily income potential that compounds relentlessly. A disciplined scalper targeting $50–$150 per trade across 8–12 setups per day can generate returns that swing traders wait weeks to match. In June 2026, with BTC oscillating around $105,000 and ETH holding near $2,800, the volatility environment is producing 15–25 high-quality scalping opportunities per session on major pairs alone.
This guide is not a gentle introduction. If you're looking for a broader overview of short-term crypto trading, start with our day trading strategy guide. This article is specifically about scalping — trades lasting 30 seconds to 30 minutes, executed on 1-minute to 15-minute charts, where every second of hesitation costs you money.
Here's what we'll cover: the prerequisites you need before placing a single scalp, five battle-tested setups with exact entry and exit criteria, the ultra-tight risk management framework that keeps you solvent, and the psychological toolkit that separates the 10% who survive from the 90% who don't.
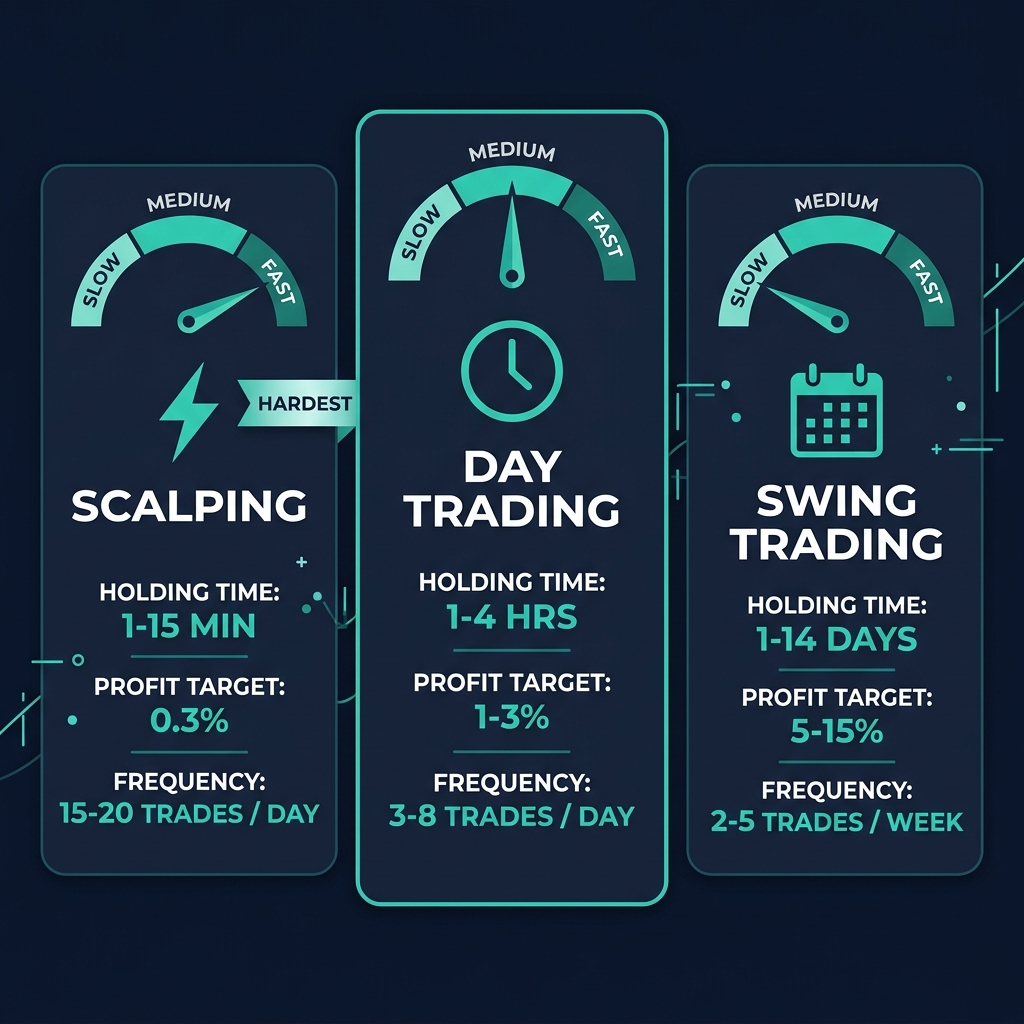
Scalping vs Day Trading vs Swing Trading
Before diving into setups, let's be precise about what scalping actually is — because "scalping" gets thrown around loosely, and the distinction matters for your toolkit, your risk rules, and your mental approach.
Dimension
Scalping
Day Trading
Swing Trading
Hold Time
30 seconds – 30 minutes
1 – 8 hours
2 – 14 days
Primary Timeframe
1m – 5m (15m for context)
15m – 1H (4H for context)
4H – Daily (Weekly for context)
Trades per Day
8 – 20
2 – 5
0 – 2 per week
Win Rate Needed
55 – 65%
45 – 55%
40 – 50%
Profit Target
0.15% – 0.5% per trade
0.5% – 2% per trade
3% – 15% per trade
Risk per Trade
0.25% – 0.5% of account
0.5% – 1% of account
1% – 2% of account
R:R Ratio
0.8:1 – 1.5:1
1.5:1 – 3:1
2:1 – 5:1
Fee Sensitivity
Extremely high
Moderate
Low
Screen Time
2 – 3 hours of intense focus
4 – 8 hours intermittent
30 – 60 min/day
The critical difference: scalping demands a higher win rate because your reward-to-risk ratios are compressed. A swing trader can afford to be wrong 60% of the time if winners are 3× their losers. A scalper targeting 0.3% gains with 0.25% stops needs to win at least 55% of the time just to cover fees. This isn't a forgiving style.
Notice the R:R column. Scalping is one of the few legitimate trading styles where sub-1:1 reward-to-risk can be profitable — but only if your win rate compensates. This is the mathematical reality that most scalping guides gloss over.
Scalping Prerequisites: What You Need Before Your First Trade
Attempting to scalp without the right infrastructure is like trying to race a Formula 1 car on bicycle tires. Here's the non-negotiable checklist:
Exchange and Fee Structure
Your exchange choice will make or break your scalping career. At 15+ trades per day, fees compound into a silent portfolio killer.
Fee Tier
Fee per Trade
Daily Cost (15 trades, $10K positions)
Monthly Cost
0.10% taker
$10/trade
$150
$3,000
0.05% maker
$5/trade
$75
$1,500
0.02% maker
$2/trade
$30
$600
0.00% maker (VIP)
$0/trade
$0
$0
Target: ≤0.05% maker fees. On most major exchanges, this requires either volume-based VIP tiers or holding exchange tokens for discounts. Binance VIP 1 (≥$1M monthly volume) gives 0.04% maker; Bybit VIP 1 starts at 0.02%.
Rule: Always use limit orders. Market orders on a scalp trade are financial self-harm. The combination of taker fees plus slippage on a 0.3% target trade can erase 40–60% of your profit before you even see the PnL. Limit orders only.
Minimum Account Size
Recommendation: $5,000 minimum. Here's the math on why:
Position size at 0.25% risk on $5,000 = $12.50 risk per trade
With a 0.2% stop-loss on BTC at $105,000: position size = $6,250
Fee per round trip at 0.04% maker: $5.00
Net profit on a 0.3% winner: $18.75 – $5.00 = $13.75
Net loss on a 0.2% loser: –$12.50 – $5.00 = –$17.50
With a $2,000 account, those same fees eat proportionally more of every trade. Below $5K, the fee drag makes consistent profitability nearly impossible at standard fee tiers.
Hardware and Setup
Dual monitors minimum — one for chart execution, one for order book and trade management
Wired internet connection — Wi-Fi latency spikes will cost you trades. A dropped connection during an open scalp is a nightmare scenario
Exchange hotkeys — configure one-click limit order placement. If you're clicking through order confirmation dialogues, you're too slow
Mobile backup — have your exchange app authenticated and ready in case your primary setup fails mid-trade
Knowledge Prerequisites
Before attempting to scalp, you should be comfortable with:
If you haven't spent meaningful time reading order flow, stop here and study that first. Scalping without understanding the order book is gambling with extra steps.
5 Scalping Setups That Work in 2026
Each setup below includes exact entry criteria, stop-loss placement, take-profit targets, and the specific market conditions where it performs best. These aren't theoretical constructs — they're refined for the current market environment where institutional algorithmic flow dominates BTC and ETH while altcoins like SOL ($170) still offer retail-exploitable inefficiencies.
Setup 1: EMA Ribbon Scalp (5-Minute Chart)
Best for: Trending markets, momentum continuation
Win rate (backtested): ~58%
Average R:R: 1.2:1
The EMA Ribbon uses three exponential moving averages — the 9, 21, and 55 EMA — stacked on the 5-minute chart. When all three are fanned out in order (9 > 21 > 55 for longs, inverse for shorts), you have a confirmed micro-trend.
Entry Rules (Long):
Confirm EMA stack: 9 EMA > 21 EMA > 55 EMA on the 5-minute chart
Wait for price to pull back to the 21 EMA (not just near it — a wick touch or close within 0.05% of the 21 EMA)
Confirm the pullback candle shows buying pressure: bullish engulfing, hammer, or pin bar on the 1m chart
Enter long with a limit order at the 21 EMA level
Stop-loss: Below the 55 EMA by 0.05% (typically 0.15–0.25% from entry on BTC)
Take-profit: 0.3–0.5% from entry, or when price approaches the previous 5m swing high
Example on BTC/USDT (June 2026):
BTC trending at $105,200 on the 5m chart. EMA 9 at $105,180, EMA 21 at $105,050, EMA 55 at $104,850. Price pulls back to $105,060 and prints a 1m hammer candle.
Entry: $105,060 (limit order)
Stop-loss: $104,800 (below 55 EMA) → 0.25% risk
Take-profit: $105,380 → 0.30% reward
Position size at 0.25% risk on $10K account: $25 risk ÷ $260 stop = 0.096 BTC (~$10,100)
Net profit: $320 – $8.08 fees = $311.92
When to avoid this setup: During ranging/choppy markets where EMAs flatten and intertwine. If the 9 and 21 EMAs have crossed more than twice in the last 30 candles, the ribbon is unreliable — wait for a clean stack.
Best for: Mean reversion during established intraday trends
Win rate (backtested): ~62%
Average R:R: 1:1
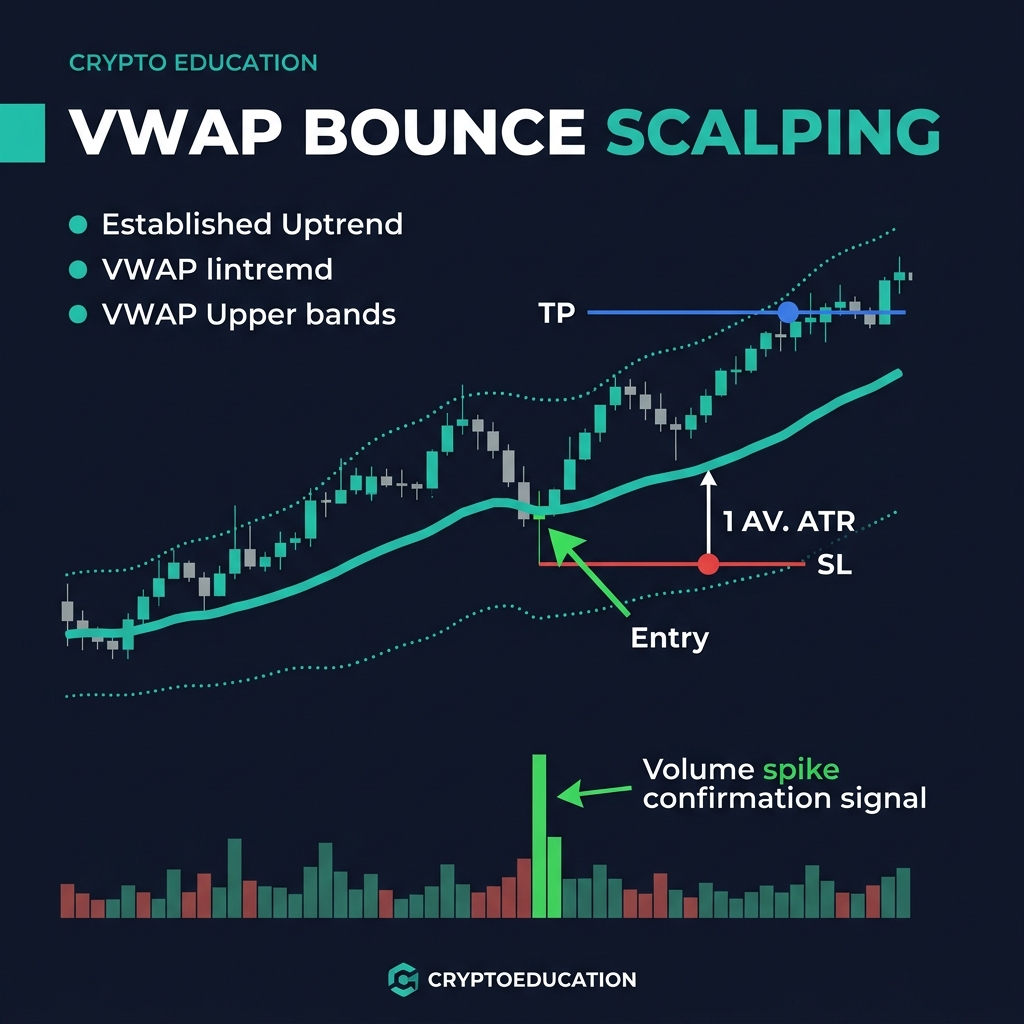
The Volume-Weighted Average Price resets daily and acts as an intraday magnet. Institutional algorithms heavily reference VWAP for execution benchmarking, which creates reliable bounce-and-reject dynamics. This is arguably the single most important level for crypto scalping in 2026.
Entry Rules (Long):
Price is trading above VWAP, confirming bullish intraday bias
Price pulls back to touch VWAP (within 0.03% of the VWAP line)
Volume on the pullback is decreasing — selling pressure is drying up
A 1m candle closes bullish at or above VWAP (the "respect" candle)
Enter long on the close of the respect candle via limit order
Stop-loss: Below VWAP by 1× the current ATR(14) on the 5m chart (typically 0.15–0.20% on BTC)
Take-profit: Upper VWAP standard deviation band, or 0.25–0.4% from entry
Example on ETH/USDT:
ETH trading at $2,815 in an uptrend. Daily VWAP sits at $2,798. Price pulls back to $2,800 on declining volume. A 1m bullish engulfing forms closing at $2,803. ATR(14) on the 5m = $8.
Key nuance: The VWAP bounce is most reliable during the first 2–4 hours after the daily open (00:00 UTC for crypto). As the session ages, VWAP becomes less responsive because accumulated volume smooths out the average. After 12+ hours, favor other setups.
Check our comprehensive VWAP trading guide for band calculations and advanced anchored VWAP techniques.
Setup 3: Order Flow Scalp (1-Minute Chart)
Best for: High-volume environments, news reactions, support/resistance tests
Win rate (backtested): ~55%
Average R:R: 1.3:1
This is the purest form of scalping — reading the raw order book to identify where large players are positioning, then riding their coattails. It requires Level 2 data access and a solid understanding of order flow dynamics.
Entry Rules (Long):
Identify a key level: prior session high/low, round number ($105,000), or support/resistance zone
On the 1m chart, watch the order book for bid-side imbalance at the key level — large limit buy orders stacking (3× or more the average bid depth)
Enter long when delta turns positive AND price holds the key level for at least 3 consecutive 1m candles
Stop-loss: 0.15% below the key level (ultra-tight — this is a conviction trade)
Take-profit: Next visible order cluster on the ask side, or 0.2–0.35% from entry
Reading the Order Book — What to Look For:
Signal
Bullish
Bearish
Bid depth vs ask depth
3:1+ bid heavy
3:1+ ask heavy
Delta direction
Flipping positive
Flipping negative
Large orders
Bids stacking at round numbers
Asks stacking at round numbers
Spoofing check
Bids hold when price approaches
Orders pulled before fill
Spoofing Warning: Large orders that disappear when price approaches them are likely spoofed. Experienced scalpers learn to distinguish real institutional bids from fake walls by watching how the orders behave as price gets within 0.05% of them. If an order consistently retreats, it's not real support — it's a trap.
This setup has the steepest learning curve of all five. Budget 2–3 months of observation (paper trading or micro positions) before sizing up. CoinXSight's Order Flow module can help visualize delta shifts and identify absorption patterns that are difficult to spot on raw exchange data.
Setup 4: Bollinger Band Mean Reversion (5-Minute Chart)
Best for: Ranging/consolidating markets, post-trend exhaustion
Win rate (backtested): ~60%
Average R:R: 1.1:1
When markets aren't trending, EMA and VWAP setups underperform. That's when mean reversion with Bollinger Bands takes over. The principle is simple: price touching the outer bands during low-momentum conditions tends to revert to the middle band (20-period SMA).
Entry Rules (Long):
Market is ranging — confirm by checking that the ADX indicator on the 5m chart is below 20
Price touches or closes below the lower Bollinger Band (20-period, 2 standard deviations)
RSI(14) on the 5m chart reads below 30 — oversold confirmation
Wait for the first 5m candle that closes back inside the Bollinger Band (re-entry candle)
Enter long at the close of the re-entry candle
Stop-loss: Below the wick low of the candle that pierced the lower band, plus 0.05% buffer
Take-profit: The 20-period SMA (middle Bollinger Band), or 0.25–0.4% from entry
Example on SOL/USDT:
SOL ranging between $168 and $173. ADX at 16. Price drops to $167.80, closing below the lower Bollinger Band at $168.20. RSI(14) hits 27. Next 5m candle closes at $168.50 (back inside the band).
Take-profit: $170.10 (middle BB / SMA 20) → 0.95% reward
R:R = 1.7:1
Position size at 0.25% risk on $10K account: $25 ÷ $0.95 per SOL = 26.3 SOL (~$4,430)
Critical filter: Do NOT take this setup if the market just broke out of a range and is establishing a new trend. Bollinger Band squeezes that resolve into breakouts will run right through your stop. Check the 15m chart structure — if higher timeframes show trending behavior, skip the mean reversion.
Best for: High-leverage environments, volatile sessions, post-news reactions
Win rate (backtested): ~52%
Average R:R: 1.8:1
⚠️ This is the most advanced and highest-risk setup. It requires real-time liquidation data, understanding of funding rates and open interest, and the nerve to trade into panicking markets. The reward potential is the highest of all five setups, but the drawdown risk is equally elevated.
The Concept: When leveraged positions are crowded on one side (e.g., excessive longs with high funding rates), a sudden price move against them triggers cascading liquidations. These liquidations create artificial, momentum-driven price spikes that almost always overshoot fair value. The scalp trades the snapback.
Entry Rules (Long — after a short liquidation cascade):
Pre-condition: Funding rate is significantly negative (below –0.03%) on major exchanges, indicating crowded shorts
Trigger: A sharp price spike upward (>0.5% in under 2 minutes) accompanied by a spike in liquidation volume (visible on Coinglass or CoinXSight)
Wait for the cascade to exhaust — identified by the first 1m candle that closes with a long upper wick (buyers losing momentum after the squeeze)
Do NOT enter the cascade itself. Wait for the pullback.
Enter long when price retraces 40–50% of the cascade move and holds (look for a 1m support bounce)
Stop-loss: Below 61.8% retracement of the cascade move
Take-profit: Re-test of the cascade high, or 0.4–0.7% from entry
Pre-Trade Checklist for Liquidation Cascades:
[ ] Funding rate at extreme (>|0.03%|) — check 3+ exchanges for confirmation
[ ] Open interest elevated above 20-day average — crowded positioning confirmed
[ ] Liquidation volume spikes 5×+ above average in real-time data
[ ] 40–50% retracement level identified from Fibonacci tools
[ ] Position size calculated at 0.25% risk (no exceptions on this setup)
Why this setup has a lower win rate but higher R:R: Cascades are chaotic. Sometimes what looks like exhaustion is just a pause before a second wave. The tight stop at 61.8% retracement filters out the setups where you're wrong, and when you're right, the snapback to cascade highs delivers outsized winners.
Scalping Risk Management: Rules That Keep You Solvent
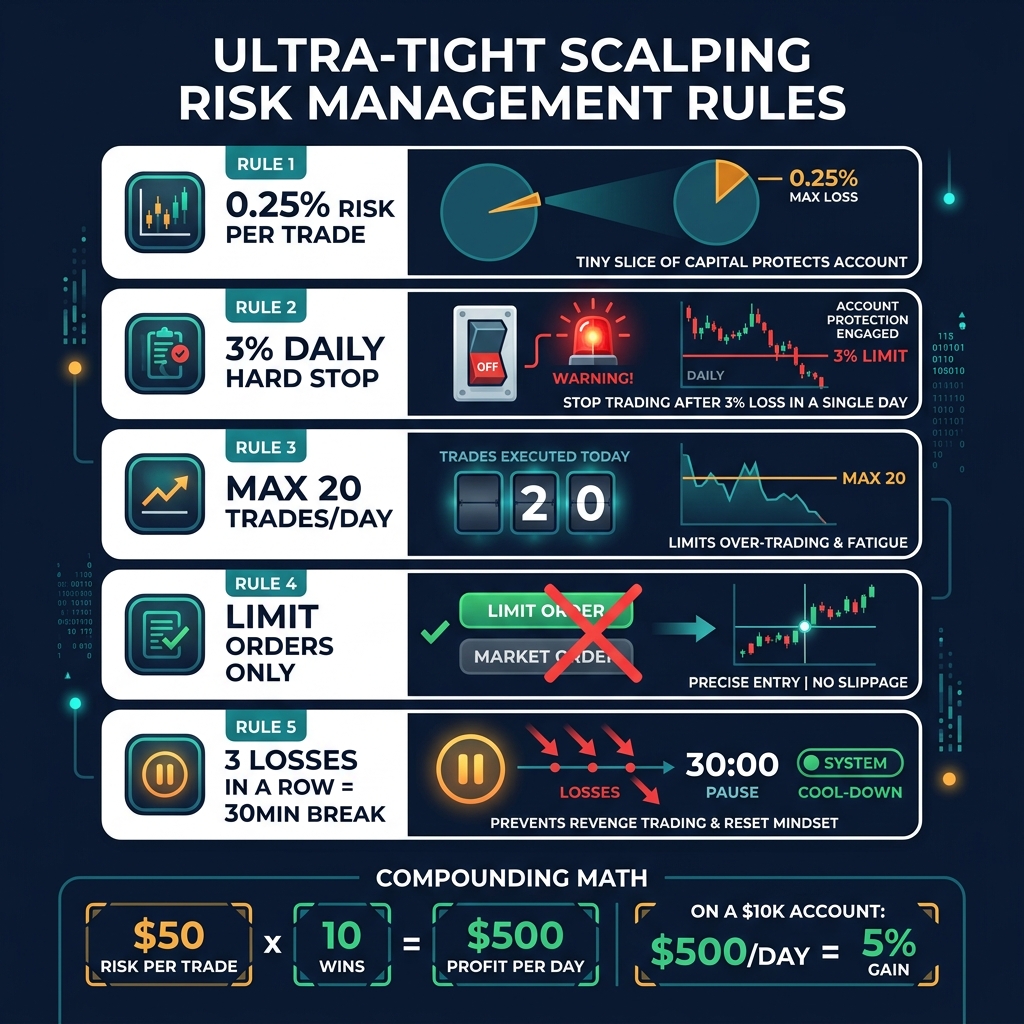
Standard risk management rules need to be tightened significantly for scalping. The speed and frequency of trades mean that normal 1% risk-per-trade guidelines can compound into catastrophic drawdowns in a single session.
The Scalper's Risk Framework
Rule
Parameter
Rationale
Risk per trade
0.25–0.5% of account
At 15 trades/day, 1% risk creates 15% daily exposure
Maximum daily loss
3% of account
Hard stop — close all charts, walk away
Maximum consecutive losses
3 in a row
Triggers mandatory 30-minute break
Maximum trades per day
15–20
Prevents revenge trading and overtrading
Order type
Limit orders only
Taker fees + slippage erode thin margins
Maximum open positions
1 at a time
Scalps require full attention
Scaling in/out
Not recommended
Entry precision matters more than position management
Position Sizing Formula for Scalpers
The formula is the same as any trading style, but the inputs are different:
Position Size = (Account × Risk%) ÷ Stop Distance

Where:
- Account = total trading capital
- Risk% = 0.25% for standard setups, 0.50% max for high-conviction
- Stop Distance = entry price – stop-loss price (in %)
Worked Example (BTC/USDT, $10,000 Account):
Variable
Value
Account
$10,000
Risk%
0.25%
Dollar risk
$25
Entry price
$105,100
Stop-loss
$104,890
Stop distance
$210 (0.20%)
Position size
$25 ÷ $210 × $105,100 = $12,512
BTC quantity
0.119 BTC
Fees (0.04% maker, round trip)
$10.01
Net risk after fees
$35.01
Notice how fees increase your effective risk from $25 to $35.01. This is why fee optimization is existential for scalpers. At 0.10% taker fees, those same fees would be $25.02 — effectively doubling your risk per trade.
The 3% Daily Stop-Loss: Non-Negotiable
If you lose 3% of your account in a single session, you are done for the day. No exceptions. No "one more trade to make it back."
On a $10,000 account, 3% = $300. At 0.25% risk per trade, that's 12 consecutive losers. If you somehow manage to lose 12 in a row, the market is telling you something your ego doesn't want to hear: your read on the current conditions is wrong.
Track your daily PnL in real-time. CoinXSight's Deep Alpha dashboard makes this easier by aggregating your trade performance metrics, but even a simple spreadsheet works. The tool matters less than the discipline.
Scalping Psychology: The Mental Game
Every trading style demands emotional control, but scalping compresses the psychological pressure into an extreme, concentrated window. You're making decisions that matter in seconds, dozens of times per session. The psychological frameworks that apply to swing trading need to be adapted for this intensity.
Speed vs. Accuracy: The Scalper's Dilemma
New scalpers fall into two traps:
Too slow: They see a setup, hesitate, analyze for 30 seconds, and enter late — buying at the price that should have been their take-profit
Too fast: They see a pattern that vaguely resembles a setup, enter immediately, and get stopped out because they didn't confirm the checklist
The solution is pre-programmed responses. Before the session begins, you should know exactly:
Which 2–3 setups you're hunting today
The specific price levels where those setups would trigger
Your position size (pre-calculated, not calculated during the trade)
Your stop and target (entered as bracket orders immediately after entry)
When the setup appears, execution should take under 5 seconds. Not because you're rushing, but because you've already made 90% of the decisions before the market opened.
The Compounding Mindset: Small Wins, Big Results
Scalping profits look unimpressive in isolation. A 0.3% gain on a $10,000 position is $30. That feels like nothing compared to the swing trader who just caught a 5% ETH move.
But run the numbers over a month:
Metric
Conservative
Moderate
Aggressive
Avg profit per winning trade
$25
$40
$60
Avg loss per losing trade
–$30
–$35
–$45
Win rate
58%
60%
62%
Trades per day
10
12
15
Daily net PnL
$45
$132
$232.50
Monthly net PnL (20 days)
$900
$2,640
$4,650
Even the conservative scenario generates $900/month on a $10,000 account — a 9% monthly return. The aggressive scenario approaches 46%. These are realistic numbers for a disciplined scalper, but they require the win rates and consistency that only come from months of practice.
The key phrase is "small wins compound." A $40 winner doesn't feel significant. Ten $40 winners with three $35 losers in a single session is $295 net. Do that 20 days per month and you're looking at $5,900. The math works — the question is whether your psychology can sustain the monotony of small, repetitive wins without deviating from the plan in search of "bigger" trades.
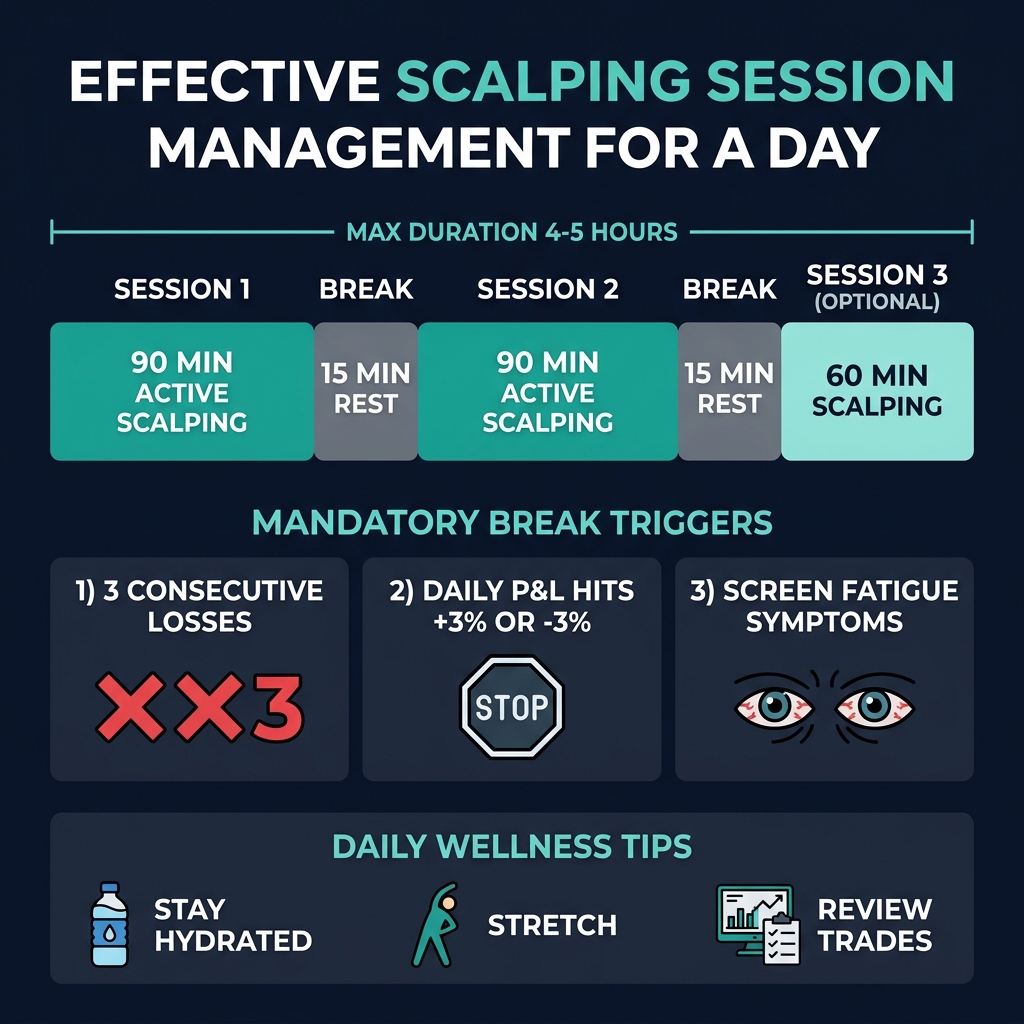
2% daily drawdown reached → Reduce position size by 50% for remaining session
3% daily drawdown → Session over. No exceptions
2.5 hours of continuous scalping → 15-minute break regardless of PnL
Screen fatigue is real and measurable. Studies on high-frequency decision-making show that accuracy drops by 15–25% after 2 hours of sustained concentration. Scalpers who push through fatigue don't just lose money — they make progressively worse decisions that compound into the kind of sessions that blow accounts.
Structure your trading day in blocks:
Block 1 (90 minutes): Peak focus session — execute your best setups
Break (20 minutes): Walk away completely. No charts on your phone
Block 2 (60–90 minutes): Second focus session, slightly reduced aggression
That's a 3.5-hour trading day. It doesn't sound like much, but those 3 hours of high-quality execution will outperform 8 hours of unfocused screen staring every time.
Tools for Crypto Scalping in 2026
The tool stack matters more for scalping than for any other trading style. Milliseconds of latency and minor data gaps that are irrelevant to swing traders become critical failure points when you're trading 0.2% moves.
Charting and Execution
Tool
Purpose
Why It Matters for Scalping
TradingView Premium
Charting, alerts, indicator stacking
Sub-second chart updates, server-side alerts, up to 25 indicators per chart
Exchange native charts
Order execution
Lowest latency — chart and order entry on same platform
CoinXSight Chart Pro
Technical analysis + AI confluence
Chart Pro overlays ASI Score directly on charts for instant signal validation
Order Flow and Liquidation Data
Tool
Purpose
Scalping Use Case
CoinXSight Order Flow module
Delta visualization, absorption detection
Identifies Setup 3 entries — bid/ask imbalances at key levels
Coinglass
Liquidation data, funding rates, OI
Essential for Setup 5 — real-time liquidation cascade detection
Exchange Level 2 data
Raw order book depth
Direct order flow reading for active scalpers
Signal Discovery and Validation
CoinXSight's Alpha Hunter can flag potential scalping opportunities by surfacing coins with unusual volume spikes or sudden momentum shifts. While Alpha Hunter is primarily designed for swing-timeframe signals, the underlying data — particularly the ASI Score momentum component — can help scalpers identify which assets have the most favorable conditions for short-term setups.
The Deep Alpha dashboard is particularly useful for post-session review: tracking your win rates across different setups, identifying which time blocks produce your best returns, and monitoring whether your actual risk per trade matches your planned risk.
Exchange API Execution
For serious scalpers placing 15+ trades per day, consider using exchange APIs with pre-configured order scripts. Benefits include:
[ ] Update your running statistics: win rate, average R:R, best/worst setup
Common Scalping Mistakes (And How to Fix Them)
Even experienced traders stumble when transitioning to scalping. Here are the most frequent errors:
1. Using market orders "just this once"
Fix: Delete market order buttons from your exchange interface if possible. There is no scenario where a market order improves a scalp. If you can't get filled on a limit order, the setup wasn't valid — move on.
2. Widening stops on losing trades
Fix: Enter bracket orders at the moment of entry. Once the stop is set, it cannot be moved further from entry. Moving it closer is acceptable (trailing), moving it wider is never acceptable.
3. Scalping illiquid altcoins
Fix: Stick to top-10 assets by volume. BTC, ETH, SOL, and other high-liquidity pairs. If the bid-ask spread is wider than 0.03%, the asset is too illiquid for scalping. The spread alone will destroy your edge.
4. Trading during low-volume hours
Fix: Focus on session overlaps. The highest-volume windows for crypto in 2026 are 08:00–11:00 UTC (Asian close / European open) and 13:00–16:00 UTC (US session). Weekend volume on most pairs drops 40–60%, making scalping significantly harder.
5. Ignoring cumulative fees
Fix: Track fees as a separate line item in your daily PnL. If fees represent more than 30% of your gross profits, you either need a lower fee tier or fewer trades. CoinXSight's performance tracking can help isolate fee impact across your trading history.
Frequently Asked Questions
Can beginners scalp crypto?
Honestly, no — not successfully. Scalping requires a foundation of skills that only develop through months of screen time on higher timeframes: pattern recognition, order flow reading, emotional regulation under pressure, and intuitive position sizing. The recommended path is 3–6 months of swing trading to learn market structure, followed by 2–3 months of day trading to develop intraday skills, and only then transitioning to scalping with reduced position sizes. Attempting to learn trading by starting with scalping is like learning to drive in a Formula 1 car — technically possible, but the failure rate is extreme.
How much money do you need to start scalping crypto?
A realistic minimum is $5,000. Below this level, trading fees consume a disproportionate percentage of your already-thin margins. On a $2,000 account at 0.04% maker fees, a round trip on a $2,000 position costs $1.60 — which doesn't sound like much until you realize that your profit target on a 0.3% gain is only $6. Fees eating 27% of your gross profits before any losses makes consistent profitability extremely difficult. With $5,000–$10,000, the fee-to-profit ratio becomes manageable, and position sizes are large enough to generate meaningful daily returns.
What is the best timeframe for scalping crypto?
The 5-minute chart is the most versatile starting timeframe for crypto scalping. It offers enough price action detail for precise entries while filtering out much of the noise that makes the 1-minute chart challenging. Most scalpers use a dual-timeframe approach: the 5m for setups and entries, with the 1m for fine-tuned execution timing. The 15-minute chart serves as context for trend direction. Pure 1-minute scalping (Setups 3 and 5 in this guide) is reserved for experienced scalpers who have mastered order flow reading, as the noise-to-signal ratio on the 1m chart is significantly higher.
How many trades should a scalper take per day?
Between 8 and 20 is the productive range for most scalpers. Fewer than 8 trades suggests you're either being too selective (missing valid setups) or the market conditions aren't suitable for scalping that day. More than 20 trades almost always indicates overtrading — taking marginal setups that don't fully meet your criteria. Track your win rate by trade count: if your win rate drops after trade 12 or 15, that's your personal overtrading threshold. Quality of setups always matters more than quantity, and the best scalping sessions are often 8–10 high-conviction trades rather than 20 mediocre ones.
Is crypto scalping profitable in 2026?
Yes, but with important caveats. The 2026 crypto market offers favorable conditions for scalping: BTC and ETH have deep enough liquidity to absorb scalping-size positions without slippage, exchange fee structures have become more competitive, and intraday volatility (particularly around institutional trading hours) creates consistent opportunities. However, algorithmic market making has become more sophisticated, which means the easy edge that scalpers had in 2020–2021 has narrowed. Profitable scalping in 2026 requires better tools — specifically order flow data and AI-assisted pattern recognition like CoinXSight's confluence scoring — and stricter risk management than in previous market cycles.
What's the difference between scalping and high-frequency trading?
Scalping is a manual trading strategy where humans identify setups and execute trades, typically holding for 30 seconds to 30 minutes. High-frequency trading (HFT) is fully automated, executed by algorithms that hold positions for milliseconds to seconds, and requires co-located servers at exchange data centers. As a retail trader, you are scalping, not doing HFT. The two strategies target fundamentally different edges: scalpers exploit technical patterns and order flow imbalances, while HFT exploits latency advantages and micro-structural inefficiencies. You will never beat an HFT algorithm on speed — but you can exploit patterns that algorithms aren't designed to trade.
Summary
Crypto scalping is the most demanding trading style — but for those who master it, the most consistent. The five setups in this guide cover the full spectrum of market conditions: EMA Ribbon for trends, VWAP Bounce for intraday mean reversion, Order Flow for reading institutional activity, Bollinger Band mean reversion for ranges, and Liquidation Cascade for volatility events.
The framework that makes all of it sustainable is ruthless risk management: 0.25% risk per trade, 3% daily hard stop, limit orders only, and mandatory breaks after consecutive losses. Without these rules, even the best setups will bleed your account through fees, overtrading, and emotional decisions.
Start by mastering one setup on paper. When you can demonstrate a 55%+ win rate across 100 simulated trades, move to real capital at minimum position size. Scale up slowly. The scalpers who survive aren't the ones with the most talent — they're the ones with the most discipline.
This article is for educational purposes only and does not constitute financial advice. Scalping involves substantial risk of loss and is not suitable for all traders. Past performance and backtested results do not guarantee future returns. Always trade with capital you can afford to lose.