How to Build a Complete Crypto Trading System (Step-by-Step)
Build a structured trading system from scratch using CoinXSight's integrated modules — from market scanning to backtest validation. A complete framework for consistent profitability.
MC
Marcus ChenSenior Quantitative Strategist·May 17, 2026 · 14 min read · Updated Oct 6
The uncomfortable truth about crypto trading is that most participants lose money — not because they lack knowledge, but because they lack a system. They trade based on gut feelings, chase green candles on Twitter, and make different decisions every day depending on their mood.
A trading system eliminates this inconsistency. It defines exactly what to trade, when to enter, when to exit, how much to risk, and how to validate that the approach actually works. The difference between a professional trader and an amateur isn't talent — it's process.
This guide walks you through building a complete trading system using CoinXSight's integrated modules. Each step includes real platform screenshots and specific, actionable instructions that you can implement immediately.
The 6 Components of a Complete Trading System
Every professional trading system contains six essential components. Skip any one of them and the system breaks down:
Market Context — Understanding the current environment before making any decisions
Opportunity Discovery — Systematically finding potential trades instead of random browsing
Signal Validation — Confirming opportunities through multi-layer analysis
Risk Management — Calculating position sizes and defining loss limits before entry
Execution Rules — Specific entry, stop-loss, and take-profit levels with no ambiguity
Performance Review — Backtesting strategies and reviewing results to improve over time
Let's build each component using CoinXSight's modules.
Step 1: Market Context — Understanding the Playing Field
Before looking at any individual token, you need to understand the current market regime. Trading a bullish strategy in a bearish market is the fastest way to lose money.
Using the AI Terminal for Macro Assessment
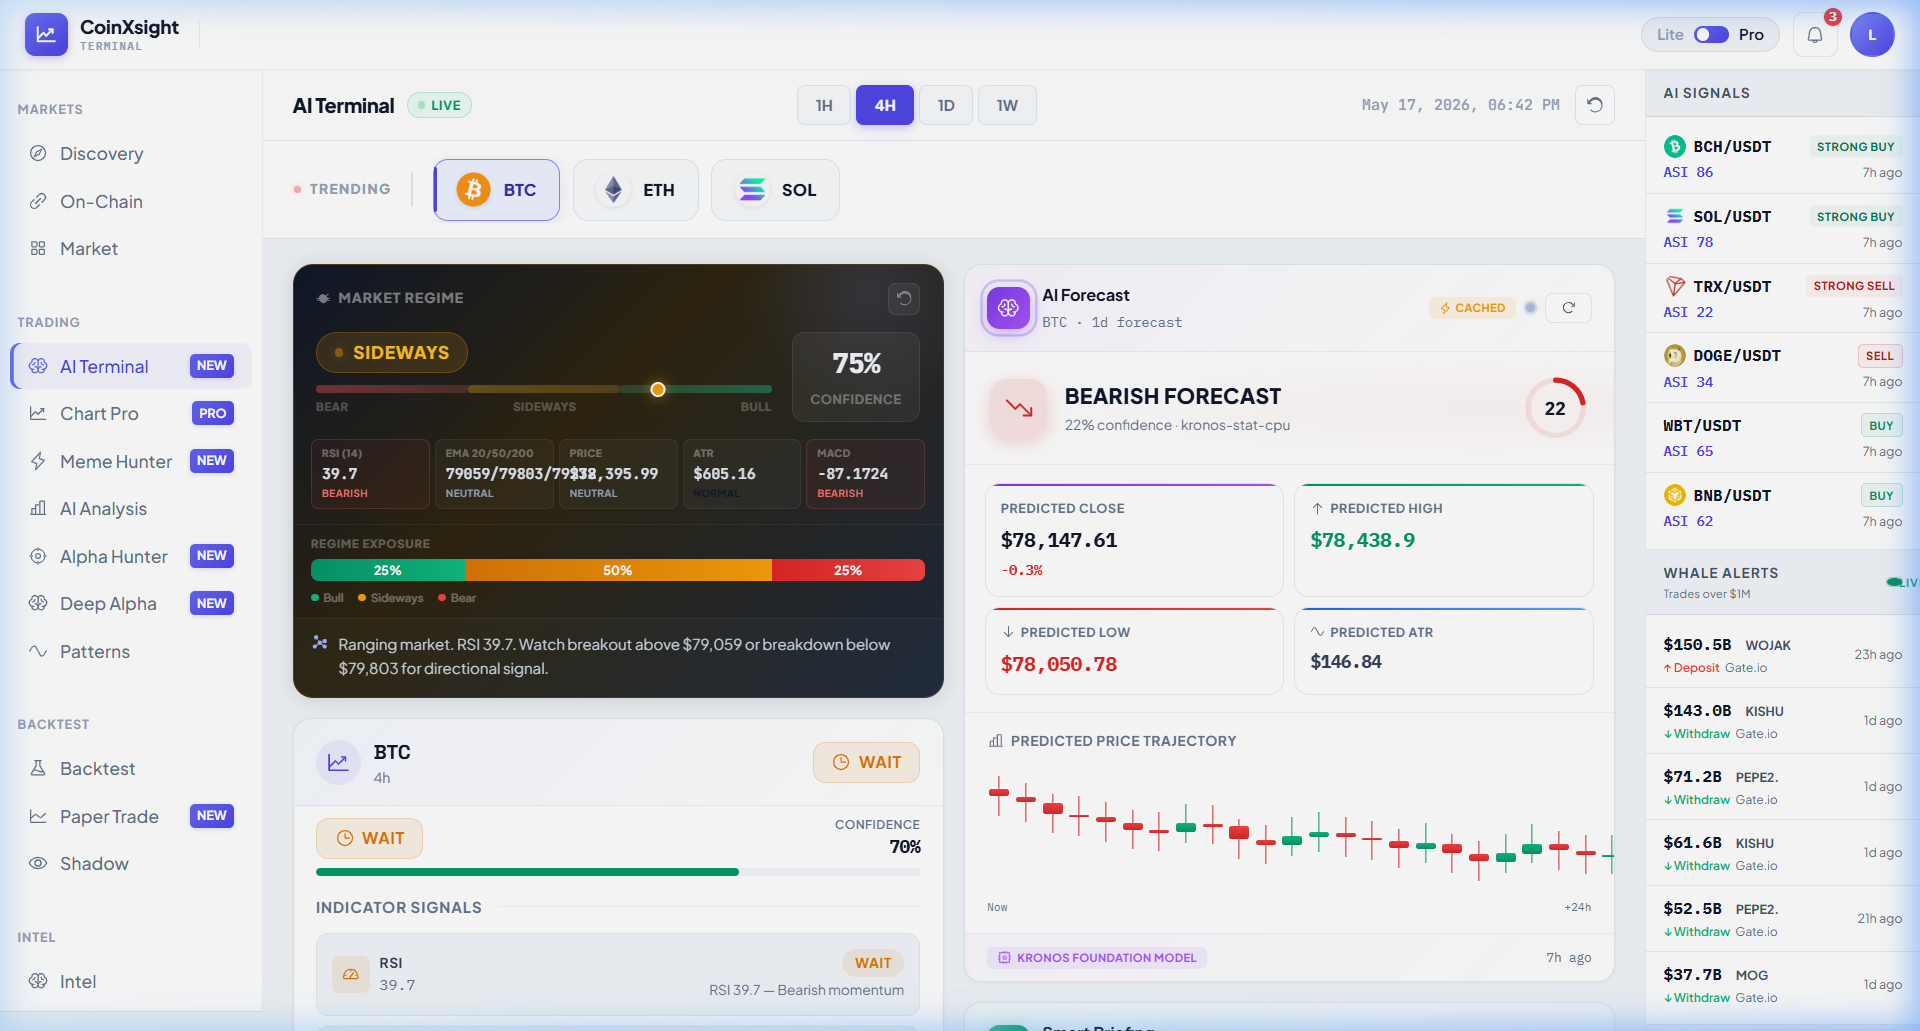
The AI Terminal provides instant macro context across three dimensions:
Market Regime (center panel):
The regime indicator currently reads SIDEWAYS with 75% confidence. This tells you:
Trend-following strategies will underperform (don't chase breakouts)
Mean-reversion strategies are appropriate (buy dips to support, sell rallies to resistance)
Reduce position sizes — sideways markets produce more false signals
Regime Exposure bar (25% Bull / 50% Sideways / 25% Bear):
This granular breakdown shows the market is genuinely uncertain. When no single regime dominates, the correct response is to be selective and patient.
ASI Market readings (sidebar):
The ASI scores show real-time token-level intelligence — BCH at 86 (Strong Buy), SOL at 78 (Strong Buy), while TRX sits at 22 (Strong Sell). Even in a sideways market, individual tokens can show strong directional signals.
Your System Rule: Check the AI Terminal at market open. If the market regime is SIDEWAYS or BEAR, reduce standard position sizes by 50%. Only take trades with ASI scores above 70.
Using the Market Module for Sector Analysis
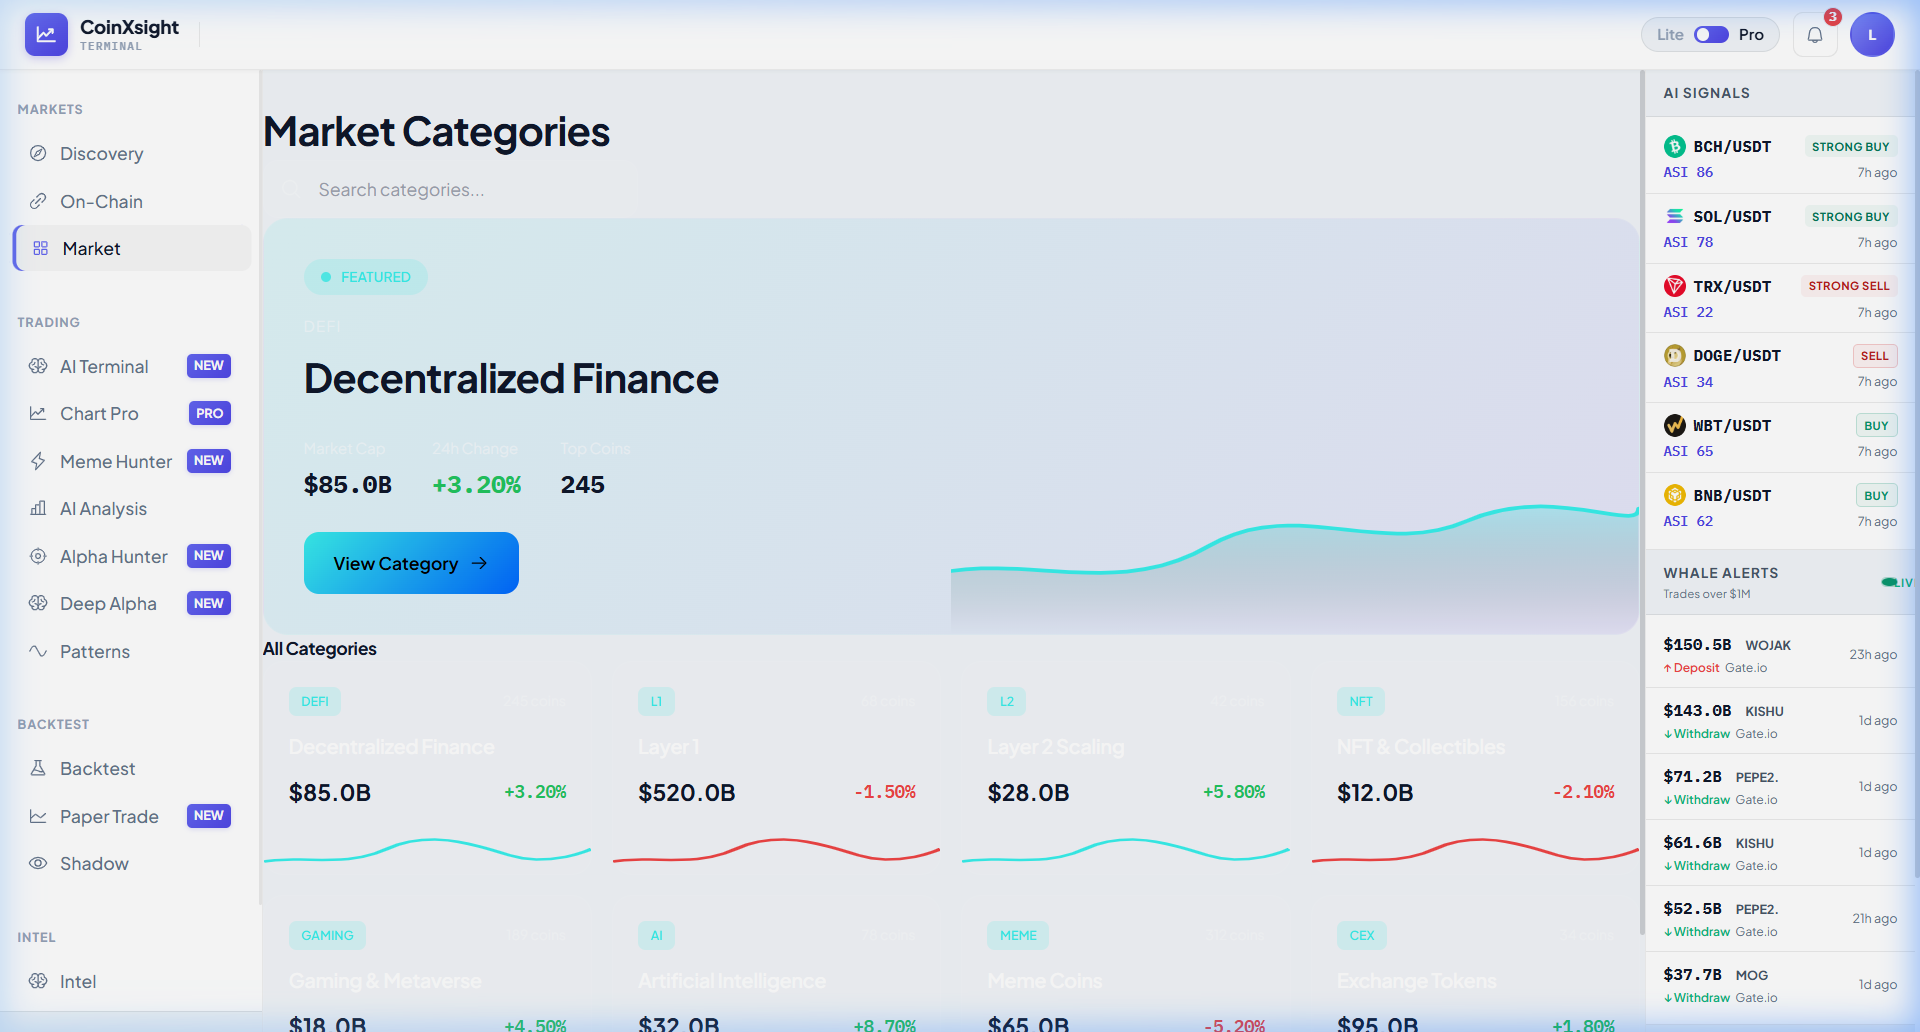
The Market module reveals which sectors are leading and lagging:
Current sector rotation (real data):
AI sector: +8.70% — Strongest performer, potential momentum plays
Your System Rule: Focus on the top 2-3 performing sectors for long opportunities. Avoid sectors showing negative momentum unless your strategy specifically targets reversals.
Step 2: Opportunity Discovery — The Signal Triage System
Random chart browsing is inefficient. A systematic discovery process ensures you evaluate every potential opportunity with consistent criteria.
Using the Discovery Module
The Discovery module acts as your systematic signal scanner:
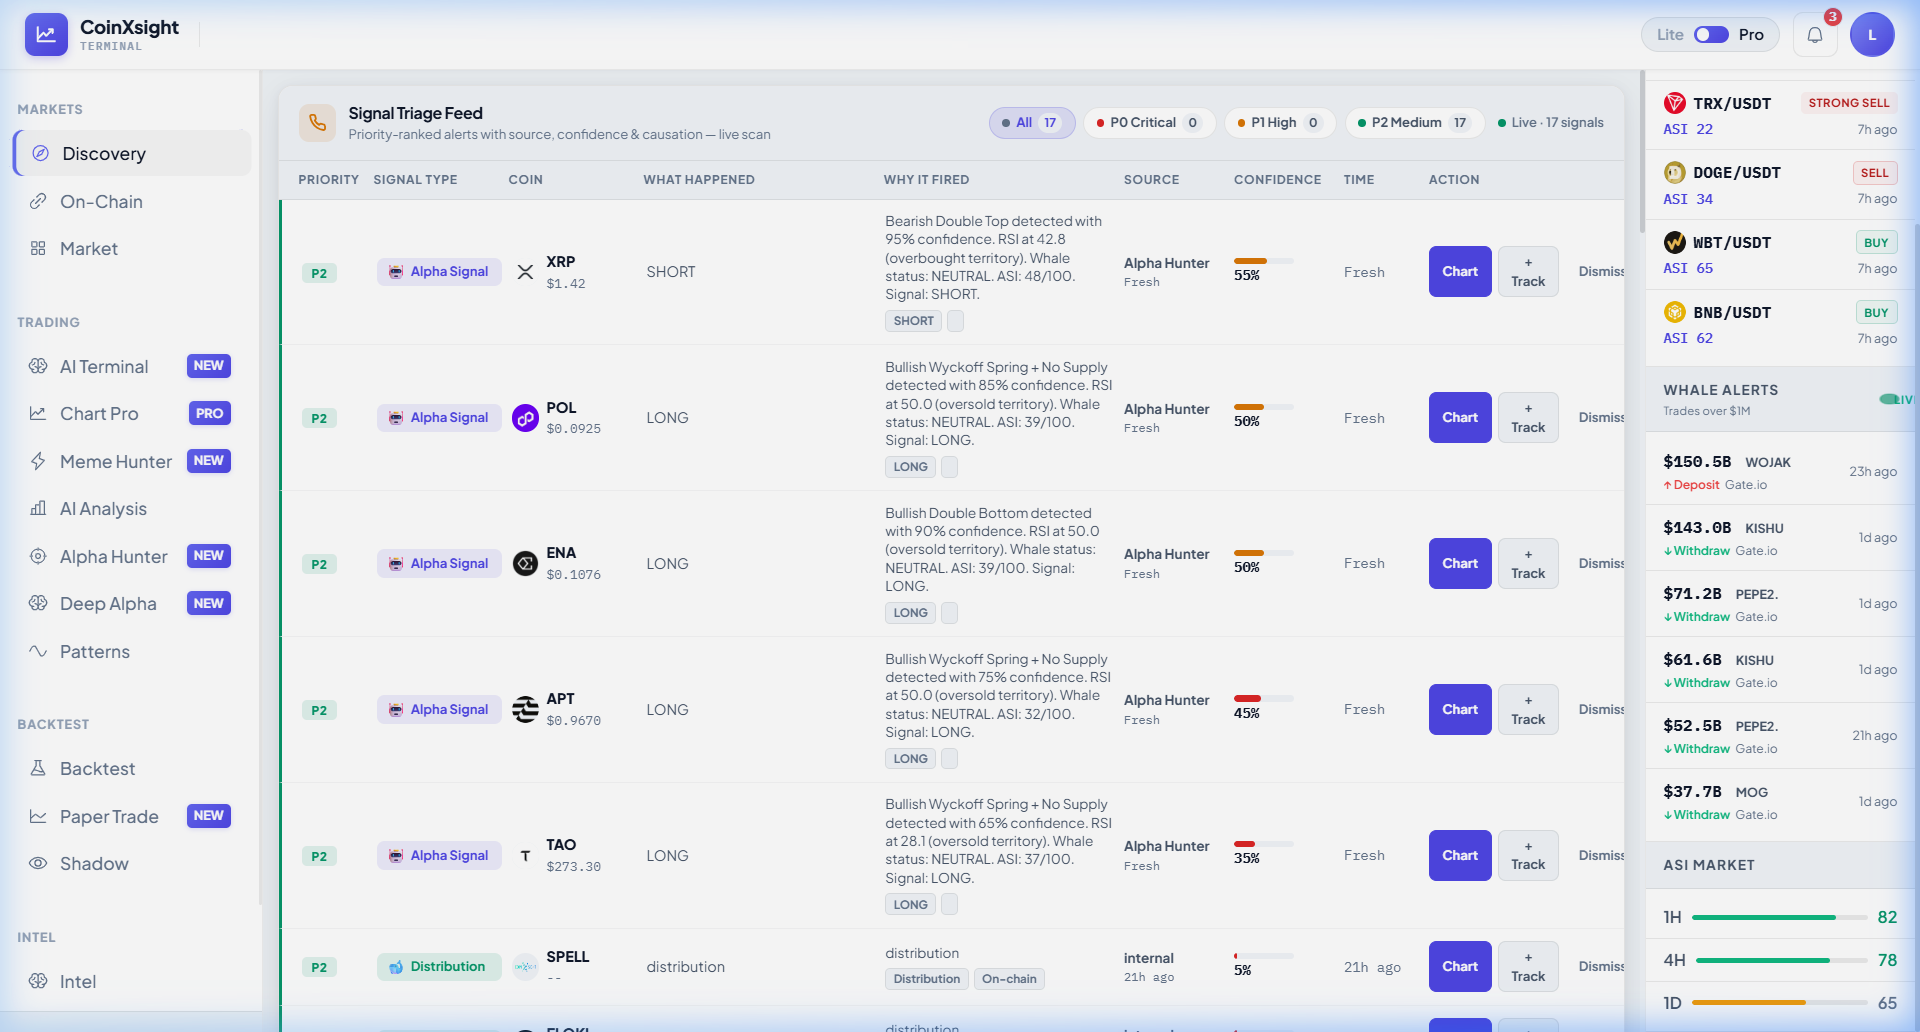
Signal Triage Feed (17 live signals):
Each signal includes critical context:
Priority Level (P2 Medium): Not urgently actionable, but worth monitoring
Signal Type: Alpha Signal (AI-generated) or Distribution (on-chain detected)
AI Reasoning: "Bullish Wyckoff Spring + No Supply detected with 85% confidence"
Confidence Percentage: 55%, 50%, 45% — higher is more reliable
Action Buttons: Chart (for visual confirmation) and +Track (add to watchlist)
Your System Rule: Add any signal with confidence above 50% to your watchlist. Ignore signals below 40% confidence. For signals between 40-50%, only add if the sector is in the top 3 performing sectors.
Using Alpha Hunter for AI-Filtered Signals
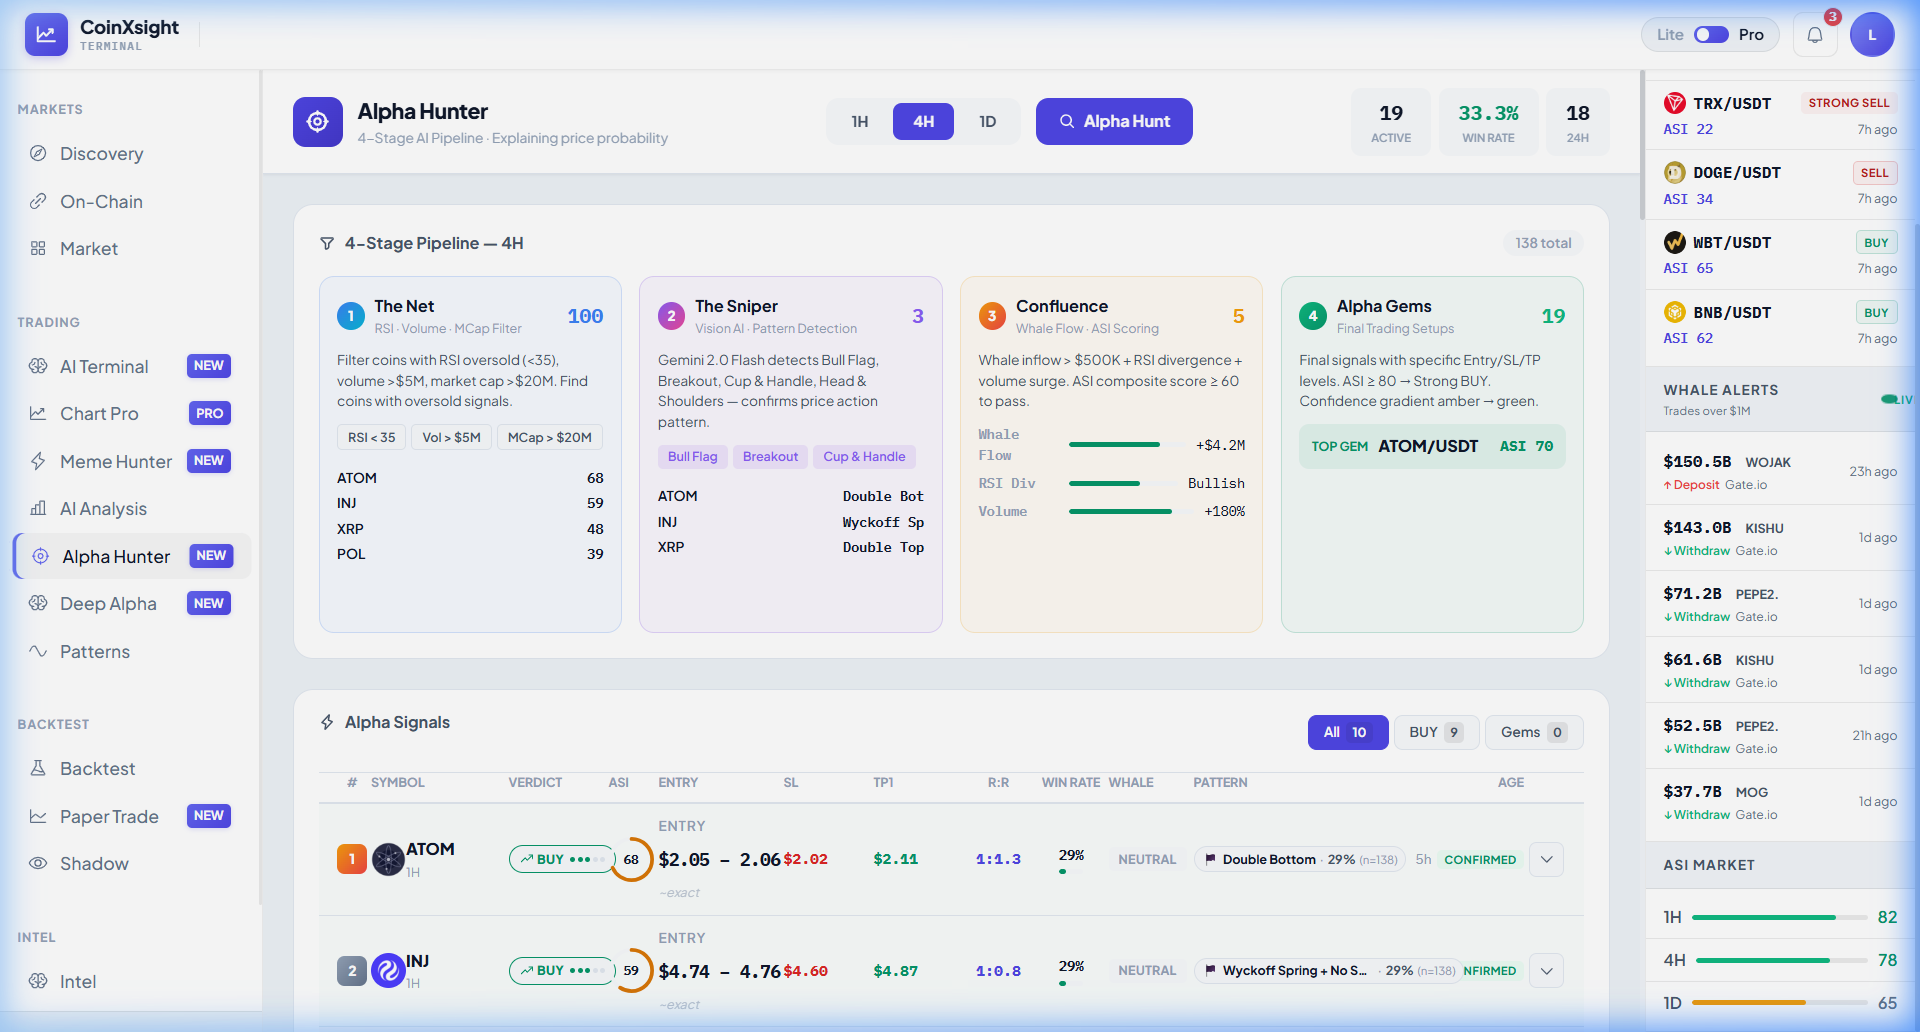
Alpha Hunter provides a higher-conviction signal set by running 138 tokens through a 4-stage AI pipeline:
The Net (100 tokens): Filters by RSI oversold (<35), volume >$5M, market cap >$20M
The Sniper (3 patterns): Vision AI detects Bull Flag, Breakout, Cup & Handle, Head & Shoulders
Your System Rule: Only trade signals that survive the full 4-stage pipeline. The pipeline's 86% rejection rate means every surviving signal has passed rigorous multi-dimensional validation.
Step 3: Signal Validation — Multi-Layer Deep Dive
Never enter a trade based on a single data source. Signal validation combines AI analysis, on-chain data, and chart patterns to build high-confidence setups.
AI Analysis: The 4-Layer Scoring System
For each candidate from Step 2, run a deep AI analysis:
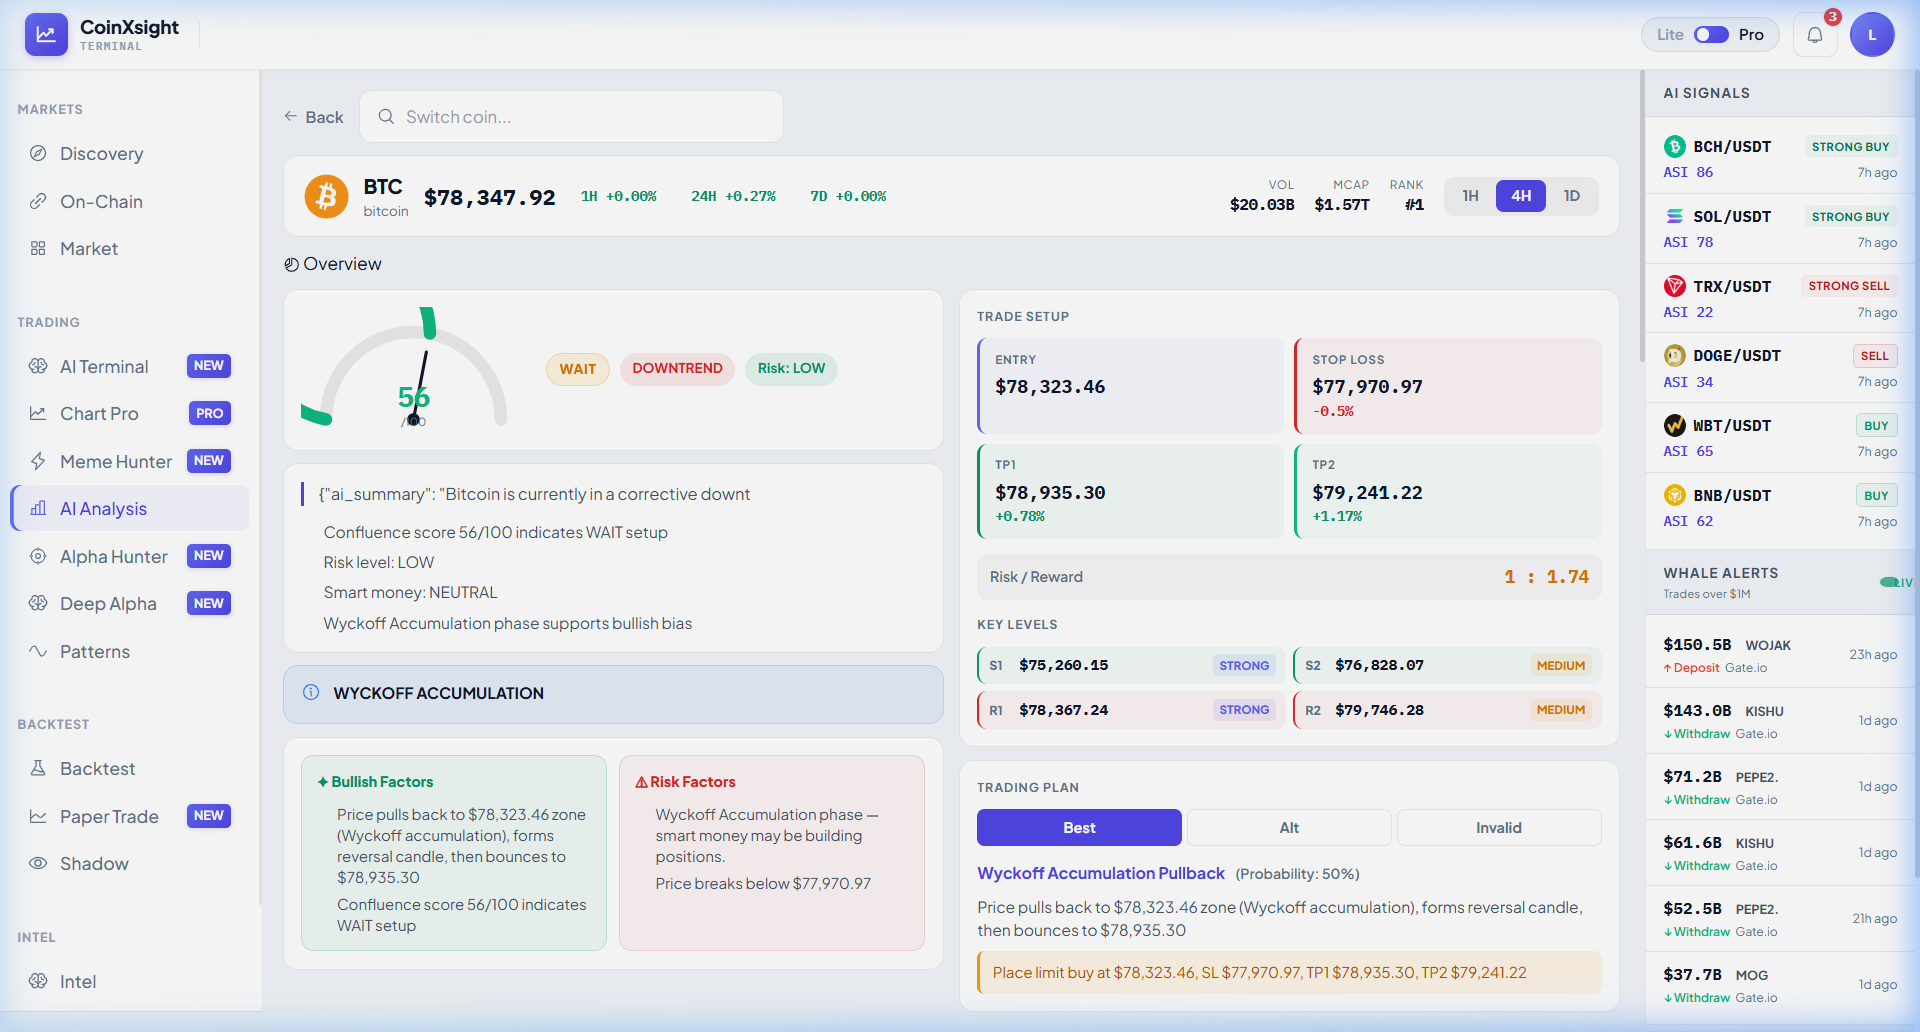
The analysis produces a Confluence Score (0-100) combining four independent layers:
Trend Layer: EMA alignment, market structure direction
Momentum Layer: RSI, MACD, StochRSI readings
Volume Layer: Volume deviation from average, breakout probability
BTC example (Score: 56 → WAIT):
The score of 56 means layers are mixed — some bullish (Wyckoff Accumulation) and some bearish (Downtrend). The correct action is WAIT until the score improves above 65+ or drops below 35 for a short setup.
Your System Rule: Only enter trades where the Confluence Score is above 65 for longs or below 35 for shorts. Scores between 35-65 = no trade, regardless of how compelling the setup appears visually.
On-Chain Confirmation
On-chain data reveals what large players are actually doing:
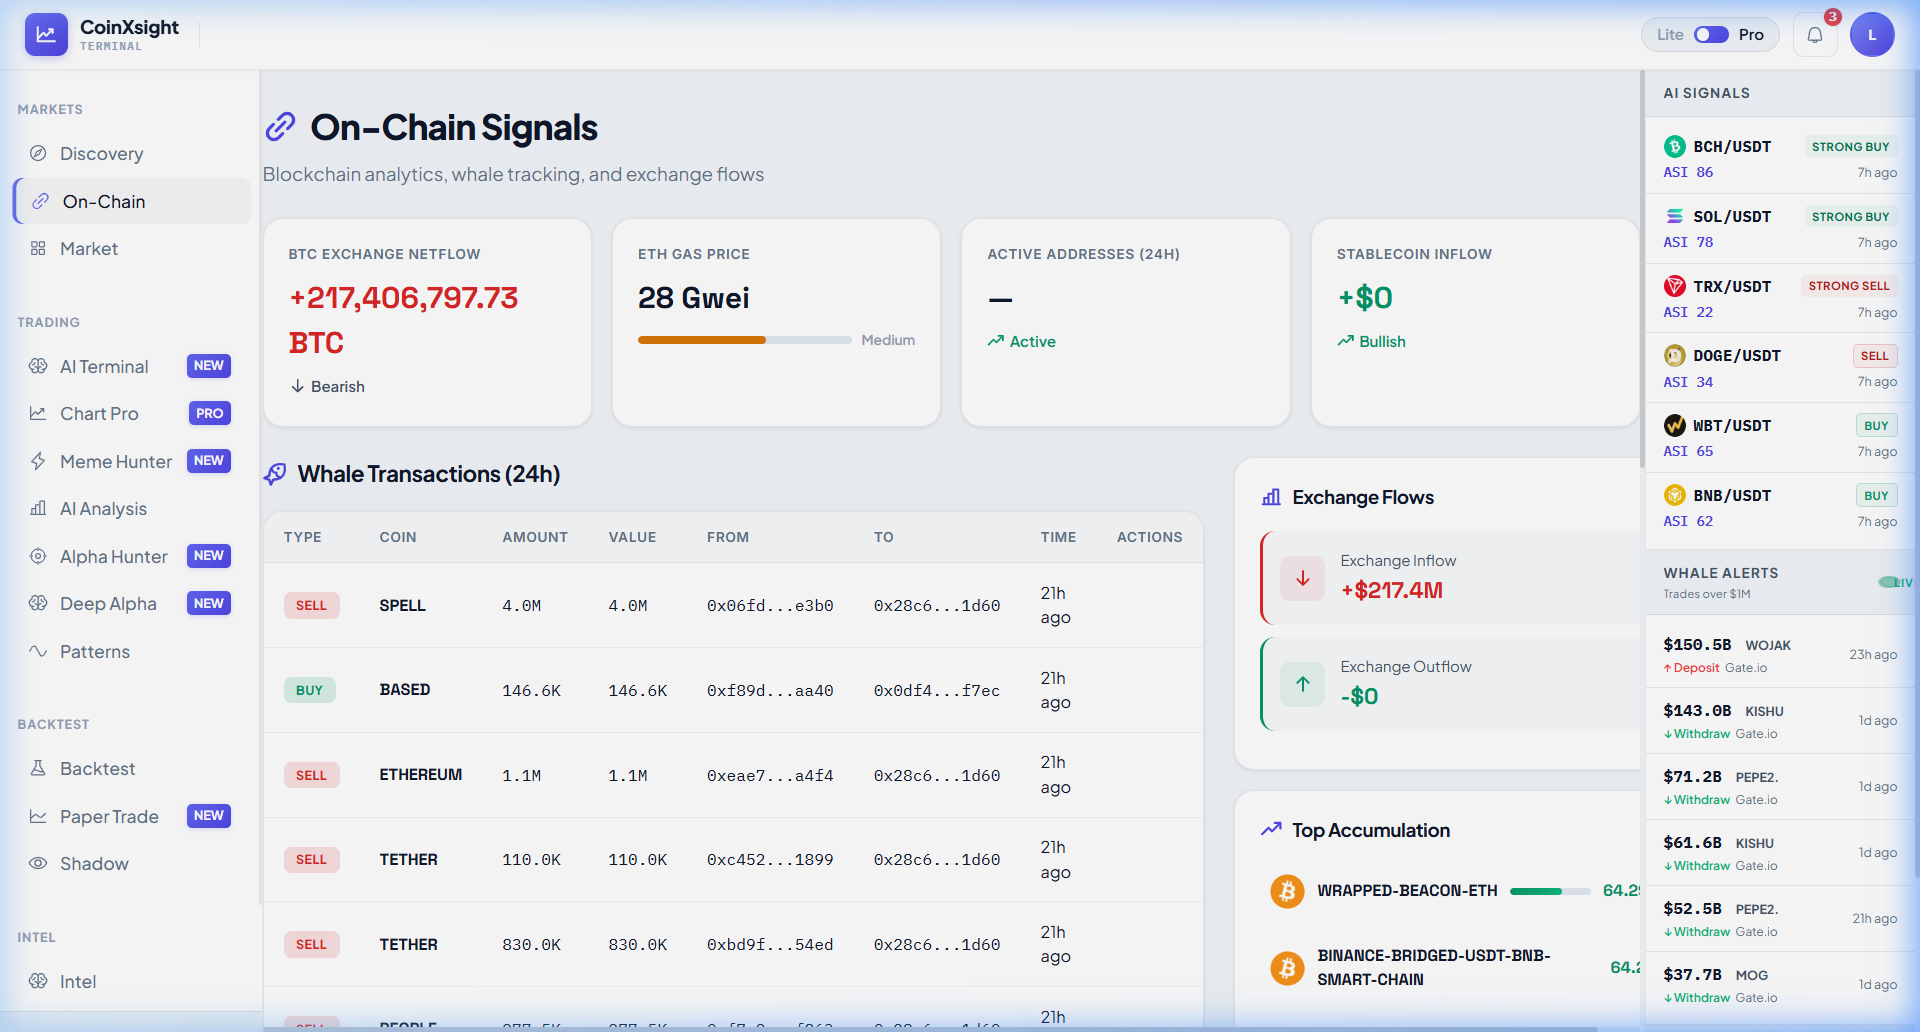
Current on-chain readings:
BTC Exchange Netflow: +$217.4M (Bearish): Net positive inflow to exchanges = selling pressure. Large holders are moving BTC to exchanges, potentially to sell.
Whale Transactions: Multiple large SELL orders (SPELL 4.0M, ETHEREUM 1.1M, TETHER 110K+) vs minimal buying (BASED 146.6K). Whale activity is net bearish.
Exchange Flows: Inflow dominates outflow — coins moving to exchanges faster than leaving.
Stablecoin Inflow: Bullish (+$0 24H): No fresh capital entering, but existing stablecoin positions are steady.
Your System Rule: If on-chain data contradicts the AI signal direction, reduce position size by 50% or skip the trade entirely. On-chain data shows what smart money is doing, which often precedes price movement. In this case, the net exchange inflow supports the AI's WAIT/bearish assessment for BTC. For a comprehensive on-chain framework, see the Exchange Flow Analysis guide.
Step 4: Risk Management — Position Sizing Before Entry
Risk management isn't optional — it's the component that keeps you alive during inevitable losing streaks. Every trade must have predetermined risk before entry.
The 1-2% Rule
Never risk more than 1-2% of your total account on a single trade. Here's the calculation:
Example with $10,000 account:
Maximum risk per trade (1%): $100
ATOM entry: $2.05
ATOM stop-loss: $2.02
Risk per token: $0.03 (1.46%)
Position size: $100 ÷ $0.03 = 3,333 tokens ($6,833 position)
This means even if the trade hits stop-loss, you only lose $100 — 1% of your account. You can survive 10 consecutive losing trades and still have 90% of your capital intact.
Risk/Reward Filter
Your System Rule: Never enter a trade with a risk/reward ratio below 1:1.5. The ATOM signal shows 1:1.3 — slightly below threshold. Options:
Tighten the stop-loss to improve R:R (risky — may get stopped out prematurely)
Extend the target beyond the neckline (requires chart confirmation)
Skip this trade and wait for a setup with better R:R
Market regime check: AI Terminal not STRONG BEAR ✅ (SIDEWAYS)
On-chain not contradicting: Whale activity NEUTRAL ✅
All 5 conditions met → Execute entry at $2.05 with limit order.
Exit Rules
Take-Profit (TP):
TP1: $2.11 (close 50% of position at neckline resistance)
TP2: $2.17 (close remaining 50% at measured move target)
Move stop-loss to breakeven after TP1 is hit
Stop-Loss:
Initial: $2.02 (below Double Bottom support)
After TP1 hit: Move to $2.05 (breakeven)
Trailing stop: 2% trailing after position is in profit >3%
Time-based exit:
If neither TP nor SL is hit within 7 days, reassess the position
Re-run AI Analysis — if ASI has dropped below 50, close the position
Step 6: Performance Review — Backtesting and Iteration
The most overlooked component. Without measuring performance, you can't improve. CoinXSight's Backtest module lets you validate strategies before risking real capital.
Running a Backtest
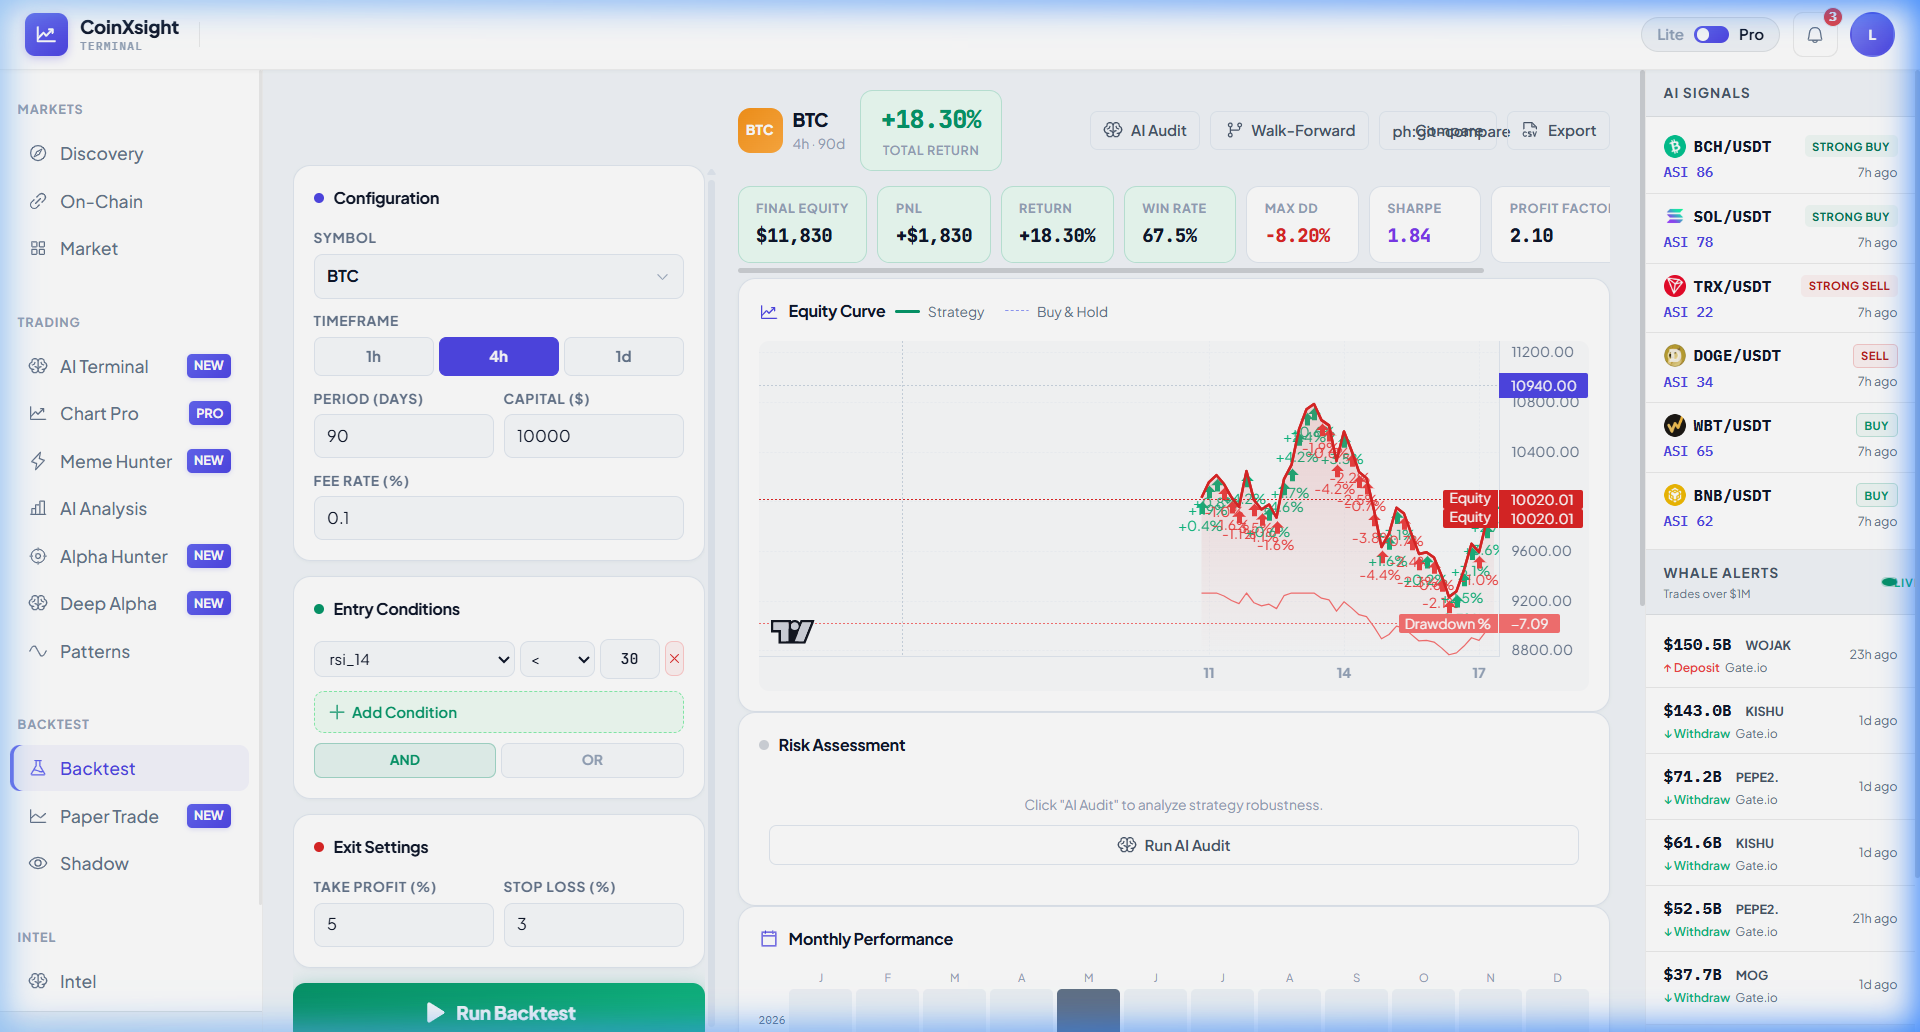
The backtest results reveal critical insights about a simple RSI strategy:
Configuration:
Symbol: BTC, Timeframe: 4H, Period: 90 days
Entry: RSI(14) < 38 (oversold condition)
Exit: Take Profit 5%, Stop Loss 3%
Starting Capital: $10,000, Fee Rate: 0.1%
Results analysis:
+18.30% total return: Strategy generated $1,830 profit on $10,000 capital over 90 days
67.5% win rate: More than 2/3 of trades were profitable
Profit Factor 2.10: Winners were 2.1x larger than losers on average — this is healthy
Max Drawdown -8.20%: The worst peak-to-trough decline was 8.2% — manageable for most traders
Sharpe Ratio 1.84: Above 1.0 is good, above 1.5 is excellent — this strategy has strong risk-adjusted returns
Equity Curve analysis:
The chart shows the strategy (solid line) vs Buy & Hold (dashed line). Note how the strategy captured upside while limiting drawdowns — the equity curve is smoother than simply holding BTC.
Your System Rule: Before trading any strategy with real money, backtest it over at least 90 days. Minimum acceptable metrics:
Win rate ≥55%
Profit factor ≥1.5
Max drawdown ≤15%
Sharpe ratio ≥1.0
If any metric fails, adjust the strategy parameters and re-test. For a detailed backtesting walkthrough, see the Backtest Strategy Guide.
Putting It All Together: The Daily System Checklist
Pre-Market (5 minutes)
[ ] Check AI Terminal → Record market regime and ASI direction
[ ] Calculate position size → Apply 1-2% risk rule
[ ] Confirm R:R ≥1.5
Execution
[ ] Place limit order at AI-recommended entry
[ ] Set stop-loss immediately (no moving it later)
[ ] Set take-profit orders (TP1 at 50%, TP2 at 100%)
[ ] Log the trade: entry reason, ASI score, confidence level
End-of-Day Review (5 minutes)
[ ] Check open positions → Has ASI score changed?
[ ] Move stop-loss to breakeven for positions that hit TP1
[ ] Log any filled orders → Update trade journal
[ ] Weekly: Run backtest on your actual trade parameters
Common System Design Mistakes
Mistake 1: Overcomplicating Entry Rules
Adding too many conditions means you almost never enter. A system that produces zero trades is useless. Keep entry rules to 3-5 conditions maximum.
Mistake 2: No Stop-Loss
"I'll exit when it recovers" is not a system rule. Every trade needs a predetermined stop-loss that executes automatically. Your emotions at the time of loss are unreliable.
Mistake 3: Changing Rules Mid-Trade
If you set TP at $2.11 and price reaches $2.10, don't move TP to $2.20. Changing rules mid-trade introduces emotional decision-making that your system was designed to prevent.
Mistake 4: Never Backtesting
A strategy that "makes sense" logically may not work in practice. Backtesting reveals hidden problems — high drawdowns, low win rates, sensitivity to market regime changes — before you risk real money.
Mistake 5: Ignoring Market Regime
A bullish strategy that works 70% of the time in trending markets may work only 30% in sideways markets. Your system must include regime-dependent rules, as covered in Steps 1-2 above.
Frequently Asked Questions
How long does it take to build a trading system?
The initial system can be built in a few hours using this guide. However, refining and optimizing it through backtesting typically takes 2-4 weeks. The key is to start with a simple system and add complexity only when backtesting proves it improves performance.
Can beginners build a trading system?
Yes — beginners actually benefit the most from systematic trading because it prevents the emotional mistakes that cost new traders the most money. Start with a simple system: AI Terminal regime check → Alpha Hunter signals with ASI 70+ → 1% risk per trade → 2:1 R:R minimum.
How many trades should a system produce per week?
Quality over quantity. A well-filtered system might produce 3-5 high-quality trades per week. If your system produces 20+ signals daily, the filters aren't strict enough. If it produces zero signals for a week, the filters might be too restrictive.
Should I automate my trading system?
Start manual. Automation is beneficial for execution (placing orders, managing stops) but you should understand every component before automating. Automated systems need monitoring — they can malfunction, encounter API issues, or trade during abnormal market conditions.
How do I know if my system is working?
Track these metrics monthly:
Win rate (target: ≥55%)
Average R:R achieved (target: ≥1.5)
Maximum drawdown (target: ≤15% of portfolio)
Monthly return consistency (positive months ≥7 out of 12)
If metrics decline for 2+ consecutive months, pause trading and review the system with fresh backtests.
Summary
A complete trading system transforms crypto trading from gambling into a structured business process. The six components — Market Context, Opportunity Discovery, Signal Validation, Risk Management, Execution Rules, and Performance Review — work together to produce consistent, repeatable results.
CoinXSight's integrated platform provides tools for every component: the AI Terminal for macro assessment, Discovery and Alpha Hunter for opportunity scanning, AI Analysis for multi-layer validation, the On-Chain module for smart money confirmation, and the Backtest module for strategy validation.
The most critical insight: your system doesn't need to be complex to be effective. The demo backtest showed that a simple RSI-based entry with fixed TP/SL produced +18.30% over 90 days with a 67.5% win rate and 2.10 profit factor. Start simple, measure everything, and add complexity only when data proves it helps.
Master risk management for crypto trading. Learn position sizing formulas, stop-loss strategies, and how CoinXSight's Portfolio module tracks your risk…