Fair Value Gaps Explained: How to Trade FVGs Like Institutional Crypto Traders
Master Fair Value Gaps (FVG) for crypto. Learn to identify bullish and bearish FVGs, rebalancing entries, and how CoinXSight detects FVGs automatically.
MC
Marcus ChenSenior Quantitative Strategist·May 16, 2026 · 10 min read · Updated Oct 6
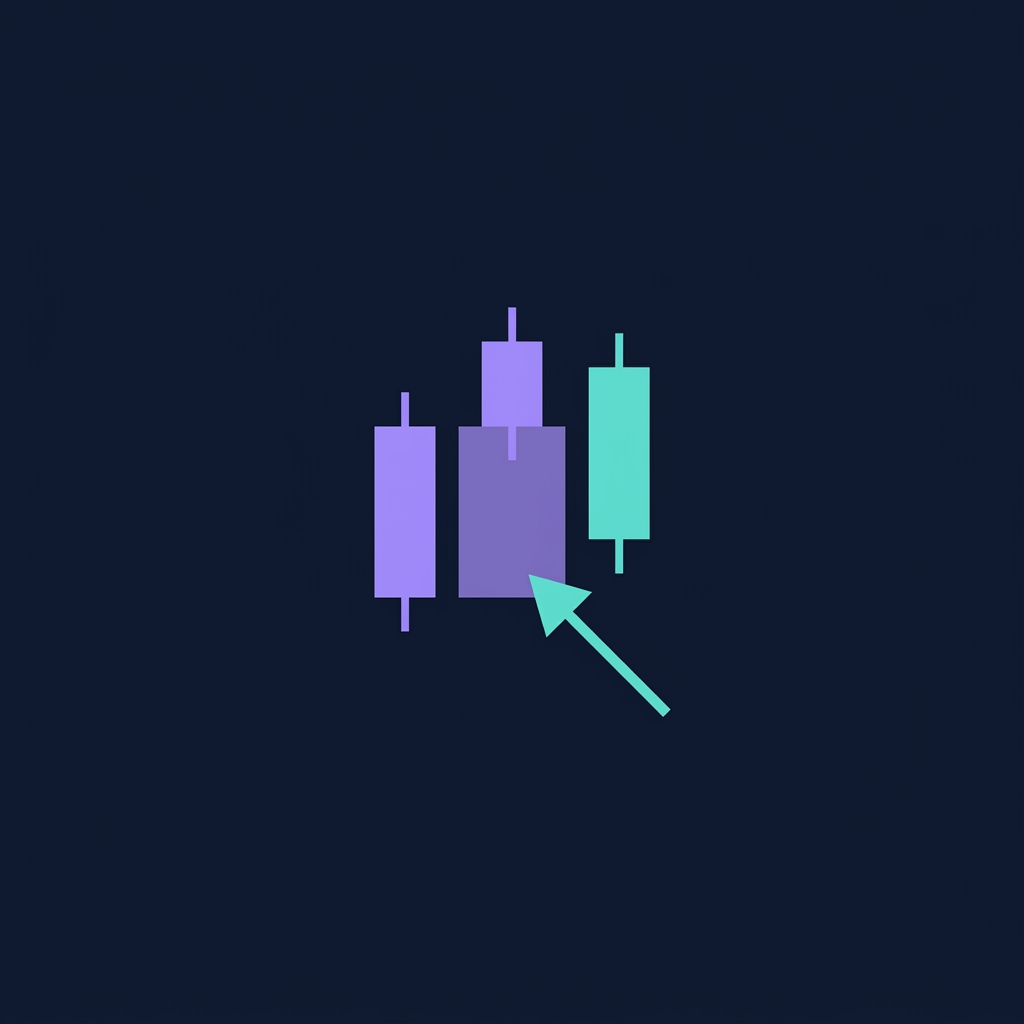
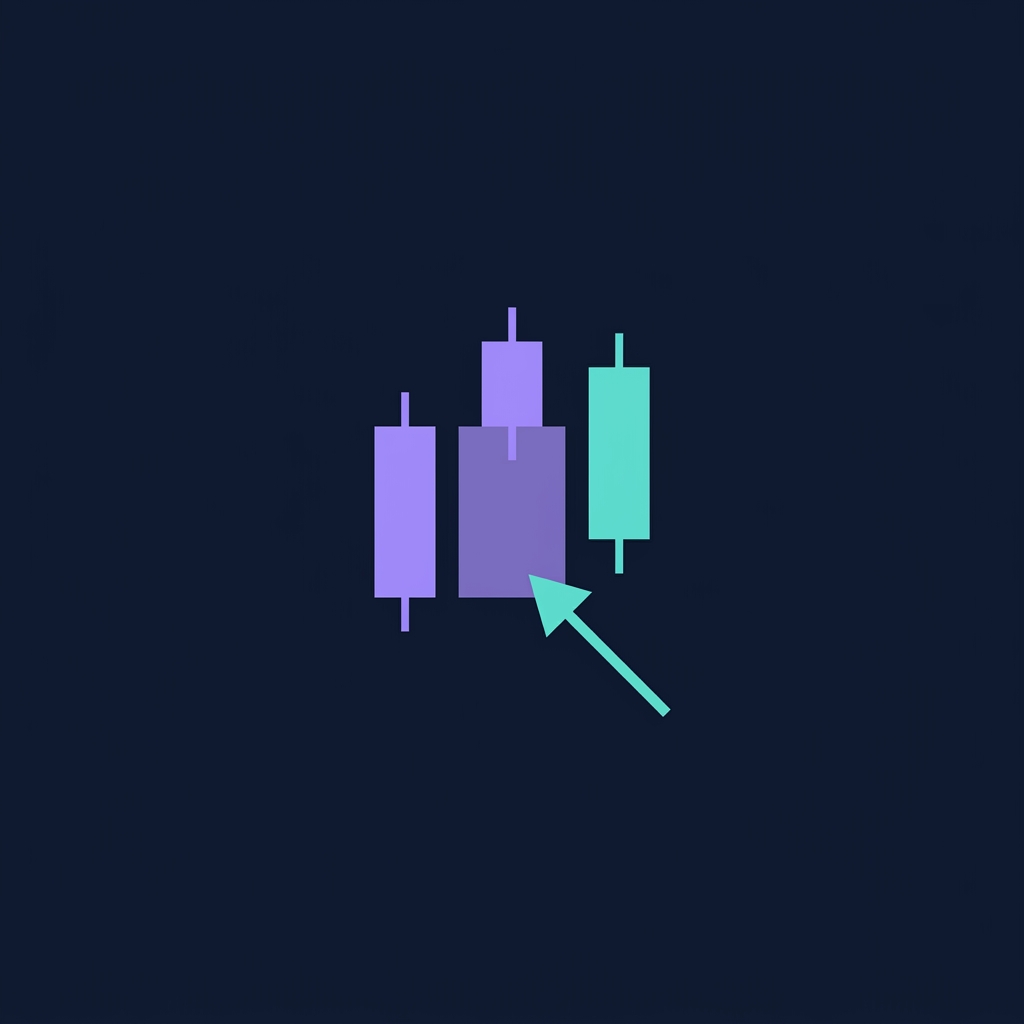
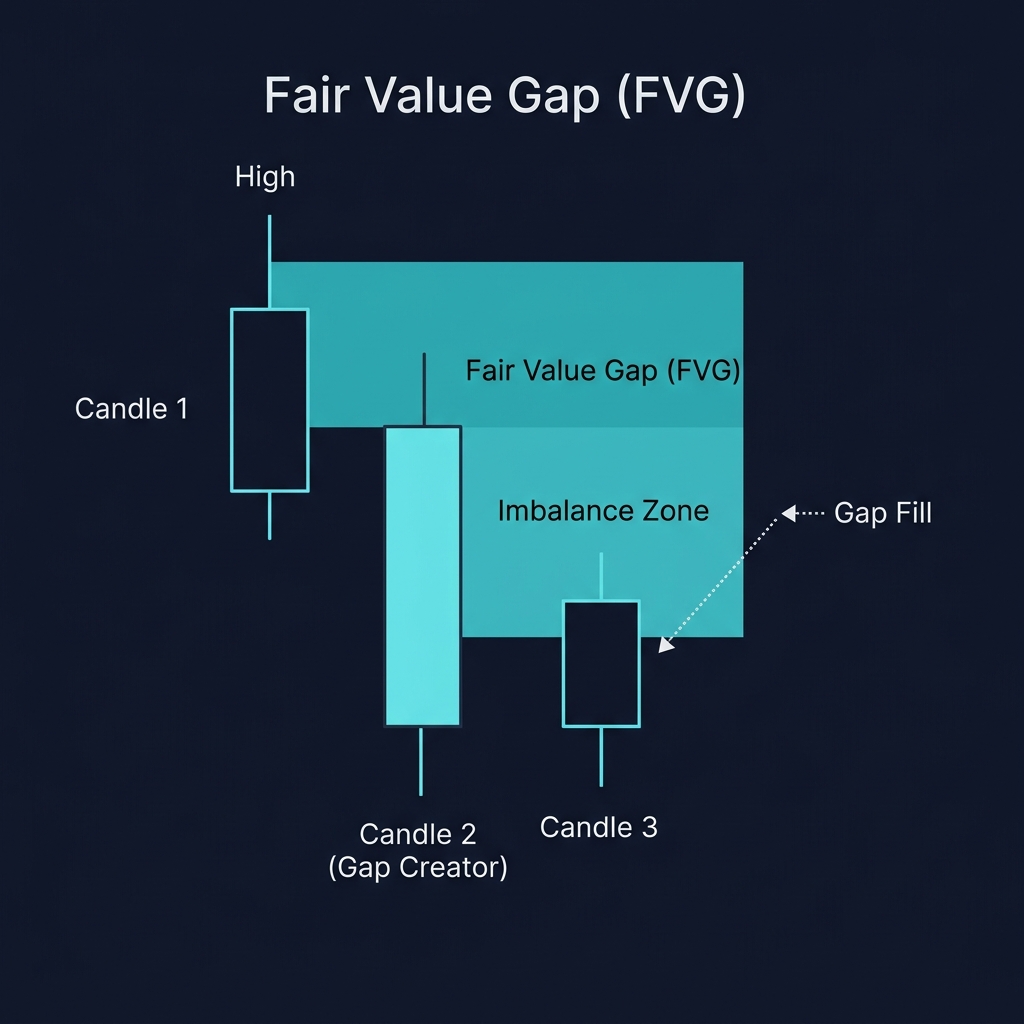
A Fair Value Gap (FVG) is a three-candle price pattern where the middle candle is so impulsive that it creates a gap between the wicks of the first and third candles. This gap represents a zone where one-sided trading occurred — either aggressive buying or selling with no meaningful opposition. Institutional traders view these gaps as areas of "inefficient pricing" that price tends to revisit.
The concept originates from Smart Money Concepts (SMC), the price action framework used to track institutional order flow. FVGs are one of three core SMC components, alongside Order Blocks and Liquidity zones. On CoinXSight, FVGs are detected automatically by the platform's SMC engine and surfaced across multiple modules — Deep Alpha displays them in the SMC panel, Chart Pro draws them as colored zones on the chart, and Discovery uses them in signal triage.
How Fair Value Gaps Form
An FVG forms when a candle is so large that the candles before and after it cannot "cover" the gap with their wicks:
Bullish FVG (gap created by aggressive buying):
Candle 1: High at $100 (this is the bottom of the gap)
Candle 2: Large bullish candle — opens at $99, closes at $110
Candle 3: Low at $107 (this is the top of the gap)

FVG zone = $100 (Candle 1 high) to $107 (Candle 3 low) = $7 gap
Bearish FVG (gap created by aggressive selling):
Candle 1: Low at $200 (this is the top of the gap)
Candle 2: Large bearish candle — opens at $201, closes at $185
Candle 3: High at $190 (this is the bottom of the gap)

FVG zone = $190 (Candle 3 high) to $200 (Candle 1 low) = $10 gap
The key requirement: The wick of Candle 1 and the wick of Candle 3 must NOT overlap. If they overlap, there is no gap — the price action was efficiently filled and no FVG exists.
Why FVGs Matter — The Rebalancing Theory
This is where crypto technical analysis becomes practical — a quality crypto analytics platform will display these signals in real time, helping you act on setups as they form.
Markets tend toward efficiency — areas of one-sided trading attract price back to "rebalance" the unfilled orders. Three forces pull price back to FVGs:
Institutional re-entry: Market makers who missed the initial move may place orders inside the FVG to enter at a better price
Algorithmic targeting: Quantitative funds and trading bots specifically target unfilled FVGs as entry zones
Liquidity magnetism: The gap represents an area with minimal trade history — price naturally gravitates toward zones where orders need to be filled
Fill rate statistics: Research across major crypto pairs shows that approximately 70-80% of FVGs on the 4H and daily timeframes get at least partially filled within 5-15 candles. This gives FVG-based trading a statistical edge when combined with trend confirmation.
FVG Classification on CoinXSight
CoinXSight's SMC engine automatically detects and classifies FVGs:
FVG Type
Visual
Meaning
Trading Implication
Bullish FVG (Unfilled)
Green zone
Gap left by aggressive buying — price may return here
Potential support / buy zone on pullback
Bearish FVG (Unfilled)
Red zone
Gap left by aggressive selling — price may return here
Potential resistance / sell zone on rally
Partially Filled
Fading zone
Price has entered the FVG but not fully filled it
Reduced but still active zone
Fully Filled
Removed
Price has completely rebalanced the zone
No longer active — remove from analysis
3 Advanced FVG Trading Techniques
Technique 1: FVG as Entry Zone (Rebalancing Trade)
The most common FVG strategy: wait for price to return to an unfilled FVG and enter in the direction of the original impulse.
Setup — Bullish FVG entry:
A strong bullish impulse creates a Bullish FVG
Wait for price to pull back into the FVG zone
Confirm with:
Trend direction (EMAs still bullish)
RSI approaching oversold (30-40 range)
Whale flow supporting accumulation
Enter at or inside the FVG zone
Stop-loss below the FVG
Target: the high of the original impulse move, or the next resistance level
Real-world scenario — BTC, April 2026, 4H chart:
On April 10, 2026, BTC rallied from $72,500 to $76,800 in a single 4H candle, creating a Bullish FVG between $73,200 and $74,600. CoinXSight's Deep Alpha flagged the FVG as "Unfilled" in the SMC panel.
Three days later, BTC pulled back to $74,100 — entering the FVG zone. At that moment:
EMA 34/89/200 all stacking bullish
RSI: 41 (healthy pullback, not oversold)
Confluence Score: 7/10 (Trend + SMC aligned)
On-Chain: $6.4M in exchange outflows over the previous 24 hours
BTC bounced from $73,800 (inside the FVG) and rallied to $78,200 over the next 5 days — an 8.4% move from a textbook FVG rebalancing entry.
Technique 2: FVG + Order Block Confluence
The highest-probability SMC setups occur when a Fair Value Gap overlaps with an Order Block. This creates a "double-zone" where both institutional accumulation and price inefficiency converge.
How to identify FVG + OB confluence:
Locate an Order Block (last opposing candle before an impulse)
Check if an FVG exists within or adjacent to the OB zone
When price returns to this overlapping zone, you have maximum institutional interest
Scoring on CoinXSight: When the SMC Layer detects both an OB and FVG at the same price zone, the layer score increases to near-maximum (2.3-2.5/2.5). Combined with trend and momentum alignment, this produces Confluence Scores of 8-9/10.
Technique 3: FVG Invalidation — When to Walk Away
Not every FVG produces a reaction. Understanding invalidation saves you from bad trades:
FVG is invalidated when:
Price closes through the entire FVG zone (full candle body beyond the zone, not just a wick)
The FVG is on a lower timeframe (15m, 1H) while the higher timeframe trend opposes it
The FVG was created with below-average volume (weak impulse = weak gap)
Multiple attempts to fill the FVG have already occurred (each fill attempt weakens the zone)
⚠️ Limitation: FVG trading is probabilistic. Even with 70-80% fill rates, the remaining 20-30% of FVGs never get revisited — price simply continues in the impulse direction without looking back. This is why risk management (stop-loss below the FVG) and confluence (checking the Confluence Score) are mandatory. A 7+/10 Confluence Score significantly filters for FVGs that are more likely to produce a tradeable reaction.
FVG vs. Traditional Gaps — Key Differences
Feature
Fair Value Gap (FVG)
Traditional Gap
Market
Works in 24/7 crypto (no close)
Requires market open/close
Formation
Intrabar wick gap between 3 candles
Opening price ≠ previous close
Frequency
Very common on 4H and daily
Rare in crypto (no overnight close)
Framework
Smart Money Concepts
Technical Analysis
Detection
CoinXSight auto-detects
Manual charting only
Traditional gaps (opening gaps) are rare in crypto because the market never closes. FVGs solve this by identifying intrabar price inefficiencies that exist within continuous trading — making them far more applicable to crypto than traditional gap theory.
Common FVG Mistakes
Trading every FVG: Not all FVGs are equal. FVGs from low-volume impulse candles are weak. FVGs aligned with the trend and overlapping with Order Blocks are strong. Quality over quantity.
Ignoring the timeframe: A 15-minute FVG carries far less weight than a daily FVG. Higher-timeframe FVGs represent larger institutional activity and produce more reliable reactions. Prioritize 4H and daily FVGs.
Entering before the FVG is tested: Some traders anticipate FVG fills by entering above the zone. Wait for price to actually enter the FVG before committing capital. Patience is the edge.
Not checking if the FVG has already been filled: An FVG that was already partially filled on a previous candle has reduced potency. CoinXSight tracks fill status automatically — use it.
How to Use FVGs on CoinXSight — Multi-Module Workflow
The mistake most SMC traders make: they see an FVG zone and immediately treat it as a guaranteed entry. I have watched hundreds of FVGs get bulldozed because the trader ignored the surrounding context. Here is the actual workflow I use to separate tradeable FVGs from noise.
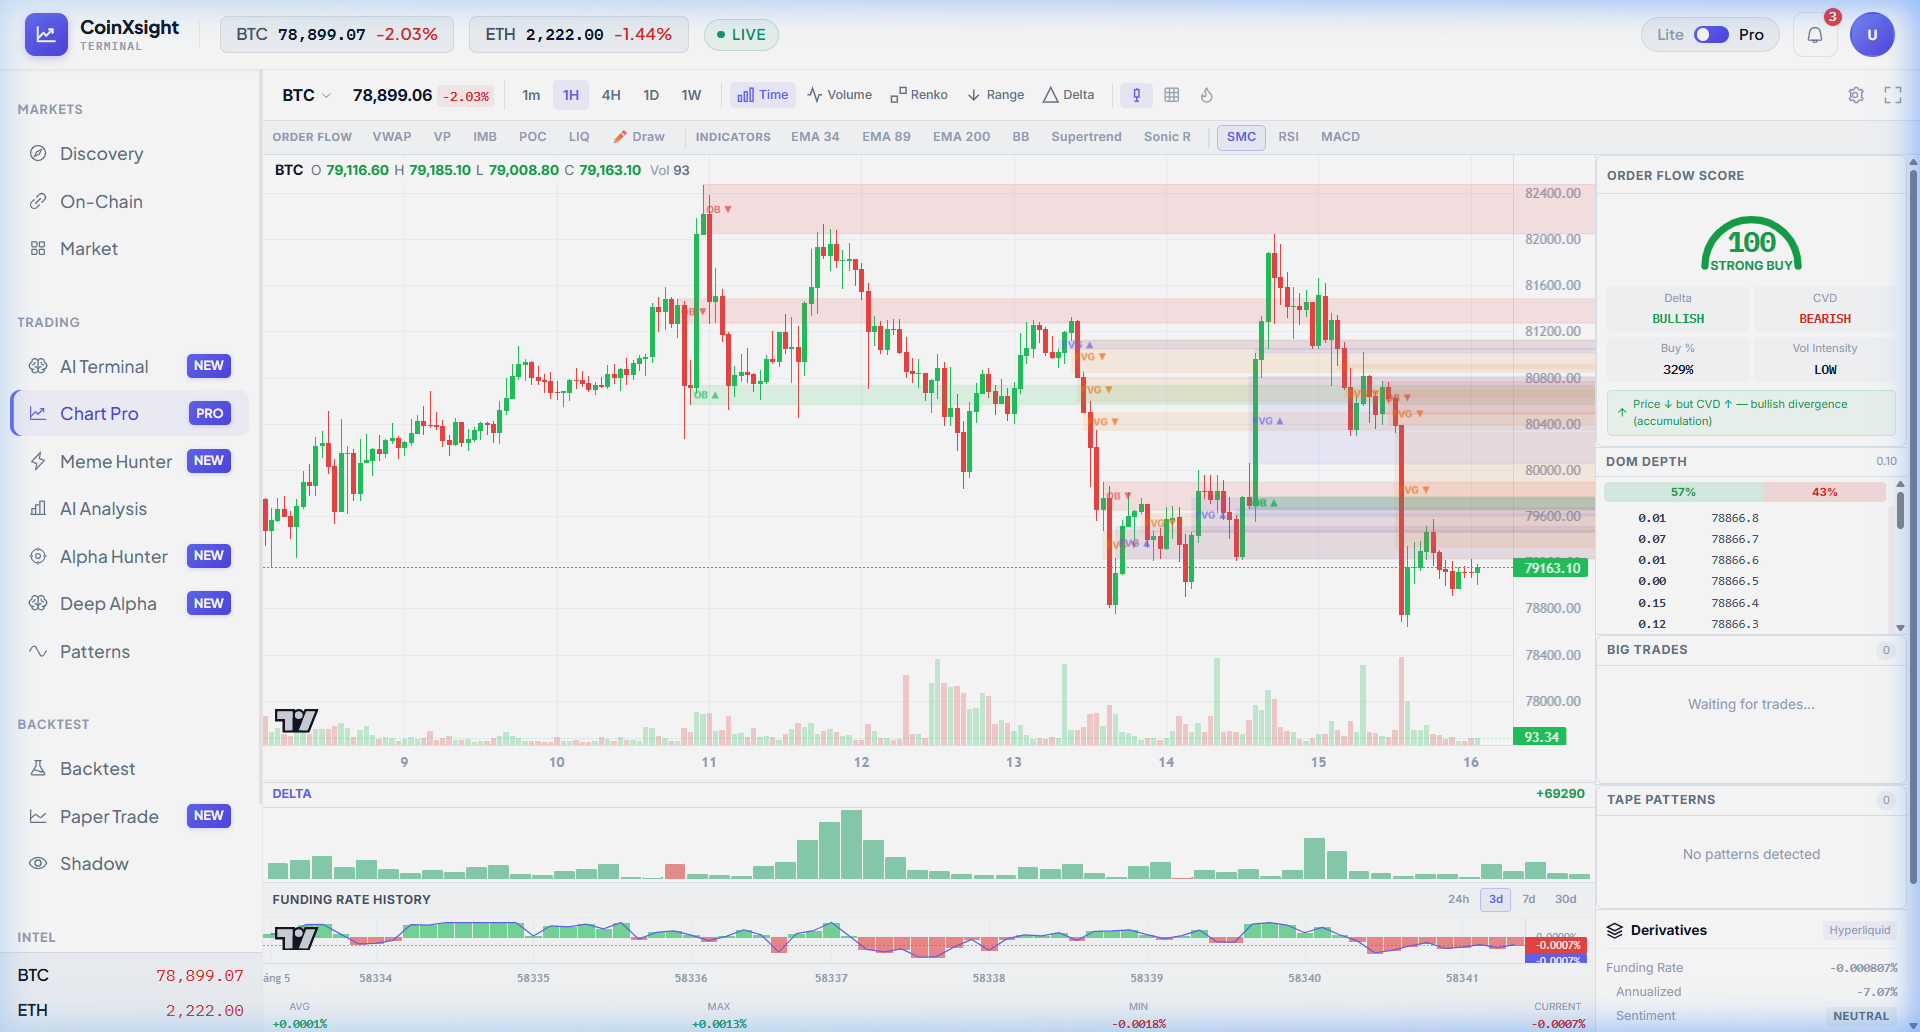
Open Chart Pro → toggle SMC from the indicator toolbar. FVGs appear as colored horizontal bands: green/teal zones are Bullish FVGs (potential support), red/pink zones are Bearish FVGs (potential resistance). In the screenshot below, BTC 1H shows multiple FVG zones:
The green FVG zone around $80,200-$80,800 (labeled "FVG ▲") was created by the bullish impulse on May 14. Price pulled back into this zone and bounced — that is a successful rebalancing trade.
The red FVG zone above $82,000 (labeled "OB ▼") combines a Bearish Order Block with an overlapping FVG. Price hit this zone and reversed hard — exactly what SMC theory predicts when an OB and FVG converge at the same level.
The key detail I focus on: how many times has the FVG been tested? That green zone around $80,400 has been touched 3 times. Each touch absorbs pending orders — by the 3rd or 4th test, the zone is largely exhausted. Fresh, untested FVGs have the highest reaction probability.
Step 2: Check if the FVG aligns with the broader setup on Deep Alpha
An FVG zone is a potential trade location, not a signal. Navigate to Deep Alpha → search BTC. The header shows Market Regime: MIXED and Confluence: PARTIAL. That means the FVG does not have full multi-factor backing yet. If the Confluence read STRONG and the Trend was BULLISH, I would size up on the bullish FVG entries. With PARTIAL confluence, I cut position size in half. The auto-generated Entry ($80,021) and TP1 ($76,886) also tell me the platform's SMC engine expects further downside — so those bullish FVG zones above $80,000 may not hold.
Step 3: Verify whale positioning near the FVG zone on On-Chain
The single best filter for FVG quality: is smart money accumulating or distributing near the FVG? Navigate to On-Chain. Exchange Inflow is +$32.8M — tokens flowing INTO exchanges, a bearish signal. The Whale Transactions table shows GALA and SIDUS buys, but no significant BTC accumulation. This tells me whales are not defending the bullish FVG zones — increasing the risk that they break. Combine this with the PARTIAL confluence reading, and I would avoid longs on the existing FVG zones and instead watch for a new, lower FVG to form as a fresh entry opportunity.
If the FVG is not ready for entry yet, set a price alert. Navigate to Discovery → find the token → click Alert. The Discovery triage feed will notify you when price re-enters the FVG zone and the signal conditions change. This prevents screen-watching — the platform does the monitoring.
Frequently Asked Questions
How often do Fair Value Gaps get filled in crypto?
On 4H and daily timeframes, approximately 70-80% of FVGs get at least partially filled within 5-15 candles. Smaller timeframe FVGs have higher fill rates but less reliable reactions. The fill rate alone does not make FVGs profitable — entry timing, trend alignment, and risk management determine outcomes.
What is the difference between a Fair Value Gap and an Order Block?
An Order Block is the last opposing candle before an impulse — it marks where institutions placed orders. A Fair Value Gap is the gap left by the impulse itself — it marks where price moved too fast for balanced trading. They serve complementary roles: OBs identify the entry zone, FVGs identify the inefficiency zone. When they overlap, the setup is at its strongest.
Should I only trade unfilled FVGs?
Unfilled FVGs have the most potential because no orders have been matched in that zone yet. Partially filled FVGs can still produce reactions, but each fill attempt absorbs some of the pending orders. Fully filled FVGs should be removed from your analysis — they have been rebalanced.
Which timeframe is best for FVG trading?
4H and daily produce the most reliable FVGs because they represent larger institutional activity. 1H can be used for fine-tuning entries within a daily FVG zone. Below 1H, FVGs are too frequent and too small to be consistently tradeable. CoinXSight's Deep Alpha module detects FVGs on the most relevant timeframes automatically.
Can Fair Value Gaps predict Bitcoin price targets?
FVGs identify zones where price is likely to return, not future price targets. A Bullish FVG at $74,000-$75,000 means that zone may act as support if price pulls back. The eventual price target depends on the next resistance level, momentum, and macro conditions — not the FVG itself.