Multi-Timeframe Analysis: How to Align Charts for Higher-Probability Crypto Trades
Learn multi-timeframe analysis for crypto trading. Use daily, 4H, and 1H charts together to find trend-aligned entries with CoinXSight's Confluence system.
MC
Marcus ChenSenior Quantitative Strategist·May 16, 2026 · 9 min read · Updated Oct 6
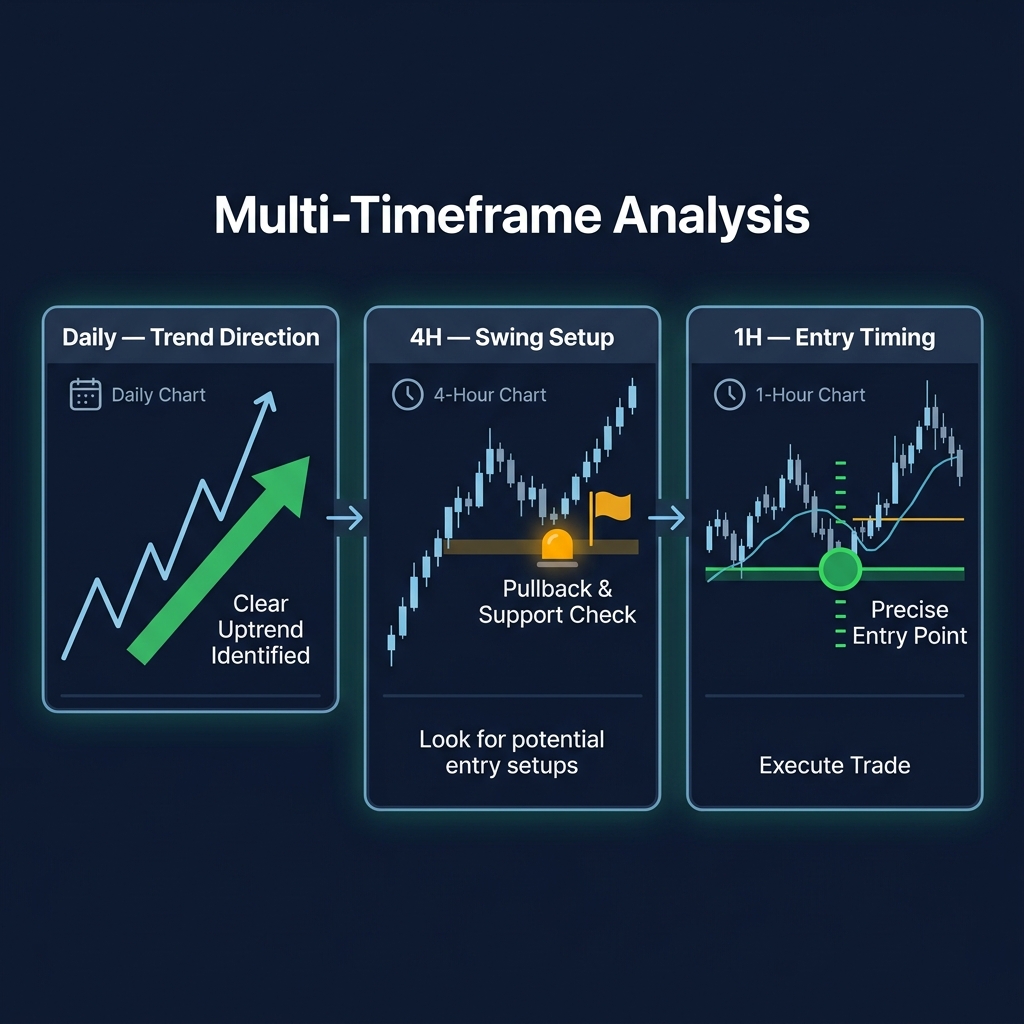
Multi-Timeframe Analysis (MTA) is the practice of examining the same asset across multiple chart timeframes — typically a higher timeframe for trend direction and a lower timeframe for entry timing. The principle is simple: trade in the direction of the higher timeframe, enter on the lower timeframe. This alignment dramatically increases win rates by ensuring you are never fighting the dominant trend.
Why single-timeframe trading fails: A trader looking only at a 1H chart might see a bullish setup — RSI recovering, MACD crossing bullish, price at support. But if the daily chart shows a confirmed downtrend with price below all EMAs, that "bullish setup" is just a countertrend bounce likely to fail. MTA prevents this blind spot.
💡 On CoinXSight, multi-timeframe data is integrated across the platform's modules. Deep Alpha evaluates indicators across multiple timeframes to generate the Confluence Score. Chart Pro lets you switch between timeframes while preserving drawn levels and SMC zones. The platform's analysis engine computes EMAs, RSI, MACD, and SMC data across all relevant timeframes simultaneously.
The 3-Timeframe Framework
The most effective MTA approach uses three timeframes, each serving a distinct role:
Role
Timeframe
Purpose
What to Look For
Macro Trend
Daily or Weekly
Defines the overall direction — your trading bias
EMA alignment, market structure (BOS/CHoCH), Supertrend
Setup
4H
Identifies the trade setup — where price is within the trend
Order Blocks, Fair Value Gaps, RSI zones, Bollinger Bands
The ratio rule: Each timeframe should be 3-6x the one below it. Daily → 4H (6x) → 1H (4x) works well. Using daily → 15M (96x) creates too much disconnection between the trend view and the entry view.
The 5-Step MTA Process
Modern crypto analytics platforms integrate these signals with additional data layers — combining trading indicators, on-chain metrics, and AI analysis for higher-probability entries.
Step 1: Establish Bias on the Higher Timeframe
Open the daily chart and determine the macro trend:
Daily Chart Shows
Bias
Action
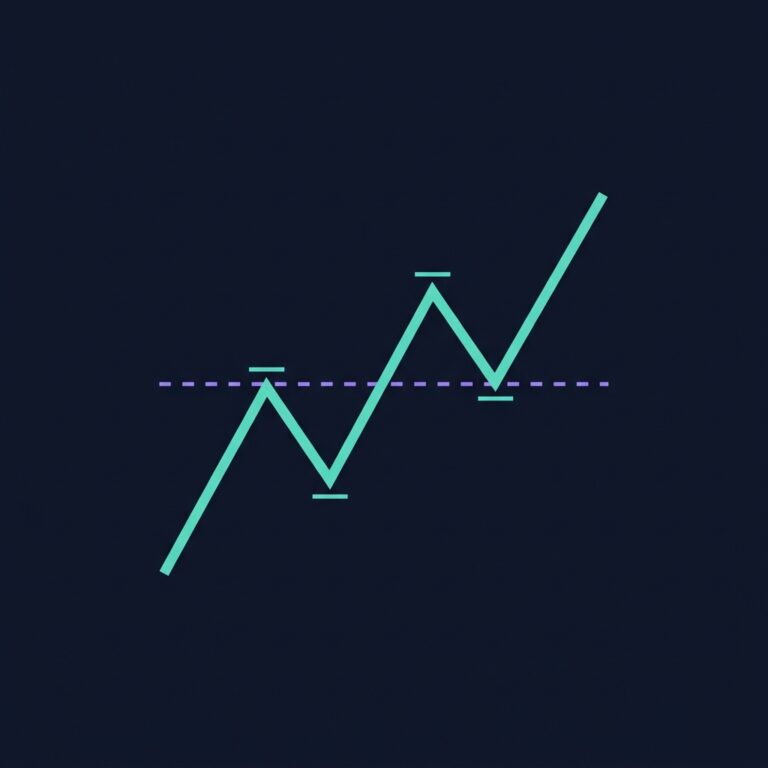
Price > EMA 89, Higher Highs/Lows
Bullish
Only look for long entries on 4H
Price < EMA 89, Lower Highs/Lows
Bearish
Only look for short entries or stay flat
Price crossing EMAs, no clear structure
Neutral
Wait — no edge in either direction
CoinXSight shortcut: Deep Alpha's Trend Layer score gives you the daily bias instantly. A Trend score above 2.0/2.5 = bullish bias. Below 1.0 = bearish bias.
Step 2: Find the Setup on the Middle Timeframe
Switch to the 4H chart. With your daily bias established, look for:
In a bullish daily trend:
Price pulling back to EMA 34 or EMA 89 on 4H → dynamic support
Price entering a Bullish Order Block or FVG
RSI approaching 30-40 → oversold on the 4H while daily trend is up
Bollinger Band lower touch in the direction of the daily trend
In a bearish daily trend:
Price rallying into EMA 34 or EMA 89 on 4H → dynamic resistance
Price entering a Bearish Order Block or FVG
RSI approaching 65-70 → overbought on 4H while daily trend is down
Step 3: Time the Entry on the Lower Timeframe
Once the 4H setup is active, switch to 1H for precision entry:
Wait for a bullish reversal candle (engulfing, hammer, or pin bar) at the 4H level
Confirm with a 1H BOS in the direction of the daily trend
Enter on the close of the confirmation candle
Step 4: Set Risk Management Based on the Setup Timeframe
Stop-loss: Below the 4H setup level (Order Block low, EMA, or FVG bottom)
Target: The 4H swing high (for longs) or the next 4H resistance level
Position size: Calculate based on 1-2% account risk per trade
Step 5: Manage the Trade on the Setup Timeframe
Monitor the trade on the 4H chart — do not manage a swing trade on the 1H chart, as intrabar noise will shake you out. Move stop-loss to breakeven after price achieves 1R of profit.
Real-World Scenario: SOL Multi-Timeframe Entry on CoinXSight
CoinXSight's crypto analytics platform streamlines this workflow with AI-powered tools and real-time data:
Scenario — SOL, April 2026:
Daily chart (Macro Trend):
SOL in a confirmed uptrend: HH at $198, HL at $168
Price above EMA 34 ($182), 89 ($175), and 200 ($158) — all stacking bullish
Market structure: No CHoCH — uptrend intact
Deep Alpha Trend Layer: 2.5/2.5
4H chart (Setup):
SOL pulled back from $195 to $178 — testing EMA 89 on the 4H
RSI: 35 (approaching oversold on 4H, while daily RSI is 52)
A Bullish Order Block at $176-$178 (unmitigated) — right where price landed
Bullish FVG at $177-$180 — overlapping with the OB
Confluence Score: 8/10
1H chart (Entry):
On April 14 at 14:00 UTC, SOL printed a bullish engulfing candle at $177.50
This candle broke above the 1H lower high at $179 → micro Bullish BOS
Volume: 2.1x average on the engulfing candle
The trade:
Entry: $179 (1H BOS confirmation)
Stop-loss: $175 (below the 4H Order Block)
Target: $195 (previous 4H swing high)
Risk: $4 per SOL | Reward: $16 per SOL | R:R = 1:4
Result: SOL rallied from $179 to $201 over the next 6 days. The multi-timeframe alignment — daily trend bullish, 4H setup at OB + FVG, 1H entry confirmation — produced a textbook winning trade.
⚠️ Limitation: Multi-timeframe alignment does not guarantee outcomes. Even with perfect MTA, 25-35% of trades will still hit stop-loss. The edge is probabilistic — consistent MTA application over many trades produces positive expectancy, not individual certainty. Always risk 1-2% per trade maximum.
MTA + Confluence Score — The CoinXSight Edge
CoinXSight's Confluence Score is inherently multi-timeframe. Each layer draws data from the most relevant timeframe:
Confluence Layer
Timeframe Source
What It Captures
Trend Layer
Daily + 4H
EMA alignment and Supertrend across timeframes
SMC Layer
4H primary, daily for context
Order Blocks and FVGs on the setup timeframe
Momentum Layer
4H primary
RSI, MACD, StochRSI at the setup level
Volume Layer
4H primary
Volume ratio and Bollinger Band position
A Confluence Score of 8+/10 inherently means multiple timeframes and analytical dimensions agree — making it a built-in MTA system.
Common Multi-Timeframe Mistakes
Trading against the higher timeframe: Buying on a 1H bullish signal while the daily trend is bearish. The higher timeframe almost always wins. If daily is bearish, even the best 1H setup has reduced odds.
Analysis paralysis from too many timeframes: Checking weekly, daily, 4H, 1H, and 15M creates conflicting signals and indecision. Stick to 3 timeframes — more is noise.
Managing a swing trade on the entry timeframe: If you entered on the 1H chart based on a 4H setup, manage the trade on the 4H chart. The 1H chart will show scary pullbacks that are normal within the 4H structure.
Switching bias mid-trade based on lower timeframe noise: Once you have a daily bias and a 4H setup, do not let a 1H bearish candle change your thesis. The 1H is for entry timing only.
How to Use Multi-Timeframe Analysis on CoinXSight — Multi-Module Workflow
The #1 MTA mistake I see: traders do the analysis across 3 timeframes, get a beautiful setup, then manage the trade on the wrong timeframe and get shaken out. Here is the exact workflow that keeps each timeframe in its lane.
Step 1: Establish macro bias using Deep Alpha timeframe toggles
Open Deep Alpha → search BTC → notice the 1H / 4H / 1D timeframe buttons above the chart. Click 1D first. The header immediately shows the macro picture: Trend: BEARISH, MTF Alignment: MOSTLY_BEARISH, Market Regime: MIXED. That MTF Alignment label is the single most important data point — it tells you whether timeframes agree. MOSTLY_BEARISH means the 1D and 4H are both bearish. Your macro bias is clear: short-biased until this label shifts to NEUTRAL or MOSTLY_BULLISH.
Now switch to 4H on Deep Alpha. The chart updates to show EMA 34/89/200 on the 4H — price is testing the EMA 200 from below, with EMA 34 below EMA 89, both below EMA 200. That is a bearish stack on the setup timeframe, consistent with the daily bias. The Confluence reads PARTIAL — not full conviction yet, which means I wait for a clearer setup.
Step 2: Find the entry timeframe setup on Chart Pro
Switch to Chart Pro → set 1H timeframe (the entry timeframe). With the 4H/1D bias established as bearish, I am only looking for short setups on the 1H. In the screenshot below, BTC 1H shows the Dragon Zone indicator active, with price rallying toward the EMA 89 zone around $80,200. That EMA 89 confluence with the Dragon Zone creates a potential short entry: if price gets rejected from this zone with a bearish reversal candle, the 1H entry aligns with the 4H/1D bearish bias.
The Entry label ($80,021), SL ($81,589), and TP1 ($76,886) from Deep Alpha give me the trade parameters: risk ~$1,500 per BTC for a potential reward of ~$3,100 → R:R of 1:2. This is an acceptable risk-reward for a trade aligned across all three timeframes.
The final filter: does the money flow agree with the multi-timeframe technical picture? Navigate to On-Chain. Exchange Inflow is +$32.8M — capital flowing INTO exchanges. This is consistent with the bearish multi-timeframe alignment: on-chain flow is bearish (distribution), 1D structure is bearish, 4H EMA stack is bearish, 1H is approaching resistance. All three dimensions — timeframe structure, indicator confluence, and on-chain flow — agree. That triple confirmation is what I look for before sizing up a position.
Frequently Asked Questions
What timeframes should I use for crypto swing trading?
Daily for trend direction, 4H for setup identification, and 1H for entry timing. This 3-timeframe approach balances signal quality (daily) with entry precision (1H). For day trading, shift one level down: 4H for trend, 1H for setup, 15M for entry.
Can I use multi-timeframe analysis with CoinXSight's Confluence Score?
The Confluence Score already incorporates multi-timeframe data — its Trend Layer uses daily + 4H EMA alignment, and its SMC Layer evaluates 4H Order Blocks and FVGs. A high Confluence Score (7+/10) inherently means multiple timeframes and dimensions agree.
What if the daily trend is neutral (ranging)?
When the daily chart shows no clear trend (EMAs flat and tangled, no BOS in either direction), either wait for a breakout or trade range strategies on the 4H chart — buying at range support, selling at range resistance. Reduce position sizes during ranging conditions.
How long should I hold a multi-timeframe trade?
Your holding period should match the setup timeframe. A 4H setup typically plays out over 2-7 days. A daily setup may take 1-3 weeks. Do not expect a 4H setup to produce a monthly move — that requires a daily or weekly setup.
Does multi-timeframe analysis work for meme coins?
MTA works for any traded asset with sufficient liquidity. Meme coins with daily volume above $10M follow structure and trend patterns. For very low-cap meme coins, use CoinXSight's Meme Hunter module instead — it is purpose-built for the meme sector with safety scoring and smart money tracking.