Risk Management & Position Sizing: The Only System That Keeps You in the Game
Master crypto risk management with the 1% rule, Kelly Criterion, R-multiple tracking, portfolio heat limits, and dynamic position sizing. The complete survival guide for serious traders.
MC
Marcus ChenSenior Quantitative Strategist·May 24, 2026 · 16 min read · Updated Oct 6
Most traders obsess over entries. They spend hours analyzing charts, waiting for the perfect setup. Then they risk 20% of their account on a single trade, get stopped out twice, and they've lost 40% before the week ends.
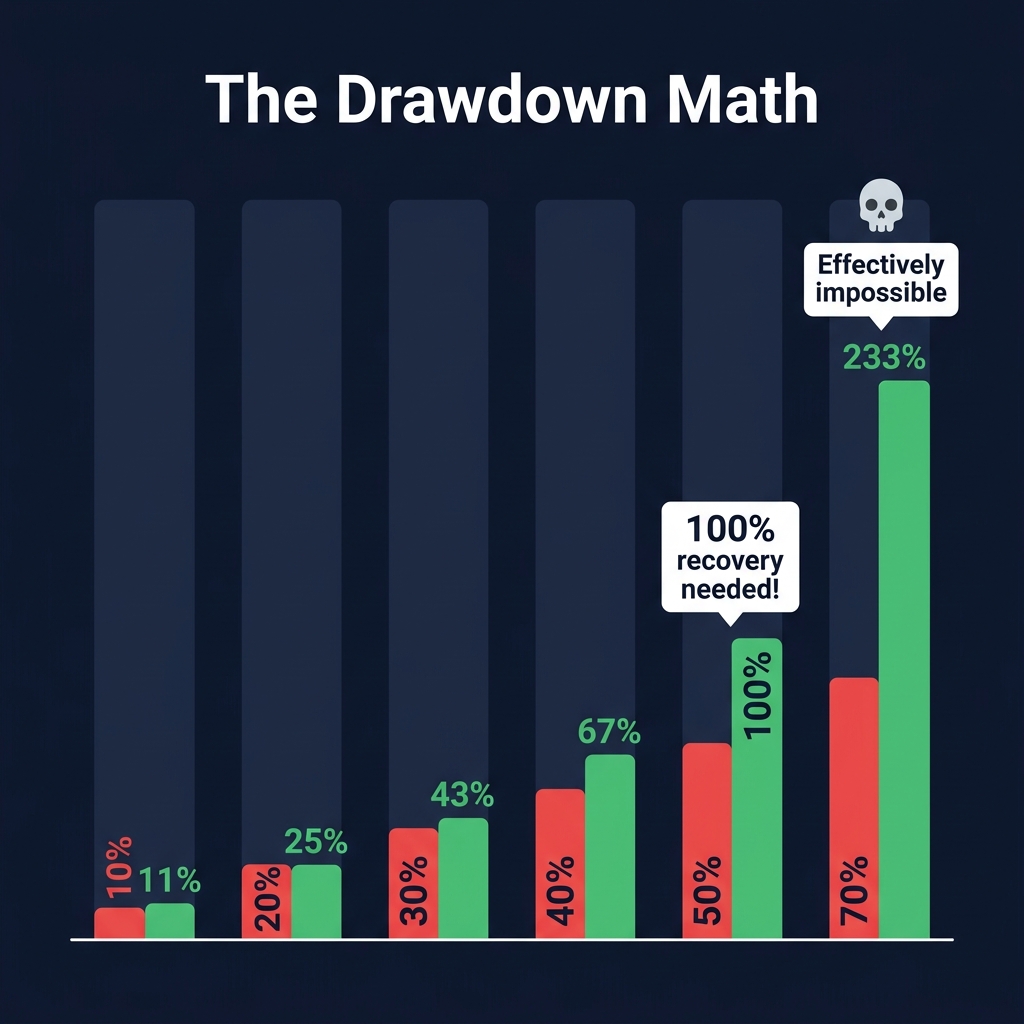
Here's the brutal math of drawdowns:
Drawdown
Recovery Needed
Trades to Recover (2% avg win)
10%
11.1%
~6 trades
20%
25.0%
~13 trades
30%
42.9%
~22 trades
40%
66.7%
~34 trades
50%
100.0%
~50 trades
70%
233.3%
Effectively impossible
A 50% drawdown requires a 100% return just to break even. That's why risk management isn't a "nice to have" — it's literally the difference between survival and blowing up your account.
The 1% Rule: Your Non-Negotiable Foundation
Never risk more than 1% of your total account on a single trade.
This is the most important sentence in this entire article. If you follow nothing else, follow this.
How the 1% Rule Works
Account size: $10,000
Max risk per trade: $10,000 × 1% = $100

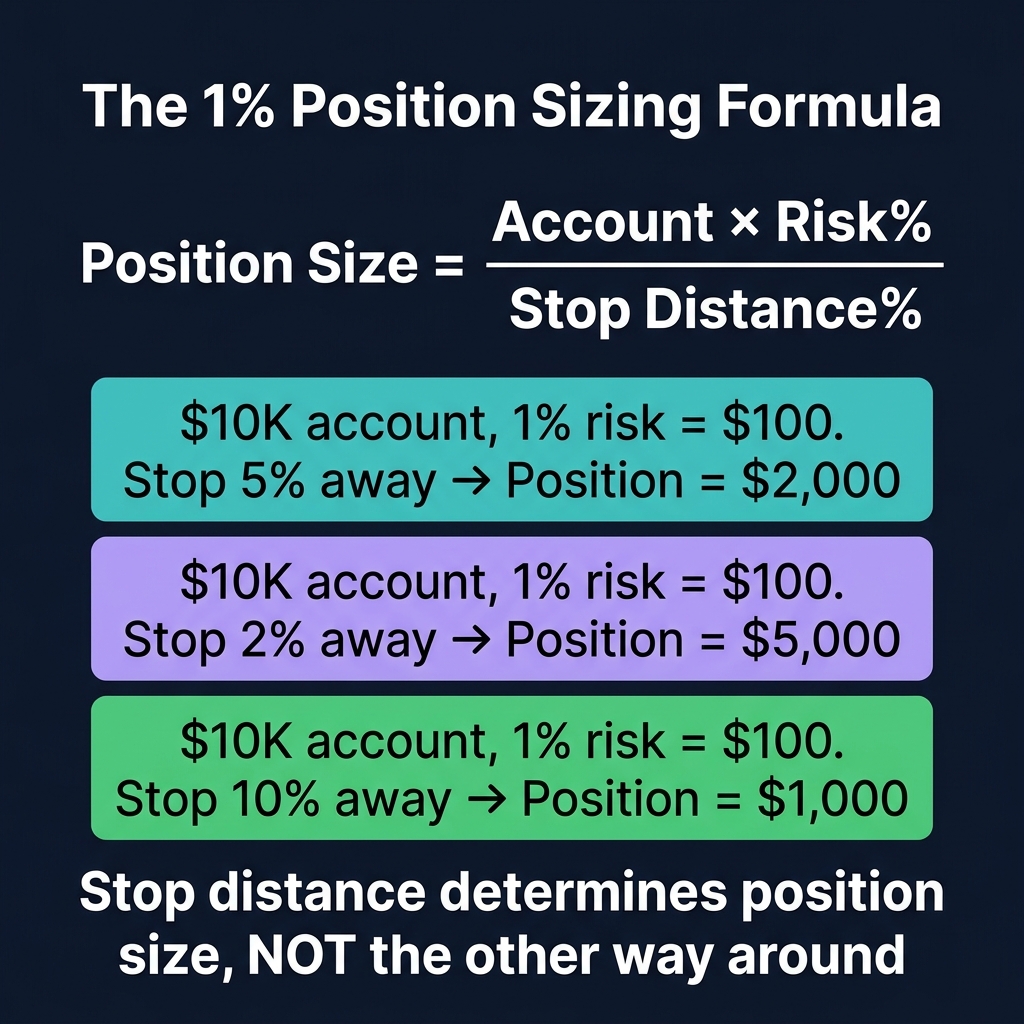
If your stop loss is 5% away from entry:
Position size = $100 / 5% = $2,000

If your stop loss is 2% away from entry:
Position size = $100 / 2% = $5,000

If your stop loss is 10% away from entry:
Position size = $100 / 10% = $1,000
Notice: the stop loss distance determines position size, NOT the other way around. You never set position size first and then figure out where to put the stop. That's backwards.
The Position Sizing Formula
Position Size = (Account × Risk%) / Stop Distance%

Where:
- Account = Total account value
- Risk% = Max risk per trade (1% for standard, 0.5% for conservative)
- Stop Distance% = Distance from entry to stop loss as percentage
Scaling Risk by Confidence
Not all trades are equal. A 3/3 timeframe-aligned setup with ASI Score confirmation deserves more risk than a speculative scalp.
Setup Quality
Risk %
Example ($10K account)
A+ Setup (3/3 aligned, ASI HIGH, on-chain confirms)
1.5-2.0%
$150-$200 risk
A Setup (2/3 aligned, good confluence)
1.0%
$100 risk
B Setup (decent but missing confirmation)
0.5%
$50 risk
C Setup (speculative, low confluence)
0.25%
$25 risk
No setup (FOMO, revenge trade)
0%
$0 — don't trade
The R-Multiple System
What Is an R-Multiple?
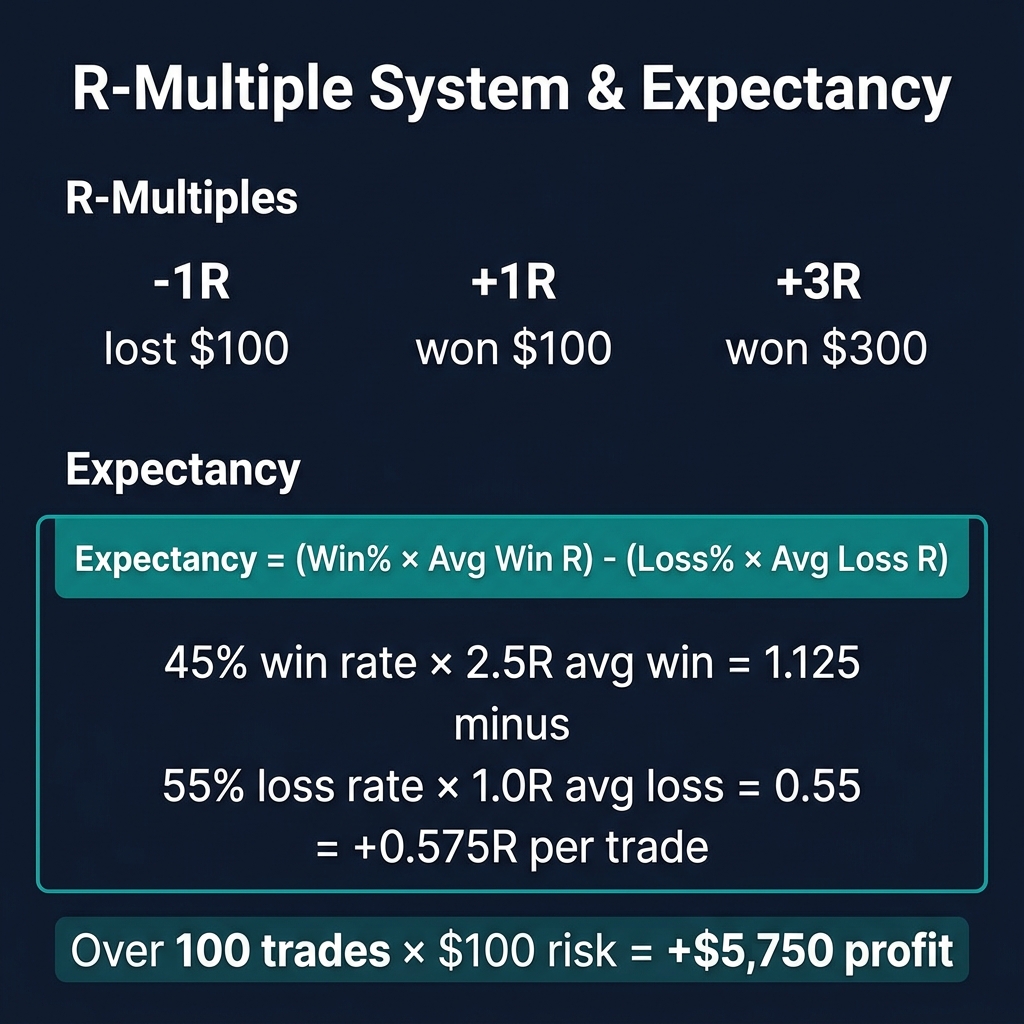
R = the amount you risk on a trade. Every trade outcome is measured in multiples of R.
You risk $100 on a trade (1R = $100)

Win $300 → +3R
Win $100 → +1R
Lose $100 → -1R
Lose $50 (moved stop to breakeven, partial loss) → -0.5R
Why R-Multiples Matter
R-multiples let you evaluate your system independent of position size.
Metric
What It Tells You
Average R
How much you make per unit of risk (expectancy)
Win Rate
What percentage of trades are profitable
Largest R
Your best trade in risk-adjusted terms
Largest -R
Your worst trade (should never exceed -1R)
The Expectancy Formula
Expectancy = (Win Rate × Average Win R) - (Loss Rate × Average Loss R)

Example:
Win Rate: 45%
Average Win: +2.5R
Loss Rate: 55%
Average Loss: -1R

Expectancy = (0.45 × 2.5) - (0.55 × 1.0) = 1.125 - 0.55 = +0.575R

→ For every $1 risked, you make $0.575 on average
→ Over 100 trades risking $100 each: +$5,750 profit
Any system with positive expectancy makes money over time. You don't need a high win rate. A 35% win rate with +4R average wins is extremely profitable.
The Kelly Criterion: Optimal Sizing
What Is Kelly?
The Kelly Criterion calculates the mathematically optimal percentage of your bankroll to bet, given your edge.
Kelly % = (Win Rate × Average Win/Loss Ratio - Loss Rate) / (Average Win/Loss Ratio)

Example:
Win Rate: 50%
Average Win: $200
Average Loss: $100
Win/Loss Ratio: 2.0

Kelly % = (0.50 × 2.0 - 0.50) / 2.0 = (1.0 - 0.50) / 2.0 = 25%
Why You Should NEVER Use Full Kelly
Full Kelly maximizes long-term growth but creates enormous volatility. A 25% Kelly means risking 25% per trade — one bad streak and you're down 70%.
In practice, use Quarter-Kelly or Half-Kelly:
Approach
Formula
Volatility
Drawdown Risk
Full Kelly
K
Maximum growth but extreme drawdowns
Very high
Half Kelly
K / 2
75% of max growth, much smoother equity curve
Moderate
Quarter Kelly
K / 4
50% of max growth, very stable
Low
For crypto (which has fat-tail events and black swans), Quarter Kelly is the standard. This typically produces risk percentages between 0.5% and 2% per trade — which aligns perfectly with the 1% rule.
Portfolio Heat: Total Risk Exposure
What Is Portfolio Heat?
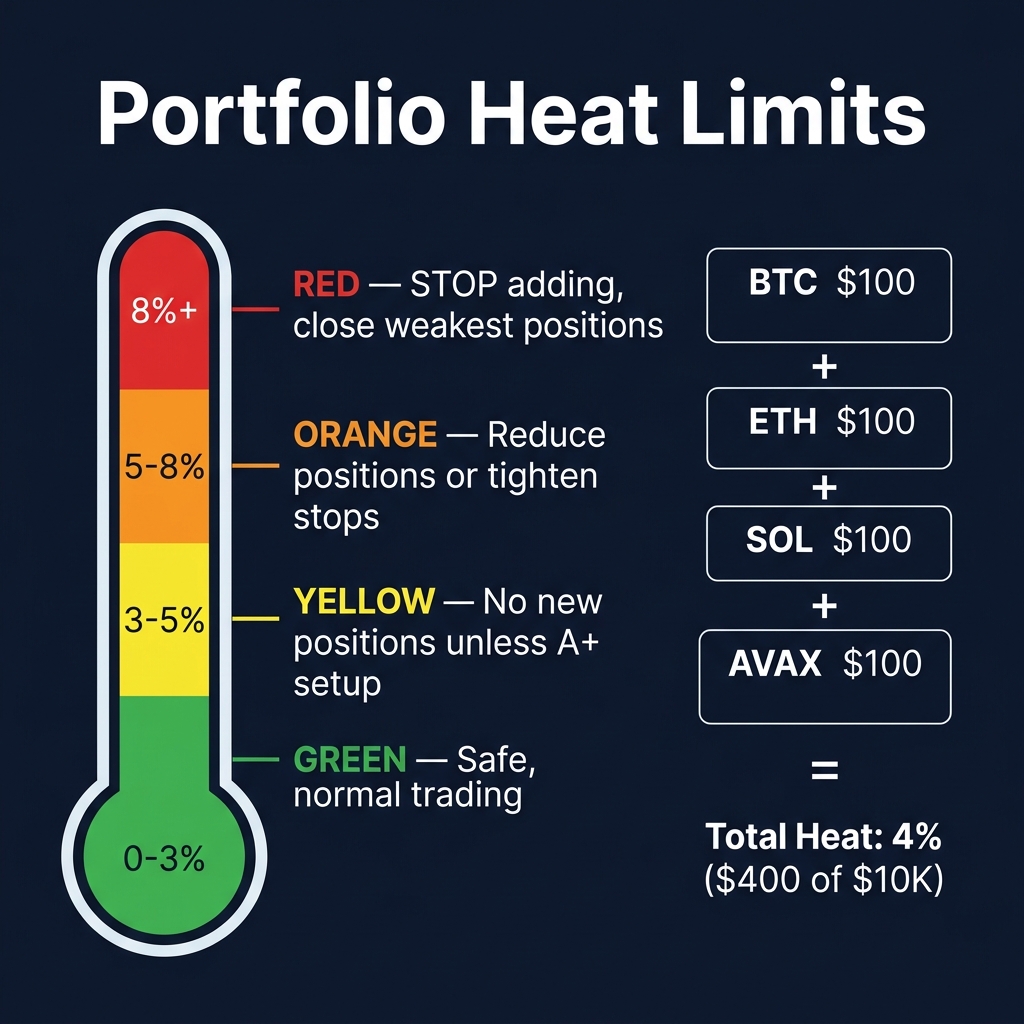
Portfolio heat = the total risk across ALL open positions combined.
Trade 1: Long BTC, risking $100 (1R)
Trade 2: Long ETH, risking $100 (1R)
Trade 3: Long SOL, risking $100 (1R)
Trade 4: Long AVAX, risking $100 (1R)

Portfolio Heat = $400 (4R)
→ 4% of a $10,000 account
Heat Limits
Portfolio Heat
Status
Action
0-3%
Green — safe
Normal trading
3-5%
Yellow — elevated
No new positions unless A+ setup
5-8%
Orange — high
Reduce positions or tighten stops
8%+
Red — dangerous
STOP adding. Consider closing weakest positions
Correlation Adjustment
If your 4 trades are all crypto longs, they're highly correlated. When BTC drops, ETH, SOL, and AVAX drop together. Your real risk is much higher than 4%.
Never place stops at round numbers — $50,000, $3,000, $100. Everyone puts stops there. Market makers hunt them.
Place stops beyond structure — If support is at $68,500, your stop should be at $68,200 (beyond the support, not at it).
Never widen your stop after entry — If you feel the need to widen, you sized the trade wrong.
Trailing stops for winners — Once a trade is +2R, move stop to breakeven. At +3R, trail the stop.
The Break-Even Trap
Moving to breakeven too early is the #1 mistake. The market will wick to your entry, stop you out, then continue in your direction.
Rule: Move to breakeven only after price has moved at least 1.5R in your favor AND has established new structure (new higher low for longs, new lower high for shorts).
Drawdown Management
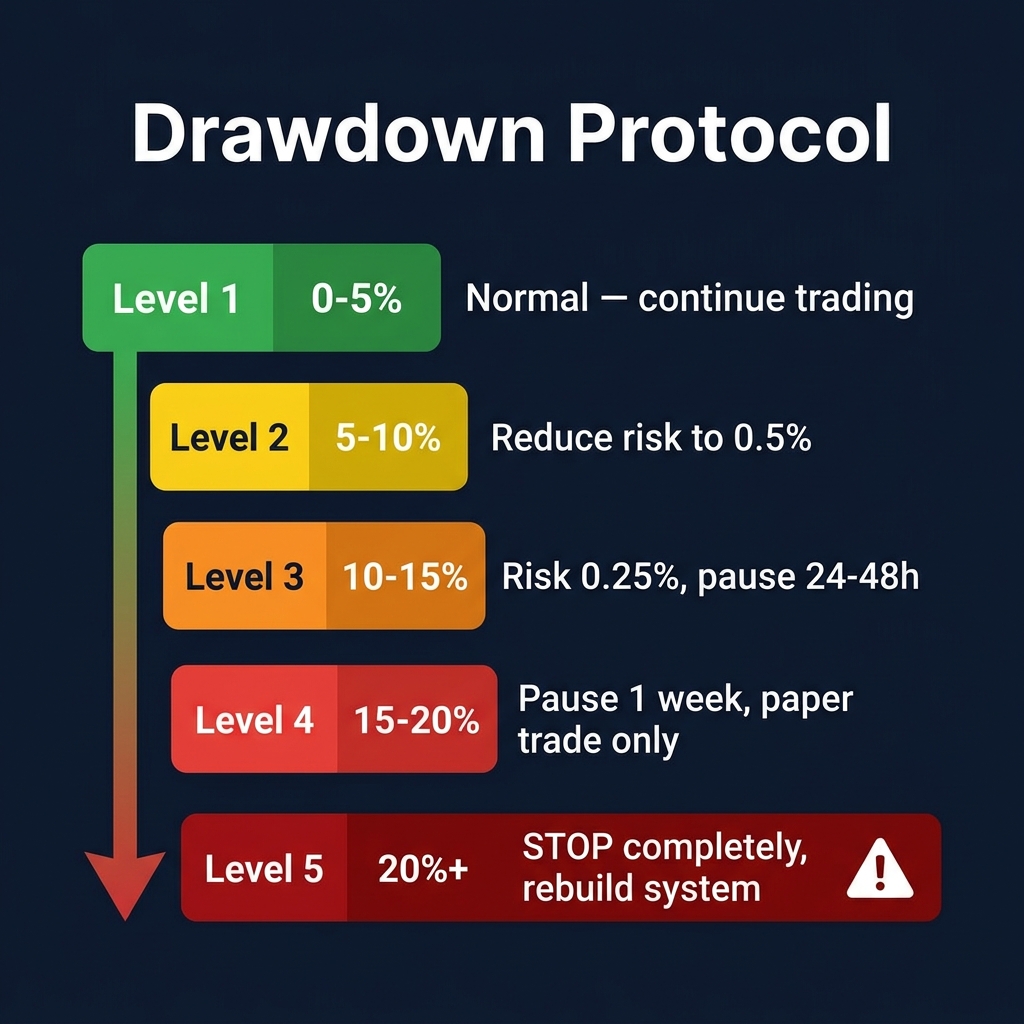
The Drawdown Protocol
Drawdown Level
Action
0-5%
Normal — continue trading your system
5-10%
Reduce risk to 0.5% per trade. Review last 10 trades for pattern errors
10-15%
Reduce risk to 0.25% per trade. Stop trading for 24-48 hours. Journal review
15-20%
Pause all trading for 1 week. Full system audit. Paper trade only
20%+
Stop trading completely. Something is fundamentally broken. Rebuild from scratch
The Recovery Math
The best drawdown recovery strategy is small, consistent wins — not one big revenge trade.
Down 15% ($10,000 → $8,500)
Need 17.6% to recover

Option A: One big trade risking 10% → 50/50 chance of recovery vs 25% drawdown
Option B: 20 trades risking 0.5% with +0.5R expectancy → steady recovery over 2-3 weeks

Option B ALWAYS wins long-term. Always.
CoinXSight Risk Tools
Backtest Module
CoinXSight's Backtest module lets you test your risk parameters against historical data. Before risking real money, verify:
Does your system have positive expectancy?
What's the maximum historical drawdown?
How many consecutive losses can your system produce?
Alpha Hunter Risk Filters
Alpha Hunter signals include risk-adjusted metrics. Each signal shows the suggested stop distance and R/R ratio, so you can immediately calculate position size using the formula above.
Portfolio Heat Dashboard
Track your total exposure across all open positions with CoinXSight's portfolio view. Set custom heat alerts to get notified when your total risk exceeds your defined thresholds.
The greatest traders in history don't have the best entries. They have the best risk management. Ed Seykota, one of the most successful traders of all time, said it simply: "The elements of good trading are: 1. Cut losses. 2. Cut losses. 3. Cut losses." Everything else is secondary.
Master funding rate analysis, open interest tracking, and liquidation cascade prediction for crypto trading. Learn to read leveraged positioning, detect…
Master multi-timeframe analysis for crypto trading. Learn the 3-timeframe rule, top-down analysis flow, timeframe alignment signals, and how to combine…
Master risk management for crypto trading. Learn position sizing formulas, stop-loss strategies, and how CoinXSight's Portfolio module tracks your risk…