ASI Score Explained: How CoinXSight’s AI Rates Every Crypto Token
Deep dive into CoinXSight's Alpha Signal Index (ASI) score — the 4-layer AI scoring system that combines technical, on-chain, sentiment, and volume data into one actionable number.
CB
Chloe BennettMarket Intelligence & Narrative Lead·May 17, 2026 · 12 min read · Updated Oct 6
The Alpha Signal Index (ASI) is CoinXSight's proprietary AI scoring system that evaluates every crypto token across four independent data layers and produces a single confidence score from 0 to 100. Instead of requiring traders to manually check 12+ indicators, the ASI score synthesizes all of them into one actionable number.
Think of the ASI score as a multi-specialist medical diagnosis. Rather than visiting separate doctors for blood work, X-rays, and physical examination, the ASI runs all tests simultaneously and delivers a unified health report for each token. Each "specialist" (data layer) contributes its independent assessment, and the final score reflects the consensus.
The ASI score is not a crystal ball — it's a probability engine. A score of 85 doesn't guarantee price will go up. It means that across four independent data dimensions, the weight of evidence strongly favors a specific direction. Higher scores correlate with higher probability setups, though no score is infallible.
The 4 Scoring Layers: Architecture Deep Dive
Every ASI score is composed of four independent scoring layers, each analyzing a completely different data dimension. This multi-layer approach is what gives the ASI its edge — if any single layer produces a false signal, the other three layers act as a filter.
Layer 1: Technical Analysis Score (Weight: ~30%)
The technical layer runs traditional and advanced indicators across the 4H timeframe:
Indicators analyzed:
EMA Crossovers: 9/21/50/200 EMA positions and recent crossovers (EMA Guide)
RSI Status: Current reading, divergences from price, overbought/oversold zones (RSI Guide)
MACD Momentum: Histogram direction, signal line crossovers, divergences (MACD Guide)
Bollinger Bands: Position within bands, band squeeze/expansion (BB Guide)
Support/Resistance: Proximity to AI-identified key levels (S/R Guide)
Scoring logic:
Each indicator receives a sub-score (bullish, neutral, or bearish). The technical layer aggregates these sub-scores with weighting — trend-following indicators (EMA, market structure) receive slightly higher weight than oscillators (RSI, MACD) because trend direction is the single most important technical factor.
Example: If EMAs are bullish (crossover up), market structure shows higher highs, RSI is at 55 (healthy mid-range), MACD histogram is positive and expanding, and price is above the Bollinger midband — the technical layer might score 82/100.
Layer 2: On-Chain Intelligence (Weight: ~25%)
The on-chain layer monitors blockchain data that reveals what large participants are actually doing with their tokens:
Metrics analyzed:
Exchange Net Flow: Are coins flowing to exchanges (sell pressure) or leaving exchanges (accumulation)? (Exchange Flow Guide)
Whale Movement: Are top-100 wallets accumulating or distributing? (Whale Tracking Guide)
Smart Money Flow: Direction and magnitude of institutional-grade transactions (Smart Money Flow Guide)
Holder Distribution: Concentration changes — are whales increasing their share or are holdings distributing more broadly?
Active Addresses: Growth or decline in active addresses as a demand proxy
Scoring logic:
On-chain data is inherently bullish or bearish. Net outflows from exchanges = bullish. Whale accumulation = bullish. Growing active addresses = bullish. Each metric is scored independently, then aggregated.
Why this layer is critical: On-chain data reveals what market participants are doing, not what they're saying. A whale can tweet bearish sentiment while quietly accumulating millions of dollars worth of tokens. The on-chain layer catches this discrepancy.
Layer 3: Sentiment Analysis (Weight: ~20%)
The sentiment layer processes natural language data from multiple sources using NLP (Natural Language Processing):
Data sources:
Twitter/X: Volume of mentions, sentiment classification (bullish/bearish/neutral)
Reddit: Discussion sentiment in crypto-specific subreddits
News: Headline sentiment from major crypto news outlets
Community channels: Telegram and Discord activity levels
Scoring logic:
Sentiment scoring is more nuanced than simply "positive = bullish." The ASI uses sentiment as both a directional AND contrarian indicator:
Moderate positive sentiment + rising: Confirmation of bullish trend → adds to score
Extreme negative sentiment (capitulation): Contrarian signal → adds to score
This is a critical design decision. Most naive sentiment tools treat all positive sentiment as bullish, missing the reality that extreme euphoria precedes market tops and extreme fear precedes bottoms.
Layer 4: Volume & Momentum (Weight: ~25%)
The volume layer detects anomalies and momentum shifts that indicate institutional activity:
Metrics analyzed:
Volume Deviation: Current volume vs 20-period average — volumes 1.5x+ above average signal institutional participation
Breakout Probability: Statistical analysis of price compression (Bollinger squeeze) + volume buildup → probability of imminent breakout
Momentum Quality: Is the price move supported by volume (healthy) or occurring on declining volume (weak)?
Abnormal Activity Detection: Sudden volume spikes in specific tokens that deviate from market-wide patterns
Scoring logic:
Above-average volume in the direction of the trend is bullish. Above-average volume against the trend is bearish. Declining volume during a trend extension is a warning sign. Volume surges during consolidation suggest an imminent breakout.
How to Read ASI Scores in Practice
On the AI Analysis Module
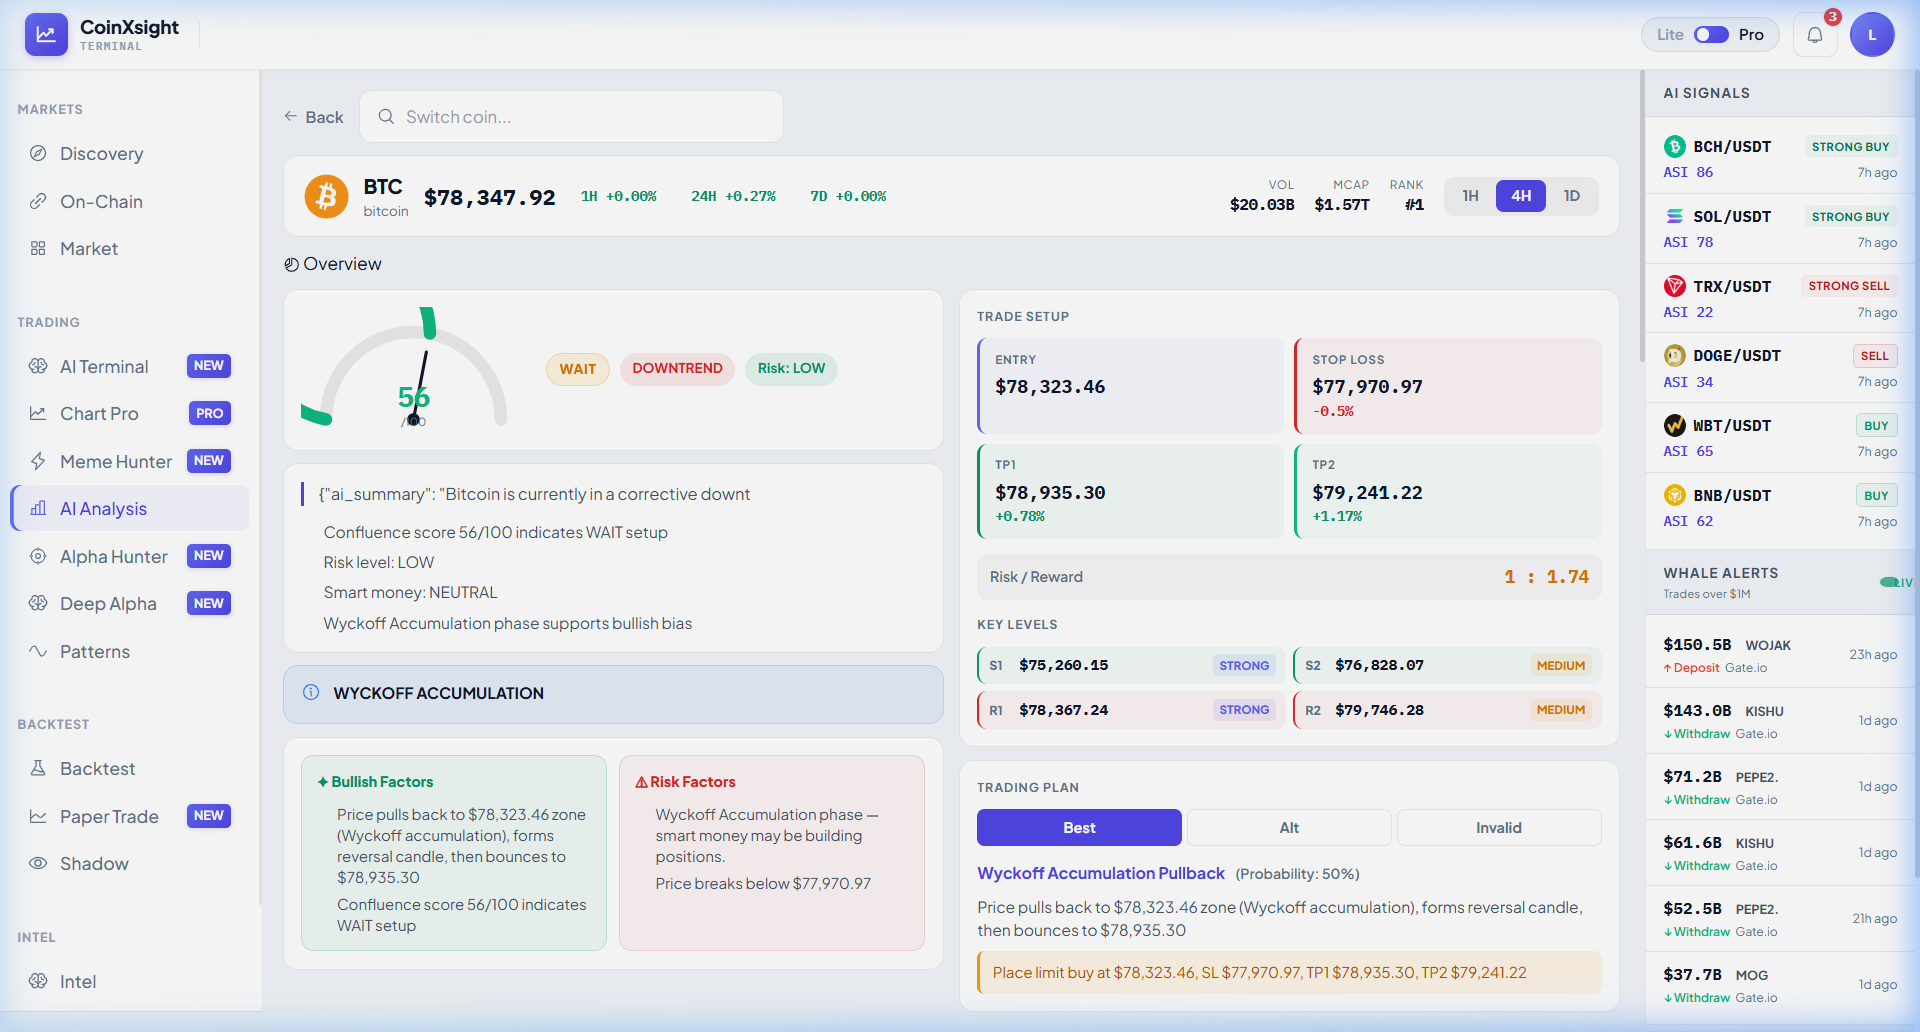
When you analyze any token in CoinXSight's AI Analysis module, the ASI score is displayed as the central metric alongside a trading recommendation:
What you see:
Overall ASI Score: The composite number (0-100) displayed prominently
Direction Recommendation: BUY, SELL, or HOLD based on the score
Key Levels: AI-identified support, resistance, and stop-loss levels
Confidence Band: How tightly the four layers agree — tight agreement = high confidence
On the Alpha Hunter Pipeline
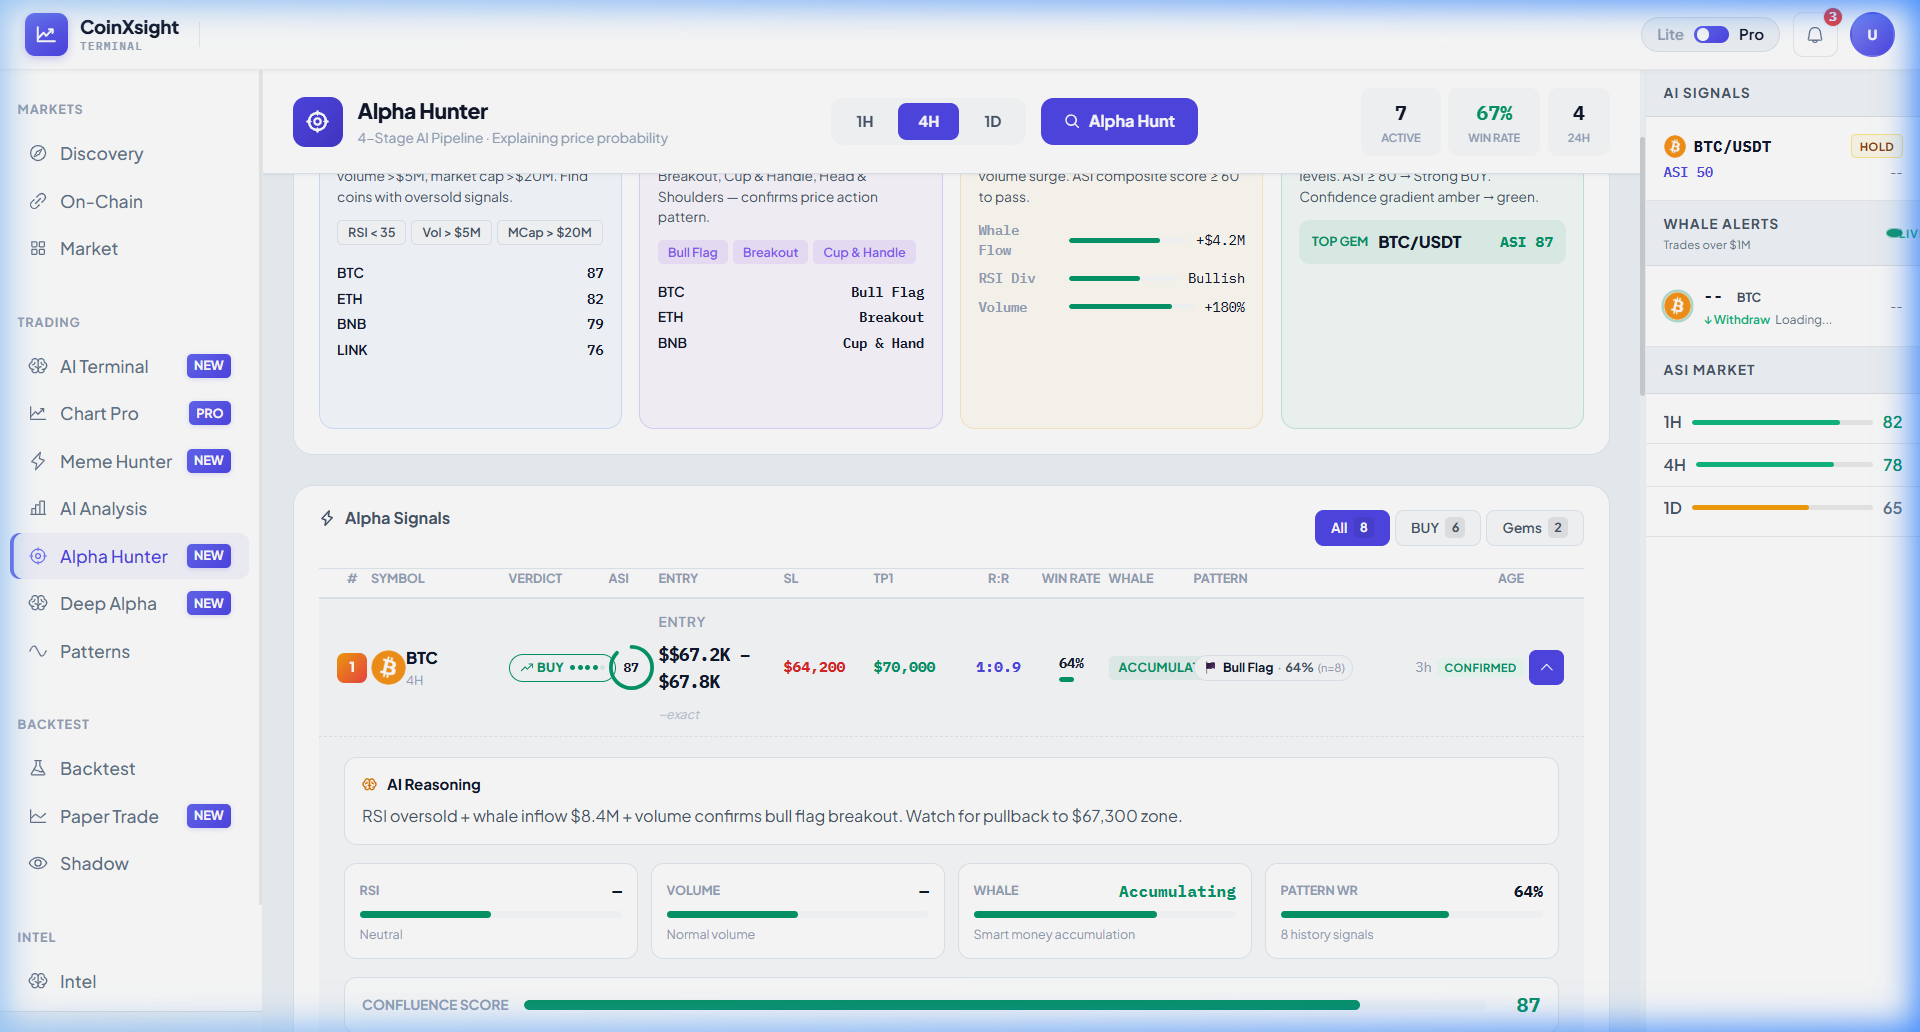
In Alpha Hunter, the ASI score determines which tokens pass through the final screening stage:
The confluence breakdown shows how individual factors contribute to the overall signal strength. Notice how each factor (Volume Assessment, RSI Status, Whale Activity, Pattern Recognition) receives an independent evaluation, then combines into the final signal score.
On the AI Terminal
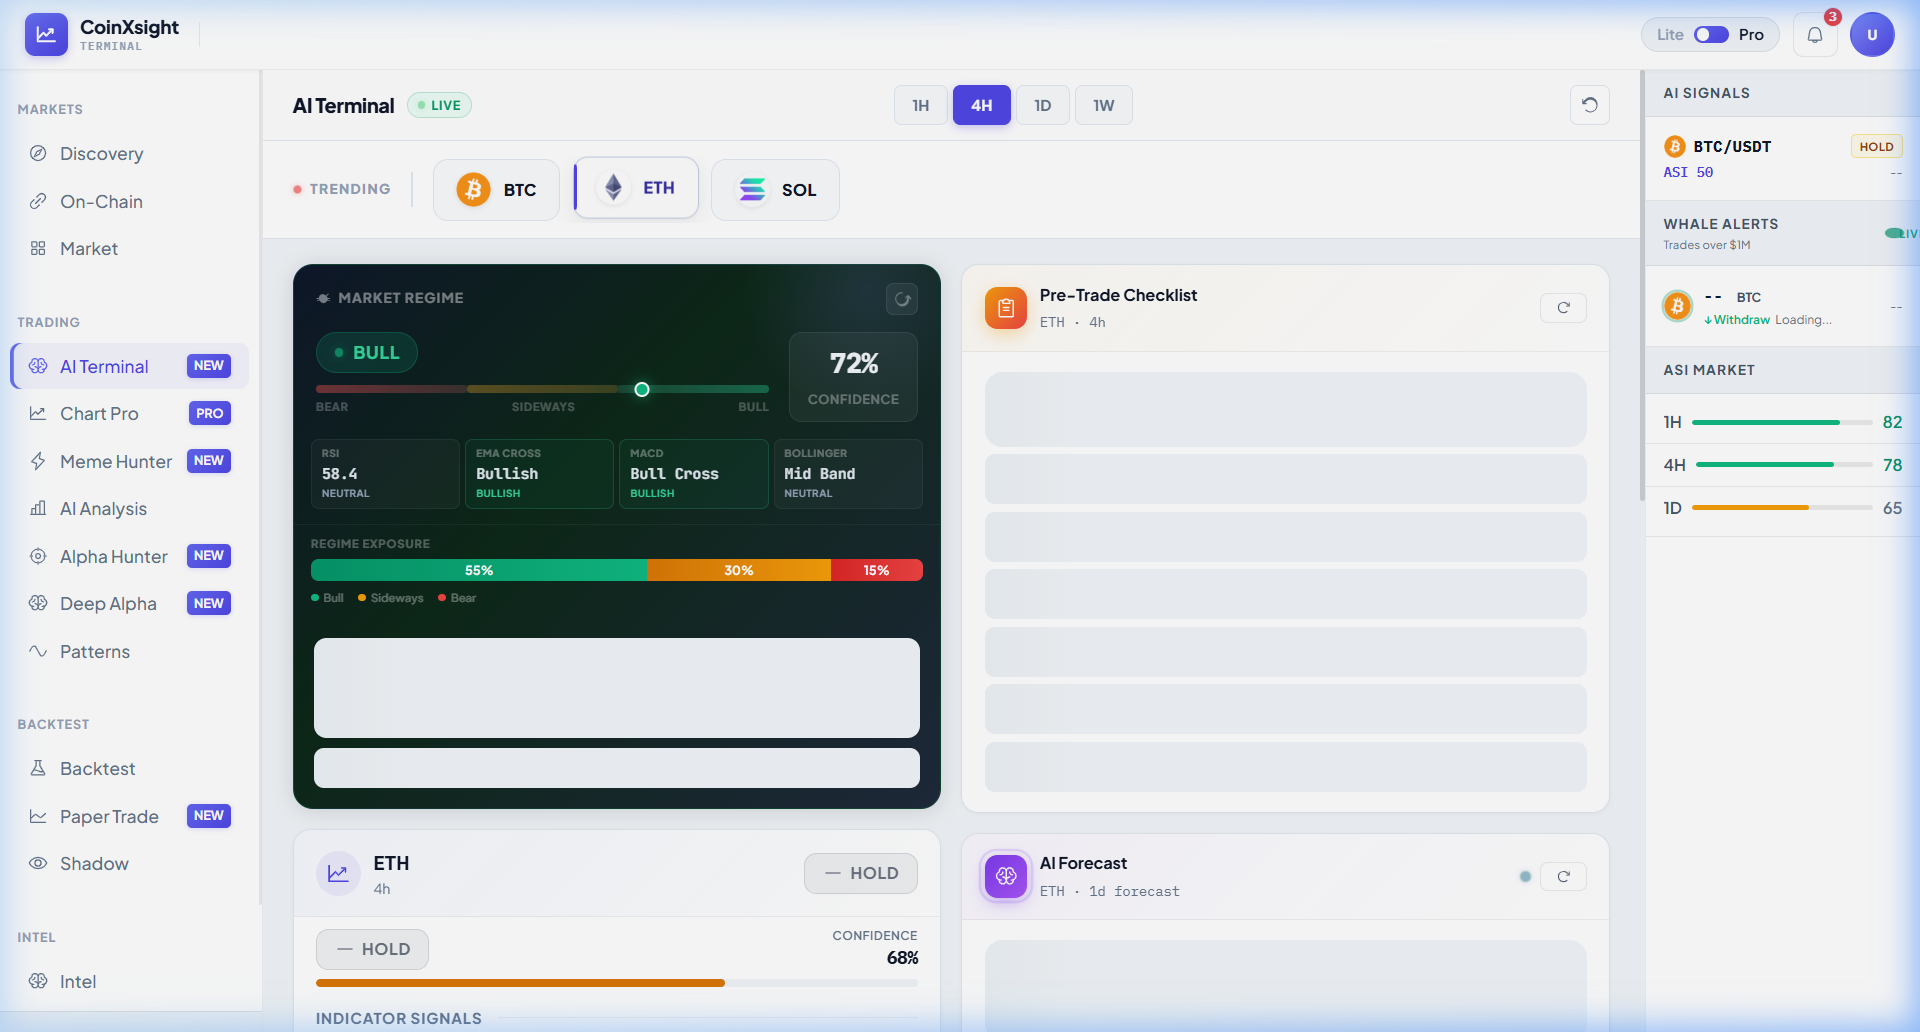
The AI Terminal provides a macro-level ASI view across multiple tokens and timeframes:
This view is particularly useful for quickly comparing which tokens are showing the strongest AI signals. The trending chips (BTC, ETH, SOL, etc.) allow instant switching between token analyses.
ASI Score Interpretation Guide
Score Ranges and What They Mean
ASI Score
Classification
Interpretation
Recommended Action
85-100
🟢 Very Strong
All 4 layers strongly aligned in one direction
High-conviction entry; use full position size
70-84
🟢 Strong
3-4 layers agree, minor dissent
Solid entry; standard position size
55-69
🟡 Moderate
Mixed signals; 2 layers agree, 2 neutral or opposing
Smaller position; wait for confirmation
40-54
⚪ Neutral
No clear directional edge
No trade; monitor for changes
25-39
🟡 Weak Bearish
Weight of evidence slightly bearish
Avoid new longs; consider hedging
0-24
🔴 Strong Bearish
Strong bearish alignment across layers
Exit longs; consider shorts if experienced
What Makes a Score of 85+?
An ASI score above 85 is rare and requires near-unanimous agreement across all four layers:
Example of a 87 ASI score breakdown:
Technical (30%): EMA bullish crossover + RSI at 58 + MACD expanding + price breaking above resistance → 28/30
On-Chain (25%): Exchange outflows sustained for 5 days + whale accumulation detected + active addresses growing → 22/25
Volume (25%): Volume declining during price bounce (weak bounce) + no breakout pattern → 9/25
Total: 32/100
When ASI Scores Are Wrong: Understanding False Signals
No scoring system is perfect. Understanding when and why the ASI produces false signals makes you a better trader.
False Bullish Signals (ASI High but Price Drops)
Cause 1: Black swan events
The ASI can show 80+ on Monday and by Wednesday the token drops 30% due to a hack, regulatory action, or stablecoin crisis. The AI processes historical and current data but cannot predict unprecedented events.
Cause 2: Liquidity traps
In low-liquidity tokens, the technical and volume layers can produce bullish readings that are actually caused by wash trading or thin order books. The on-chain layer partially compensates for this, but sophisticated manipulation can fool all layers simultaneously.
How to mitigate:
Cross-reference ASI signals with your own fundamental analysis
Be more cautious with high ASI scores on low-market-cap tokens
False Bearish Signals (ASI Low but Price Pumps)
Cause 1: Narrative-driven pumps
A token can show ASI 35 (bearish) and then pump 100% because an Elon Musk tweet, a major partnership announcement, or a viral meme changes sentiment instantaneously. The AI's sentiment layer updates quickly but not instantly.
Cause 2: Short squeeze dynamics
Heavy short positioning can trigger violent upward moves that defy bearish technical and on-chain readings. The ASI doesn't directly model derivatives market positioning.
How to mitigate:
Always check for upcoming catalysts (token unlocks, protocol upgrades, partnerships)
Use the ASI as a probability assessment, not a certainty
Size positions appropriately — a low ASI score means lower probability, not zero probability
The key differentiator is that the ASI score is designed for trading decisions, not just sentiment monitoring. It produces specific, actionable levels (entry, stop-loss, targets) rather than just a mood reading.
Building a Daily ASI-Based Trading Routine
Morning Scan (10 minutes)
Open AI Terminal → Check BTC ASI across 1H, 4H, 1D
If all timeframes bullish → Bias: Long. Focus on buying opportunities.
If mixed → Bias: Neutral. Reduce position sizes.
If all bearish → Bias: Short/Cash. Avoid new longs.
Check Alpha Hunter → Review any new signals with ASI 70+
Add high-score signals to your watchlist for further analysis
Quick token comparison → Use AI Terminal trending chips to compare top tokens
Identify which tokens have the highest ASI scores today
Pre-Trade Analysis (5 minutes per token)
Open AI Analysis → Analyze each watchlist candidate
Review full 4-layer breakdown
Note key levels (entry, stop, targets)
Check if the score is improving or deteriorating vs yesterday
Confluence check → Does the ASI agree with your own chart analysis?
ASI 75+ AND your own technical setup aligns → Trade
ASI 75+ BUT your analysis disagrees → Reduce size or skip
ASI below 55 → No trade regardless of your analysis
End-of-Day Review (5 minutes)
Check open positions → Has the ASI score changed for tokens you're holding?
Score improved → Hold or add
Score stable → Hold
Score dropped below 50 → Tighten stop-loss
Score dropped below 30 → Consider exit
Frequently Asked Questions
How often does the ASI score update?
The ASI score recalculates continuously based on live market data. Technical and volume layers update with each new candle close (4H primary). On-chain data updates as new blockchain transactions are confirmed. Sentiment data updates as new social/news content is processed. In practice, meaningful score changes occur over hours, not minutes.
Can I use ASI scores for day trading?
The ASI is optimized for swing trading (1-14 day holds) because the on-chain and sentiment layers require time to produce meaningful patterns. For day trading, use the technical layer direction (available on the chart) as your primary guide, and the full ASI as a macro filter.
What if two tokens both have ASI 80+ — which do I trade?
Choose the token where: (1) your own technical analysis also confirms the setup, (2) the risk/reward ratio is more favorable, (3) liquidity is higher (easier entry/exit), and (4) you have no existing exposure to the same sector.
Does the ASI score account for tokenomics and fundamentals?
The current ASI focuses on market data (technical, on-chain, sentiment, volume). Fundamental factors like token supply schedules, protocol revenue, and team credibility are not directly scored. Always supplement the ASI with your own fundamental research, especially for smaller-cap tokens.
How should beginners start using the ASI score?
Start by only trading tokens with ASI scores above 70. This limits your opportunity set but dramatically improves your starting accuracy. As you gain experience and learn to interpret the individual layers, you can incorporate moderate-score setups (55-70) with additional confirmation.
Is the ASI score available for all tokens?
The ASI covers tokens with sufficient on-chain data and trading volume. Major tokens (top 100 by market cap) receive the most comprehensive analysis. For very new or low-volume tokens, some on-chain data may be limited, which can affect score accuracy.
Summary
The ASI score transforms the overwhelming complexity of crypto market analysis into a single, actionable number. By independently evaluating four data dimensions — technical indicators, on-chain intelligence, sentiment analysis, and volume momentum — the score provides a multi-perspective confidence assessment that no single indicator can match.
The key principles for using ASI effectively:
Scores above 70 are high-probability setups — but always confirm with your own analysis
Scores below 40 are strong warnings — avoid new positions and tighten existing stops
No score is infallible — black swan events, narrative shifts, and manipulation can override any data-driven analysis
Use ASI as a filter, not a replacement for human judgment
The practical workflow is simple: check macro ASI direction on the Terminal, scan for high-score tokens on Alpha Hunter, deep-dive candidates on AI Analysis, and execute with proper position sizing. This systematic approach gives you an analytical edge while keeping you firmly in control of the final trading decision.