On-Chain Analysis for Crypto Beginners: Reading the Blockchain Like a Pro
Learn the fundamentals of on-chain analysis for crypto trading. Understand key blockchain metrics, whale movements, and how to use on-chain data for smarter investment decisions.
DP
David ParkChief On-Chain Data Analyst·May 17, 2026 · 10 min read · Updated Oct 6
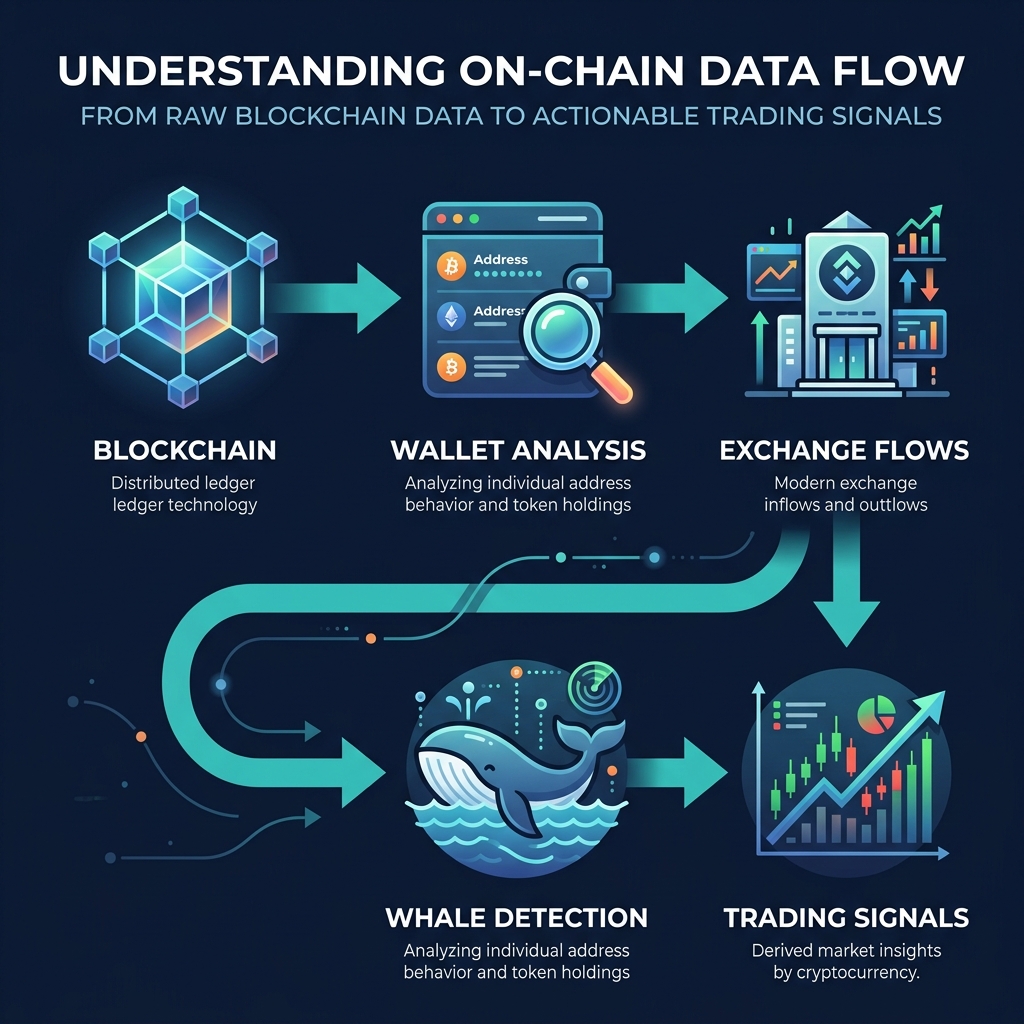
On-chain analysis is the study of blockchain data to understand what is actually happening inside a cryptocurrency network. Unlike technical analysis, which examines price charts and patterns, on-chain analysis looks at the raw transactions recorded on the blockchain — who is buying, who is selling, how much is moving, and where it's going.
Think of it this way: technical analysis tells you what the price is doing. On-chain analysis tells you why the price might move next.
Every Bitcoin transaction, every Ethereum transfer, every Solana swap is permanently recorded on the blockchain. This data is public and transparent, which means anyone can analyze it. The challenge is knowing what to look for and how to interpret it. That's what this guide covers.
On-Chain vs Technical Analysis: What's the Difference?
Aspect
Technical Analysis
On-Chain Analysis
Data source
Price charts, volume bars
Blockchain transactions, wallet data
What it shows
Historical price patterns
Actual behavior of holders and institutions
Timeframe
Any (1m to monthly)
Usually daily or weekly
Best for
Timing entries/exits
Understanding market structure and accumulation
Limitation
Lagging (shows past price action)
Slower data updates, can be manipulated
Why use both? Technical analysis is excellent for timing, but it cannot tell you whether whales are accumulating or distributing. On-chain analysis reveals these hidden behaviors, giving you a significant edge in understanding the market's true direction before price reflects it.
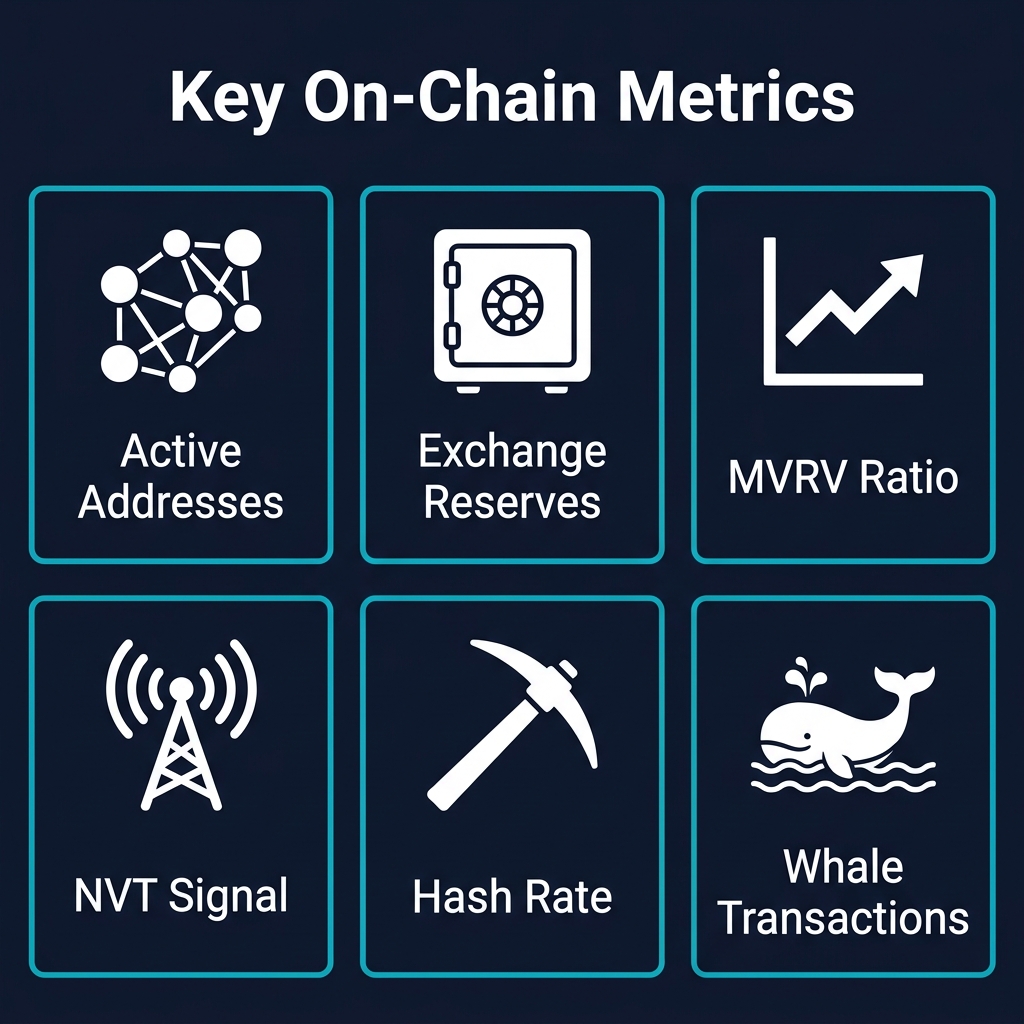
8 Essential On-Chain Metrics Every Trader Should Know
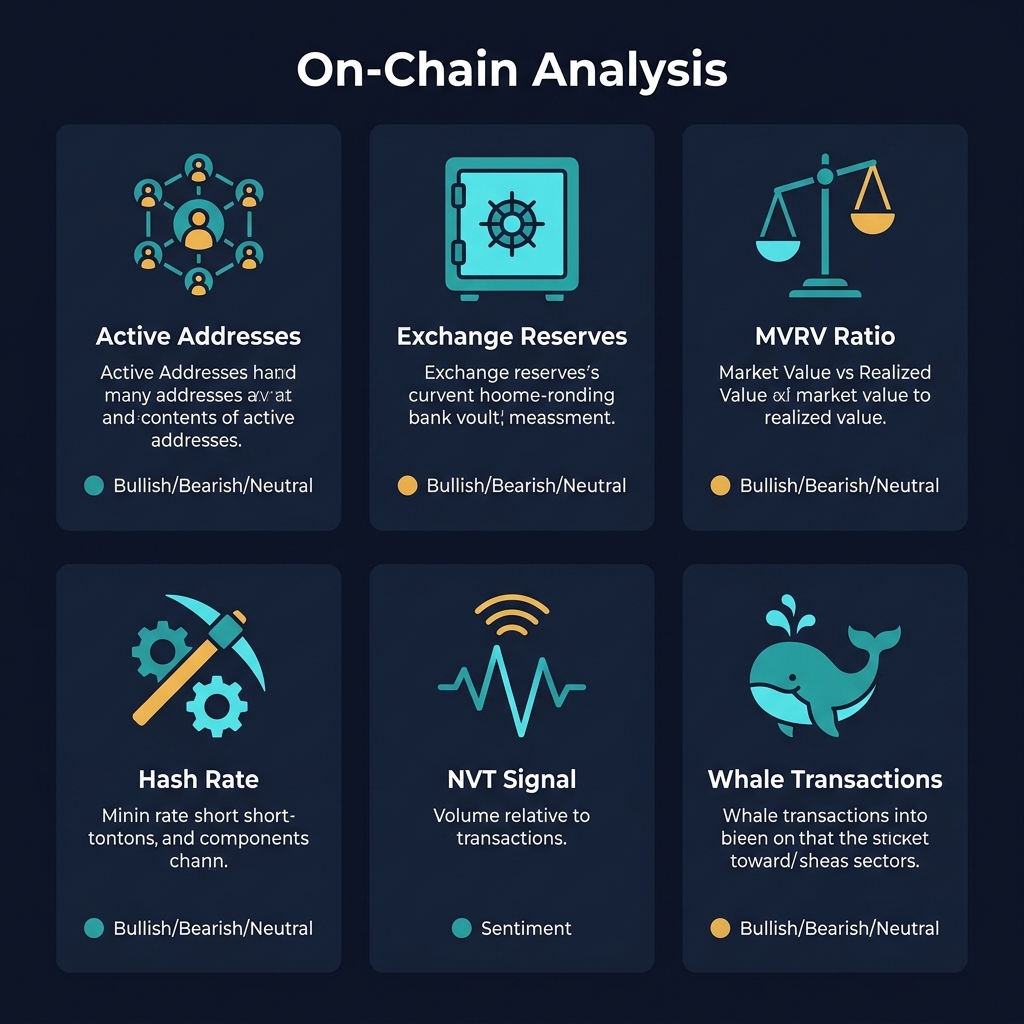
1. Active Addresses
Active addresses count the number of unique wallet addresses that send or receive transactions in a given period. A rising number of active addresses indicates growing network usage and adoption.
How to interpret:
Rising active addresses during a price increase → genuine demand, bullish
Rising active addresses during a price decrease → possible capitulation or new users buying the dip
Declining active addresses during a price increase → speculative rally with thin participation, bearish divergence
Why it matters: Network activity is one of the most honest indicators of real demand. Price can be manipulated through wash trading on exchanges, but creating thousands of active on-chain addresses costs real money.
2. Exchange Reserves
Exchange reserves measure the total amount of a cryptocurrency held on centralized exchanges. When coins move from exchanges to private wallets, it suggests holders plan to keep them long-term (bullish). When coins move to exchanges, it suggests holders may be preparing to sell (bearish).
Increasing exchange reserves → coins entering exchanges → distribution phase
Rapid spike in exchange inflows → potential large sell-off incoming
CoinXSight's Whale Stream module tracks these exchange flows in real-time, alerting you when significant amounts of Bitcoin or altcoins move to or from major exchanges.
3. NVT Ratio (Network Value to Transactions)
NVT is like the P/E ratio for crypto. It divides a network's market cap by the daily transaction volume moving through the blockchain. A high NVT means the network is "overvalued" relative to its actual usage. A low NVT suggests the network is transacting more value than its market cap reflects.
How to interpret:
NVT above 95-100 → network is potentially overvalued, price may correct
NVT below 50-60 → network is undervalued relative to usage, potential buying opportunity
Rapidly rising NVT during a rally → speculative bubble warning
4. MVRV Ratio (Market Value to Realized Value)
MVRV compares a crypto's market cap to its "realized cap" — the average price at which every coin last moved on-chain. It shows whether the average holder is in profit or loss.
How to interpret:
MVRV above 3.5 → most holders are heavily in profit → historically correlates with market tops
MVRV below 1.0 → most holders are at a loss → historically correlates with market bottoms
MVRV between 1.0-2.0 → neutral zone, accumulation opportunity
5. Whale Wallet Activity
Whale wallets (holding 1,000+ BTC or equivalent) are closely watched because their transactions can move markets. Tracking whale accumulation and distribution patterns provides insight into institutional sentiment.
Key signals:
Whales adding positions during a dip → strong buy signal
Whales moving large amounts to exchanges → prepare for selling pressure
New whale wallets appearing → fresh institutional interest
CoinXSight's Smart Money Flow analysis tracks these whale wallet changes and incorporates them into the AI scoring system automatically.
6. Mining/Staking Metrics
For Proof-of-Work chains (Bitcoin), miner behavior is significant. When miners sell their BTC, it increases supply pressure. When miners hold (accumulate), it reduces available supply.
For Proof-of-Stake chains (Ethereum, Solana), staking metrics matter. A high staking ratio means less circulating supply, which is generally bullish for price.
Transaction fees reflect network demand. During periods of high activity (NFT mints, DeFi summer, meme coin mania), fees spike dramatically. Sustained high fees indicate genuine demand, while fee spikes followed by crashes indicate temporary hype.
How to interpret:
Sustained high fees → real network demand, bullish for native token
Fee spike then crash → temporary event, not sustainable
This metric shows how the total supply of a token is distributed across wallet sizes. A healthy distribution has many holders with moderate amounts. A concentrated distribution (top 10 wallets hold 80%+ of supply) is a risk factor.
Gradual decrease in concentration → organic distribution, healthy
Sudden increase in a single wallet → potential accumulation by institution or insider
How CoinXSight Integrates On-Chain Data
CoinXSight's AI engine doesn't just look at price charts. It integrates on-chain data into its scoring system at multiple levels:
ASI Score (Alpha Signal Index): The ASI score combines technical indicators, on-chain metrics (whale flows, exchange reserves), and sentiment data into a single confidence rating. A token with strong technical signals AND bullish on-chain activity will score higher than one with only technical confirmation.
Whale Stream Module: Real-time tracking of large transactions across major blockchains. The Whale Tracking Guide explains how to interpret these signals and integrate them into your trading decisions.
Smart Money Flow: The Smart Money Flow analysis tracks institutional money movement patterns, identifying accumulation and distribution phases before they become visible on price charts.
Discovery Engine: The Discovery module surfaces tokens based on a combination of price velocity, volume anomalies, and on-chain activity changes. Tokens appearing in Discovery are experiencing measurable increases in blockchain activity, not just price pumps.
Building an On-Chain Analysis Workflow
Here is a practical daily workflow for incorporating on-chain analysis into your crypto trading:
Step 1: Check Macro On-Chain Health (5 minutes)
Is Bitcoin's MVRV in accumulation or distribution territory?
Are exchange reserves increasing or decreasing?
What's the overall active address trend?
Step 2: Review Whale Activity (5 minutes)
Open CoinXSight's Whale Stream for the tokens in your watchlist
Check for any large exchange inflows/outflows in the last 24 hours
Note any whale wallet changes (new positions, closed positions)
Step 3: Cross-Reference with Technical Analysis (5 minutes)
If on-chain data is bullish (whale accumulation, decreasing exchange reserves) AND technical analysis shows a support level or bullish pattern → strong confluence
If on-chain and TA disagree, wait for alignment before entering
Step 4: Check CoinXSight's ASI Score (2 minutes)
Tokens with ASI scores above 70 that also show bullish on-chain signals represent the highest-probability opportunities
The AI Analysis module already incorporates on-chain data, so a high ASI score confirms both technical and on-chain alignment
Common Mistakes Beginners Make with On-Chain Data
1. Treating All Whale Movements as Signals
Not every large transaction is meaningful. Exchanges regularly move funds between hot and cold wallets for security. These internal transfers can appear as massive "whale movements" but have zero market impact. Focus on whale movements to/from exchanges and between identified institution wallets.
2. Ignoring Timeframes
On-chain data is most useful on daily and weekly timeframes. Don't try to use on-chain metrics for scalping 5-minute charts. The data updates too slowly and the signals are too noisy on short timeframes.
3. Using On-Chain Data in Isolation
On-chain analysis is most powerful when combined with technical analysis and sentiment data. A whale accumulating during a downtrend doesn't mean the bottom is in — it means smart money is interested, but price may still drop before reversing.
4. Confusing Correlation with Causation
Just because exchange reserves decreased before a price pump doesn't mean the next decrease will cause a pump. On-chain metrics provide probabilities, not certainties. Always combine with other confirmation signals.
Frequently Asked Questions
Is on-chain analysis only useful for Bitcoin?
No. On-chain analysis works for any blockchain with transparent transaction data. Ethereum, Solana, and most major blockchains provide rich on-chain data. CoinXSight tracks on-chain metrics across multiple chains and integrates them into the unified ASI scoring system.
Do I need to pay for on-chain data tools?
Basic on-chain data is available through free explorers like Etherscan and Blockchain.com. However, derived metrics (MVRV, NVT, whale tracking) require aggregated data that platforms like CoinXSight provide as part of the integrated trading dashboard.
How quickly does on-chain data change?
Most on-chain metrics update daily. Some metrics like exchange flows and whale transactions can be tracked in near real-time. CoinXSight's Whale Stream provides alerts within minutes of significant on-chain movements.
Can on-chain data be manipulated?
Partially. Large holders can create misleading on-chain signals by moving funds between their own wallets. This is why experienced analysts look for clusters of wallet activity rather than individual transactions. CoinXSight's Smart Money Flow algorithm filters out known wash-transfer patterns to provide cleaner signals.
What's the most important on-chain metric for beginners?
Start with exchange reserves. It's simple to understand (coins leaving exchanges = bullish, coins entering = bearish) and historically one of the most reliable on-chain indicators. Once comfortable, add MVRV and whale tracking.
Summary
On-chain analysis gives you access to information that most retail traders ignore entirely — the actual behavior of blockchain participants, institutions, and whale wallets. While technical analysis shows you where price has been, on-chain analysis shows you what market participants are doing with their holdings right now.
For beginners, start with exchange reserves and whale tracking, then gradually incorporate more advanced metrics like MVRV, NVT, and supply distribution. CoinXSight integrates these on-chain metrics directly into its AI scoring system, so you benefit from on-chain intelligence even if you don't analyze the raw data yourself.