Elliott Wave Theory for Crypto: A Practical Trading Guide
Cut through the complexity of Elliott Wave analysis. Learn the 5-3 wave structure, the three unbreakable rules, and how to apply wave counting to BTC, ETH, and altcoin charts for high-probability entries.
MC
Marcus ChenSenior Quantitative Strategist·May 20, 2026 · 14 min read · Updated Oct 6
Why Most Traders Give Up on Elliott Wave (And How to Avoid That)
Elliott Wave Theory has a reputation problem. It's simultaneously praised as the most powerful forecasting framework in technical analysis and criticized as subjective nonsense where every analyst counts waves differently.
The truth is somewhere in the middle. Elliott Wave is powerful — but only when you accept its limitations and use it as a probability framework, not a crystal ball.
This guide focuses on the practical, tradeable aspects of Elliott Wave. We skip the advanced sub-wave subdivisions and focus on what actually generates profit.
The 5-3 Structure: The Foundation of Everything
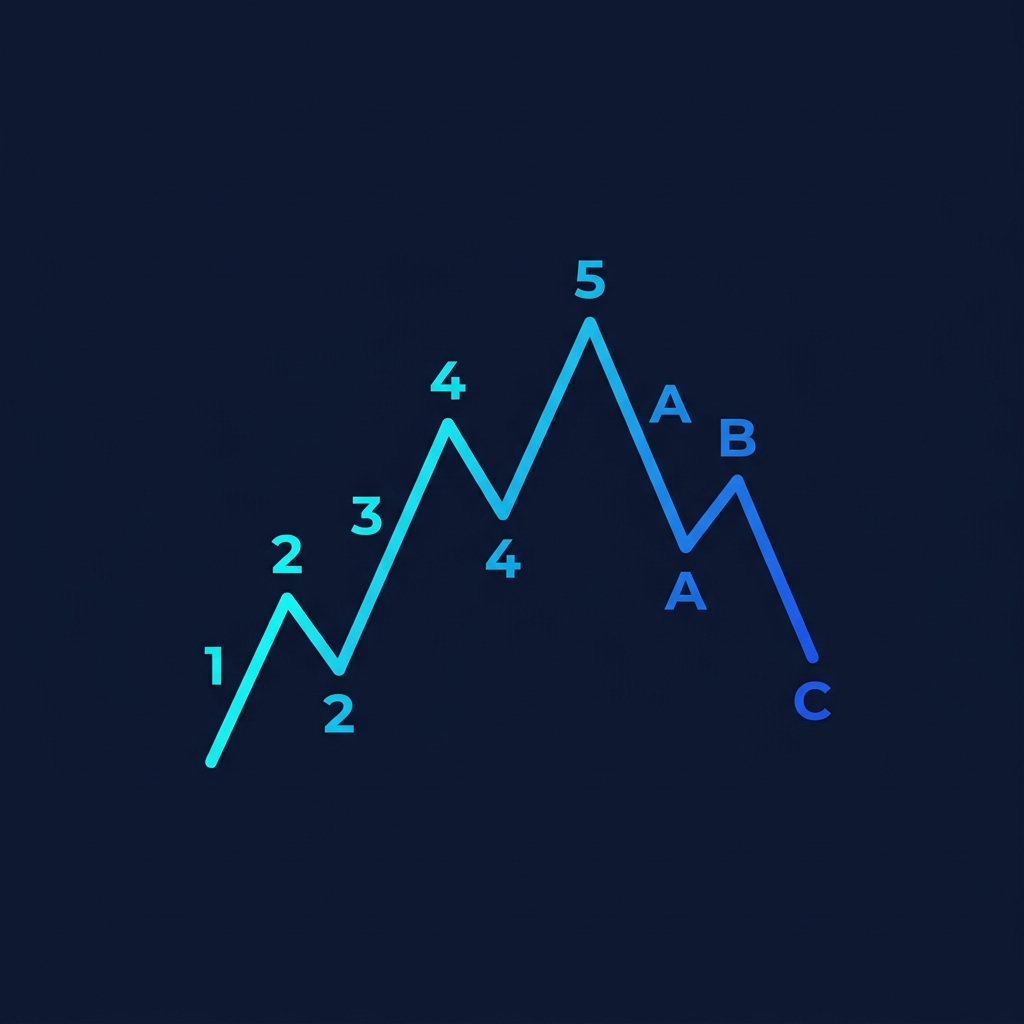
Every trending market move follows a basic 5-3 pattern:
You place your entries and targets at these levels.
Corrective Pattern Types
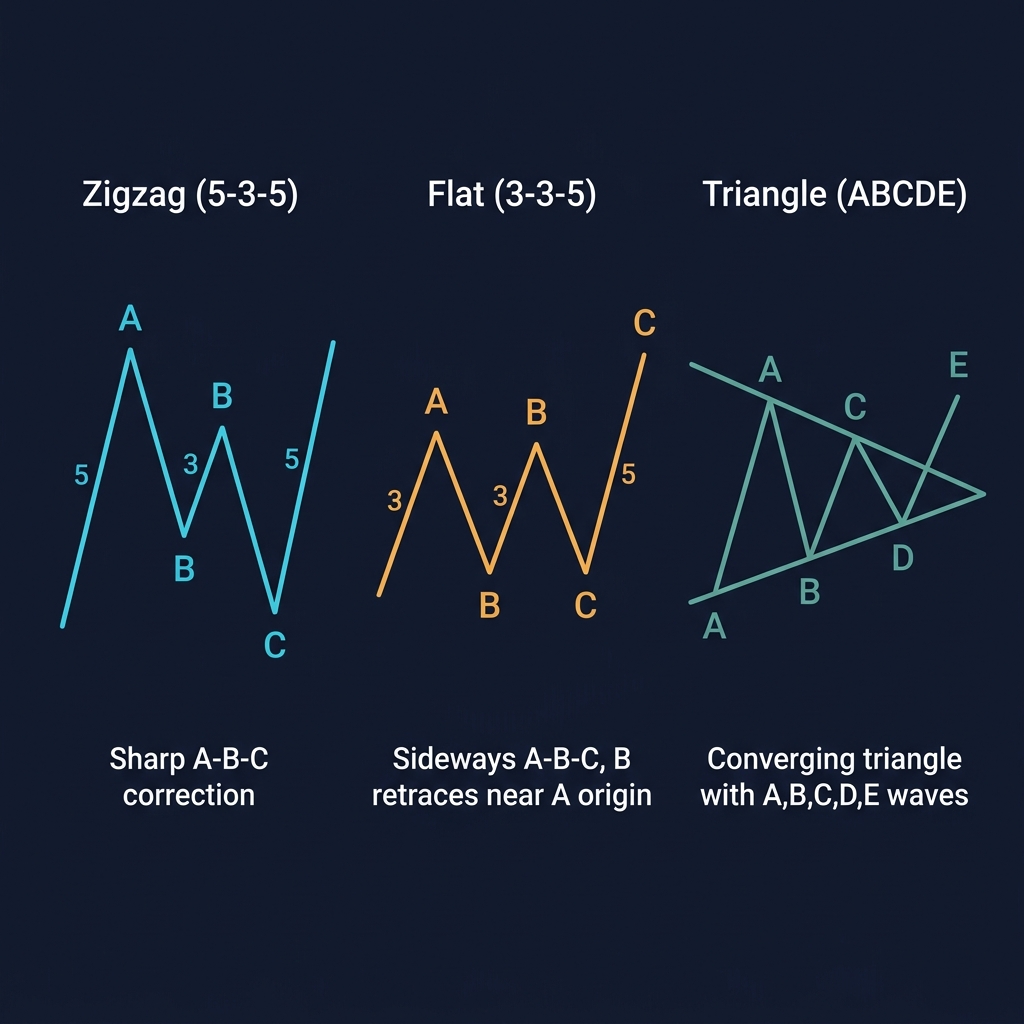
Not all corrections are simple A-B-C. The three main corrective structures:
Zigzag (5-3-5)
Sharp, deep correction
Each wave subdivides: A = 5 waves, B = 3 waves, C = 5 waves
Typically retraces 50-78.6% of the prior impulse
Common after: Extended Wave 3 impulses
Trading opportunity: Enter at the end of Wave C
Flat (3-3-5)
Sideways, shallow correction
Wave B retraces approximately 100% of Wave A
Wave C approximately equals Wave A
Common after: Strong trends with continued momentum
Trading opportunity: Less tradeable internally, but the completion signals trend continuation
Triangle (3-3-3-3-3)
Contracting sideways pattern (ABCDE)
Each wave is a 3-wave structure
Price coils into tighter range before breaking out
Common in: Wave 4 position (before the final Wave 5)
Trading opportunity: Break of the triangle boundary = Wave 5 start
Trading Elliott Wave in Crypto: The Practical Framework
Strategy 1: Wave 3 Entry (Highest Probability)
The bread-and-butter Elliott trade. Enter at the start of Wave 3:
Setup:
Identify a completed Wave 1 (initial impulse move)
Wait for Wave 2 to retrace to 50-78.6% of Wave 1
Confirm the Wave 2 low with bullish RSI divergence or a reversal candle
Enter long at the Wave 2 completion
Targets:
TP1: Wave 1 high (Wave 3 at 1.0x extension)
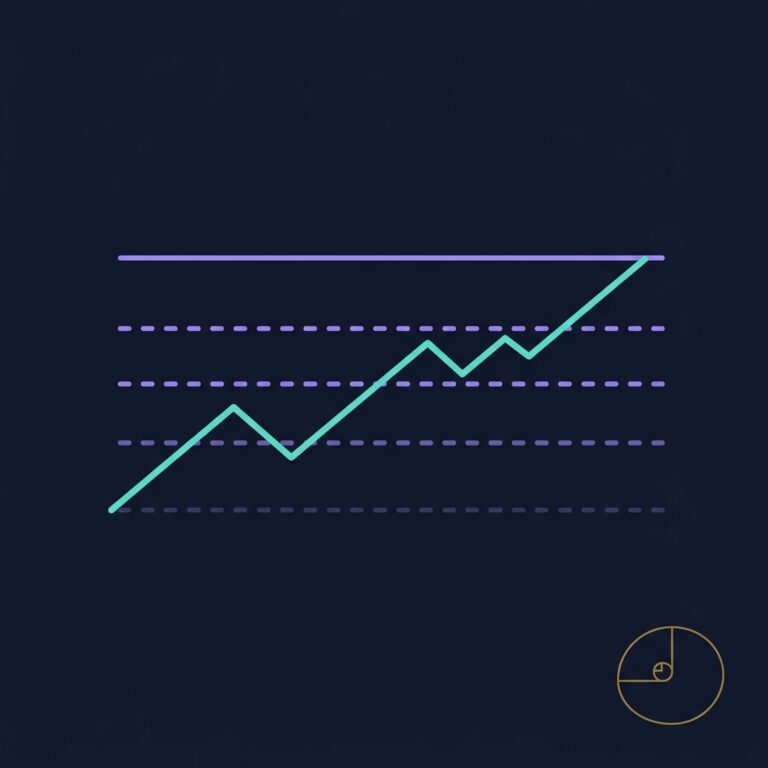
TP2: 1.618x extension of Wave 1
TP3: 2.618x extension of Wave 1
Stop Loss: Below the Wave 2 low (which should not be below Wave 1 start)
Risk/Reward: Typically 1:3 to 1:5
Strategy 2: Wave 5 Exhaustion Short
Catch the reversal at the end of Wave 5:
Setup:
Count a clear 5-wave impulse to the upside
Wave 5 approaches a Fibonacci extension target (typically 0.618x or 1.0x of Wave 1-3)
RSI/MACD show bearish divergence (new price high, lower indicator high)
Volume is declining compared to Wave 3
Entry: Short at the first lower high after Wave 5 peak
Target: Wave 4 low (conservative) or Wave 2 level (aggressive)
Stop: Above the Wave 5 high
Strategy 3: Wave C Completion Buy
Buy the fear at the end of a corrective phase:
Setup:
Identify a completed 5-wave impulse to the upside
Count waves A and B of the correction
Project Wave C target (typically equals Wave A, or 1.618x Wave A)
Look for bullish reversal signals at the projected C completion zone
Entry: Long at Wave C completion with reversal confirmation
Target: Above the Wave 5 high (new impulse beginning)
Stop: Below the projected C extension (if C extends beyond 1.618x A, the count may be wrong)
Wave Counting in Practice: A BTC Example
Let's walk through a real-world wave count on BTC's 2024-2025 macro structure:
Current position (May 2026): We appear to be in the corrective A-B-C phase after the Wave 5 top, with BTC at ~$77,200. If this analysis is correct, Wave C completion could offer a major buying opportunity for the next impulse cycle.
Common Mistakes in Crypto Elliott Wave Analysis
Mistake 1: Forcing Counts to Fit a Bias
The most common error. If you're bullish, you'll "see" Wave 2 completions everywhere. If you're bearish, everything looks like Wave 5 exhaustion.
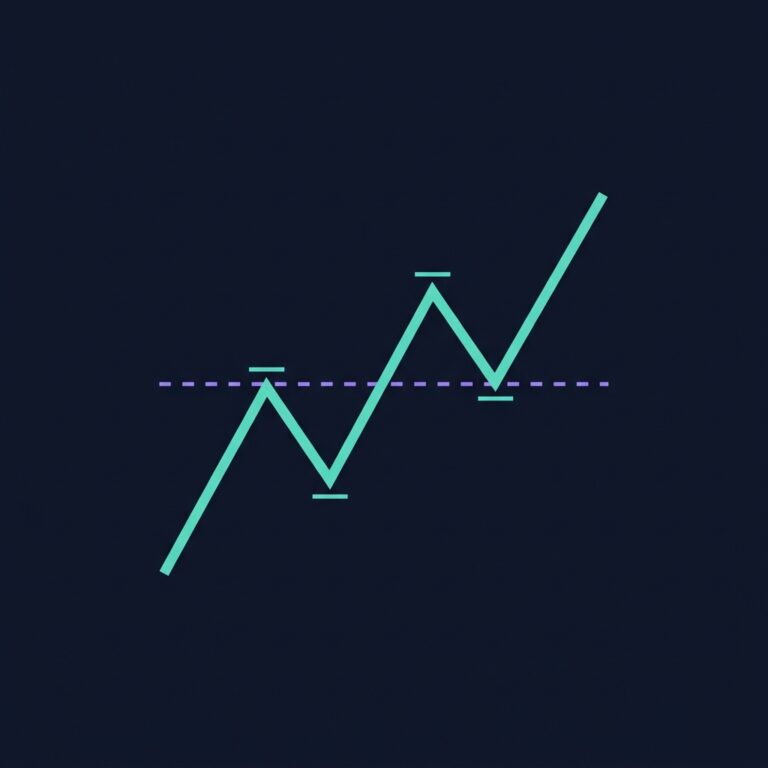
Solution: Count waves objectively, starting from the three rules. If the rules are violated, your count is wrong — regardless of your opinion.
Mistake 2: Ignoring Degree
Elliott waves exist at every timeframe simultaneously. A 5-minute Wave 3 is happening inside a 4-hour Wave 1, which is inside a daily Wave 3. Confusing degrees leads to conflicting signals.
Solution: Always identify the degree you're trading. For swing trades, use the 4H-Daily degree. For day trades, use the 1H degree. Check the higher degree for context.
Mistake 3: Trading Wave 4 as if It's Wave 2
Wave 4 corrections are typically sideways and complex (triangles, flats), while Wave 2 corrections are typically sharp and deep (zigzags). Applying Wave 2 expectations to Wave 4 leads to premature entries.
Solution: Use the alternation guideline — if Wave 2 was sharp, expect Wave 4 to be flat/complex.
Mistake 4: Counting Every Wiggle
Not every price fluctuation is a wave. In crypto's 24/7 market, noise is abundant. Trying to label every 5-minute bar as a wave leads to paralysis.
Solution: Stick to 4H and daily charts for wave counting. Use lower timeframes only for timing entries within the larger wave structure.
Elliott Wave + CoinXSight Integration
Chart Pro for Wave Counting
Use Chart Pro's drawing tools to plot wave labels and Fibonacci extensions. The multi-timeframe view lets you see wave structures across 1H, 4H, and 1D simultaneously.
Deep Alpha for Wave Confirmation
Deep Alpha's multi-factor scoring provides independent confirmation of your wave count:
Wave Position
Expected Deep Alpha Reading
Wave 2 completion
Low Momentum + High Fear + Smart Money Accumulation starting
Wave 3 mid-point
High Trend + High Momentum + Expanding Volume
Wave 4 consolidation
Declining Momentum + Mixed signals + Low Volume
Wave 5 exhaustion
Momentum divergence + Distribution starting + Peak Fear
Wave C completion
Extreme Fear + Smart Money Accumulation + Low Volume
If your wave count says "Wave 3 is starting" but Deep Alpha shows declining momentum and distribution — your count is probably wrong.
Alpha Hunter for Wave-Based Entries
Alpha Hunter signals that coincide with Elliott Wave levels have higher probability:
An Alpha buy signal at a projected Wave 2 completion = high confluence
An Alpha sell signal at a Wave 5 extension target with divergence = strong short setup
The Honest Assessment
Elliott Wave works best when:
✅ Used on higher timeframes (4H, Daily, Weekly)
✅ Combined with Fibonacci for precise targets
✅ Validated with volume and momentum indicators
✅ Applied as a probability framework, not a prediction tool
Elliott Wave fails when:
❌ Applied to low timeframes (5m, 15m) — too much noise
❌ Used as the sole analysis method without confirmation
❌ Wave counts are forced to match existing bias
❌ Applied to low-liquidity altcoins with insufficient market structure
Quick Reference: Wave Trading Cheat Sheet
Setup
When to Trade
Entry
Stop
Target
R:R
Wave 3 long
Wave 2 at 50-78.6% retracement
End of Wave 2
Below Wave 2 low
1.618x extension
1:3-5
Wave 5 short
Wave 5 at extension target + divergence
First lower high
Above Wave 5 high
Wave 4 low
1:2-3
Wave C buy
Wave C at 1.0-1.618x of Wave A
Reversal at C completion
Below C extension
Above Wave 5
1:3-4
Use CoinXSight's Chart Pro to identify and label Elliott Wave structures across multiple timeframes, with Deep Alpha multi-factor scoring for wave count confirmation.
Master multi-timeframe analysis for crypto trading. Learn the 3-timeframe rule, top-down analysis flow, timeframe alignment signals, and how to combine…