Harmonic Patterns in Crypto: Trading the Gartley, Butterfly & Bat
Master harmonic pattern trading for cryptocurrency markets. Learn to identify Gartley, Butterfly, Bat, and Crab patterns using Fibonacci ratios, with real crypto chart examples and entry/exit strategies.
MC
Marcus ChenSenior Quantitative Strategist·May 20, 2026 · 13 min read · Updated Oct 6
Harmonic patterns are geometric price structures that use precise Fibonacci ratios to identify potential reversal zones. Unlike basic chart patterns (head & shoulders, triangles), harmonics demand mathematical precision — each leg must hit specific Fibonacci levels for the pattern to be valid.
This precision is both their strength (high accuracy when valid) and their limitation (many "almost" patterns that fail).
Why Harmonics Work Particularly Well in Crypto
Crypto markets exhibit characteristics that favor harmonic patterns:
Strong momentum-and-reversal cycles — crypto trends hard, then snaps back
Fibonacci levels are self-fulfilling — millions of traders watch the same ratios
24/7 markets — patterns complete without gap interference
High volatility — larger swings create clearer, more tradeable patterns
Algorithmic participation — bots trade Fibonacci levels, reinforcing them
The XABCD Framework
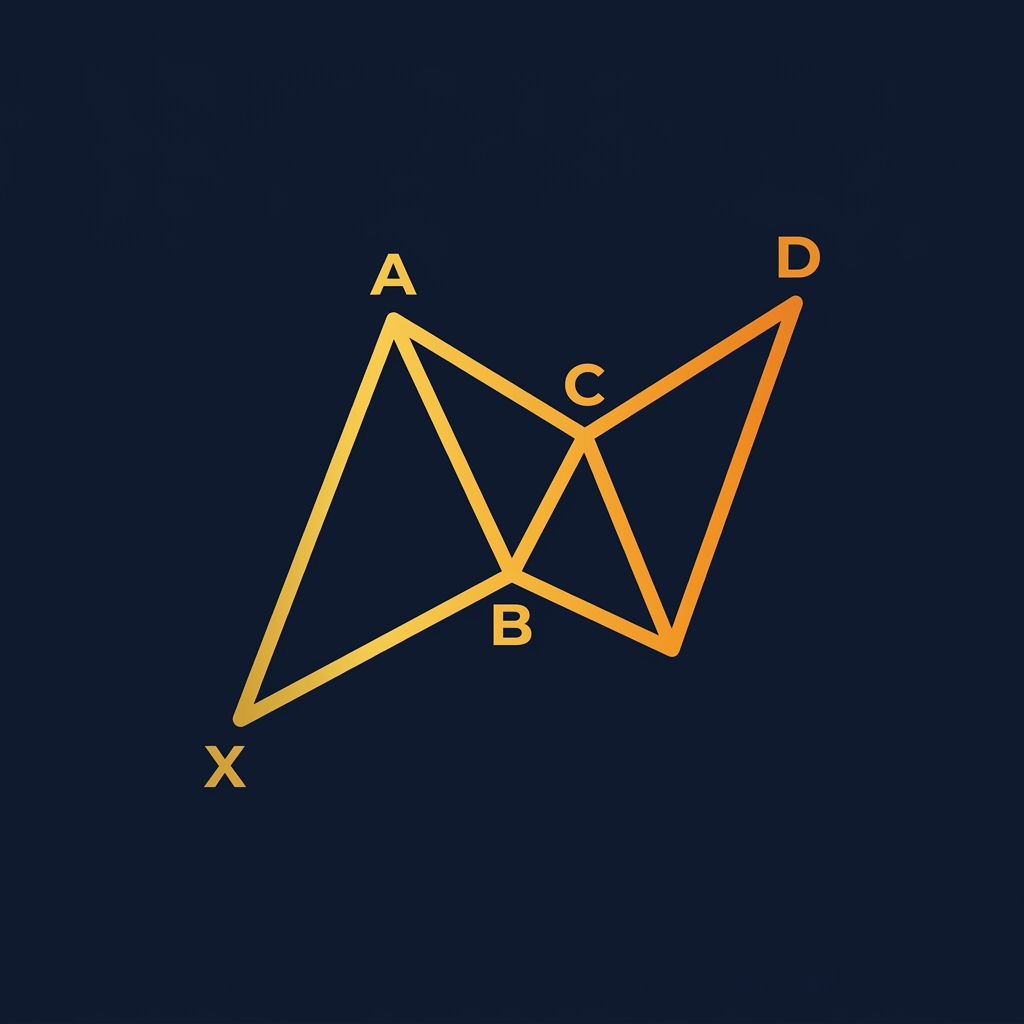
All harmonic patterns follow a 5-point structure: X → A → B → C → D
XA: The initial impulse move
AB: First retracement of XA
BC: Retracement of AB (continues the original direction)
CD: Final leg that completes the pattern at point D
Point D is the Potential Reversal Zone (PRZ) — where you enter trades.
The critical insight: Each pattern is defined by the specific Fibonacci ratios between these legs.
The Four Core Patterns
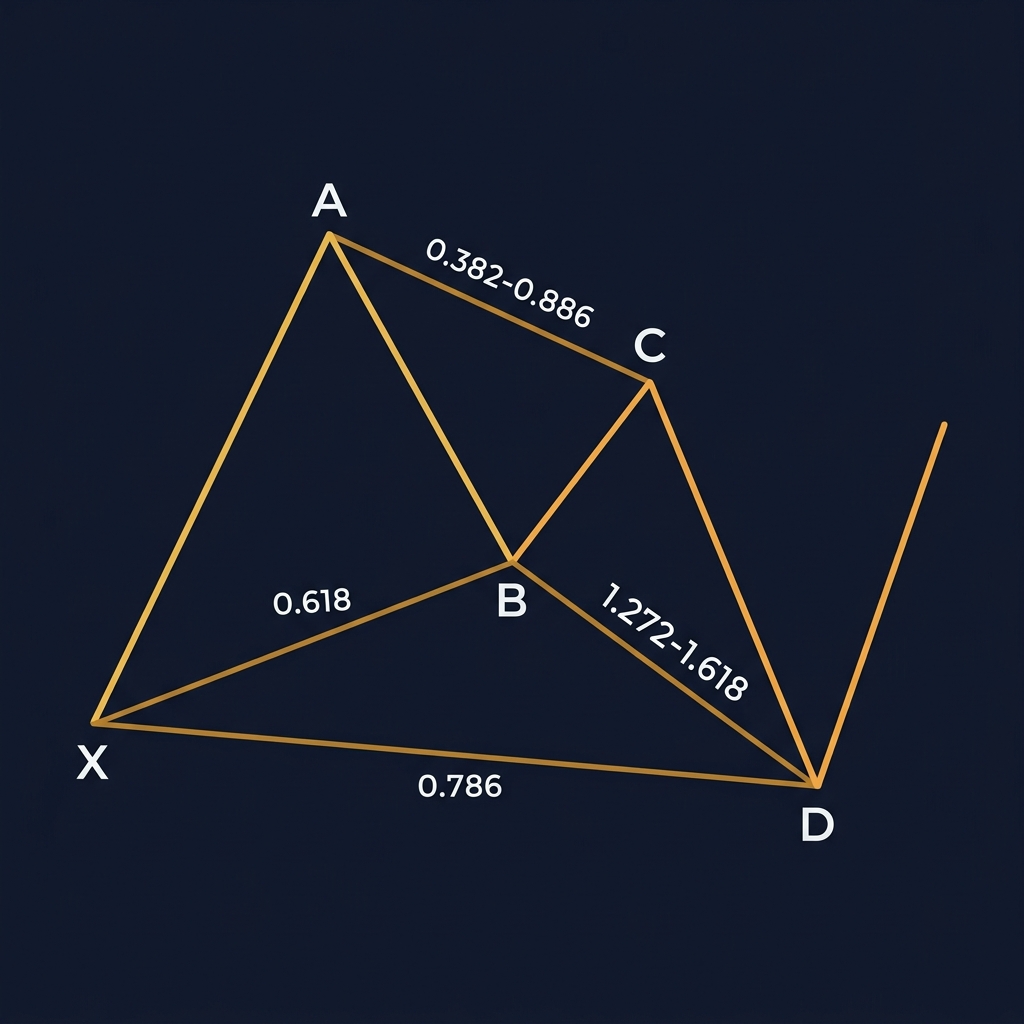
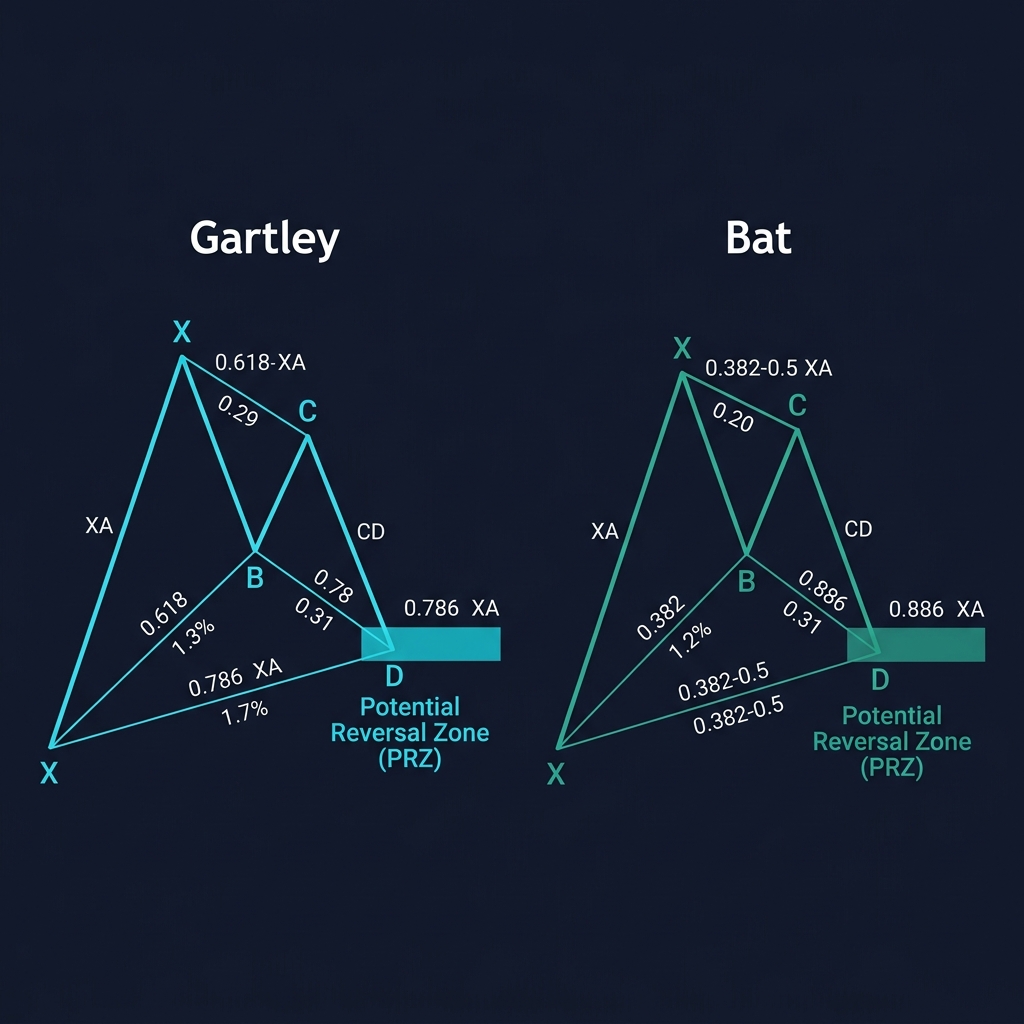
1. The Gartley Pattern (222)
Named after H.M. Gartley's 1935 book "Profits in the Stock Market," the Gartley is the most common harmonic pattern.
Fibonacci Requirements:
Leg
Ratio
Rule
AB
0.618 of XA
Must retrace exactly 61.8%
BC
0.382 – 0.886 of AB
Flexible range
CD
1.272 – 1.618 of BC
Extension of BC
XD
0.786 of XA
D must be at 78.6% of XA
Key Characteristics:
The most "shallow" harmonic pattern (D doesn't exceed X)
Highest win rate among harmonics (~70% in crypto when valid)
Best in trending markets that are pulling back
Point D should NOT exceed point X
Trading the Bullish Gartley:
Identify the XA impulse leg (upward move)
AB retraces ~61.8% of XA
BC moves up but stays below A
CD completes near the 0.786 retracement of XA
Enter LONG at point D with stop below X
TP1: 0.382 retracement of AD | TP2: 0.618 retracement of AD
Risk/Reward: Typically 1:2 to 1:3
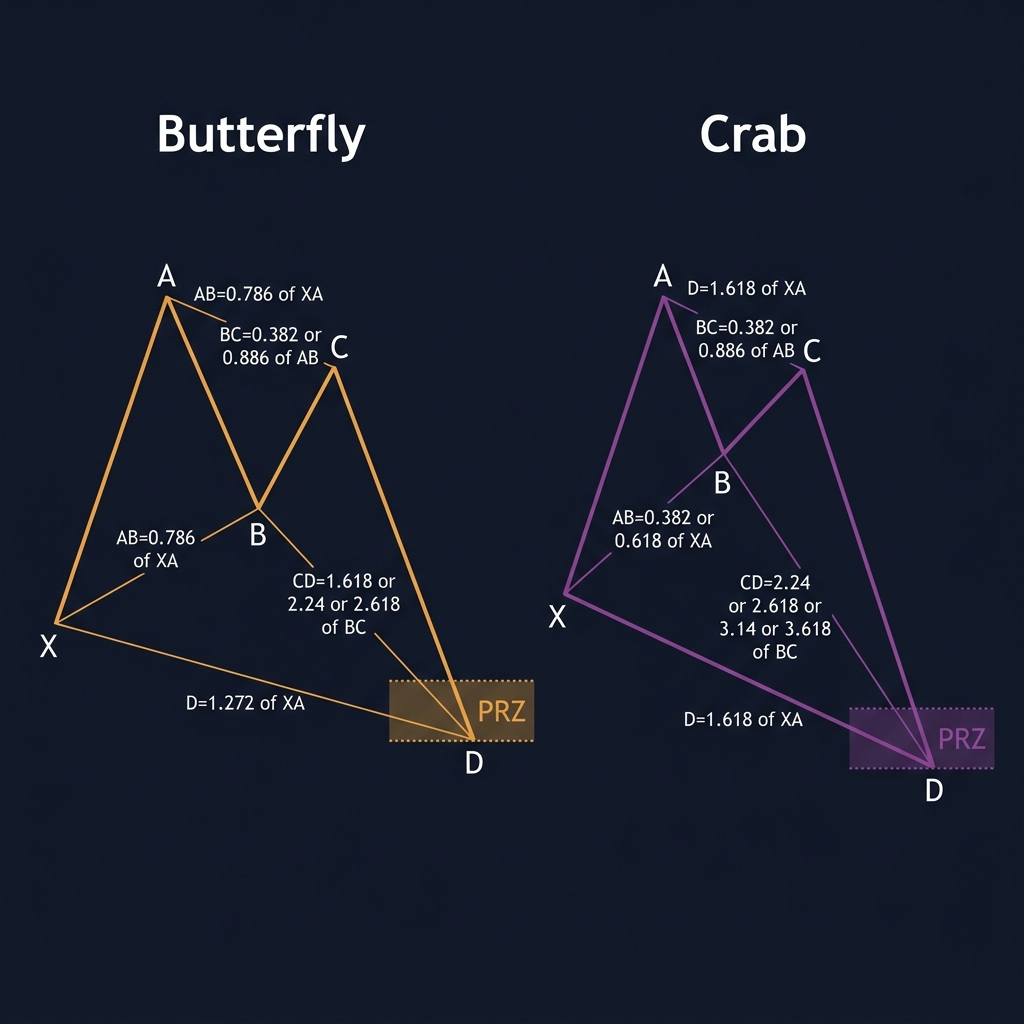
2. The Butterfly Pattern
The Butterfly extends beyond point X, making it ideal for catching reversal extremes.
Fibonacci Requirements:
Leg
Ratio
Rule
AB
0.786 of XA
Must retrace exactly 78.6%
BC
0.382 – 0.886 of AB
Flexible range
CD
1.618 – 2.618 of BC
Significant extension
XD
1.272 – 1.618 of XA
D extends beyond X
Key Characteristics:
More aggressive than Gartley — D goes past X
Appears at major trend exhaustion points
Wider stop requirement (since D can extend significantly)
Excellent for catching major reversals
Crypto Application:
Butterflies frequently appear at the end of altcoin pump cycles. When a token surges 200%+, the subsequent correction often forms a Butterfly pattern where point D represents the final capitulation sell-off before a meaningful bounce.
3. The Bat Pattern
The Bat pattern offers the tightest risk/reward ratio of all harmonics.
Fibonacci Requirements:
Leg
Ratio
Rule
AB
0.382 – 0.50 of XA
Shallow retracement
BC
0.382 – 0.886 of AB
Flexible range
CD
1.618 – 2.618 of BC
Extension
XD
0.886 of XA
D at exactly 88.6% of XA
Key Characteristics:
The 0.886 ratio is unique to the Bat pattern
Offers the best risk/reward (tight stop, wide target)
Less common than Gartley but more reliable
Point D is very close to X — tight invalidation level
Why Traders Love the Bat:
The stop goes just below X (a very short distance from D at 0.886), while targets reach 0.382 and 0.618 of AD — creating risk/reward ratios of 1:3 to 1:5.
4. The Crab Pattern
The most extreme harmonic pattern — and the most profitable when it works.
Fibonacci Requirements:
Leg
Ratio
Rule
AB
0.382 – 0.618 of XA
Standard retracement
BC
0.382 – 0.886 of AB
Flexible range
CD
2.24 – 3.618 of BC
Massive extension
XD
1.618 of XA
D at exactly 161.8% of XA
Key Characteristics:
The most extended pattern — D is far beyond X
Appears during extreme market conditions (crashes, blow-off tops)
Requires patience — the CD leg can take days to complete
When valid, produces the largest profit potential
Crypto Example:
During the 2022 bear market, Bitcoin formed several Crab patterns on the weekly chart. The final Crab pattern completed near $15,500 (the 1.618 extension of the prior XA leg from $69,000 to $32,000), marking the cycle bottom.
The Potential Reversal Zone (PRZ)
The PRZ is not a single price — it's a zone where multiple Fibonacci levels converge:
Constructing the PRZ
Calculate the XD ratio completion level
Calculate the CD extension level
Find the BC projection level
The overlap zone of these calculations is your PRZ
The more Fibonacci levels that cluster in a narrow range, the stronger the PRZ.
PRZ Validation Rules
Before entering at a PRZ, confirm with:
Confirmation
What to Look For
Volume spike
Climactic volume at D suggests exhaustion
RSI divergence
Price makes new low but RSI doesn't
Candlestick reversal
Pin bar, engulfing, or doji at D
Support/resistance confluence
D aligns with horizontal S/R
Order flow shift
Buy pressure emerging (visible on CoinXSight)
Never enter without at least 2 confirmations. The pattern alone is not enough.
Entry, Stop Loss & Take Profit Rules
Entry Strategy
Conservative (recommended for most traders):
Wait for price to reach the PRZ
Wait for a confirmed reversal candle (4H or daily close)
Enter on the next candle open
Aggressive (for experienced traders):
Place limit order at the calculated D point
Stop below X (Gartley/Bat) or at the 1.618/2.618 extension (Butterfly/Crab)
Stop Loss Placement
Pattern
Stop Location
Typical Distance
Gartley
Below X
2-4% from entry
Bat
Below X
1-3% from entry
Butterfly
Below 1.618 XA
3-6% from entry
Crab
Below 2.0 XA
5-8% from entry
Take Profit Targets
TP1 (Conservative): 0.382 retracement of AD
TP2 (Moderate): 0.618 retracement of AD
TP3 (Aggressive): Full retracement to A
Position Management:
Take 50% off at TP1
Move stop to breakeven
Take 30% at TP2
Let 20% run to TP3 with trailing stop
Common Mistakes in Harmonic Trading
Mistake 1: Forcing Patterns
The most common error. If the ratios don't match within 5-10%, it's not a valid harmonic pattern. A Gartley where AB retraces 72% (instead of 61.8%) is not a Gartley — it's just a retracement.
Mistake 2: Ignoring the Trend Context
Bullish harmonics in a strong downtrend have lower success rates. Always check:
Is the pattern forming WITH or AGAINST the higher timeframe trend?
The Alpha Hunter engine detects Wyckoff patterns that often coincide with harmonic completions:
A Wyckoff Spring at the same level as a harmonic PRZ = extremely high-confidence setup
This confluence is what generates 60+ confluence scores in the signal pipeline
Advanced: Multi-Pattern Confluence
The highest probability trades occur when multiple harmonic patterns complete at the same level:
A Gartley on the 4H chart + a Bat on the daily chart at the same price zone
A harmonic PRZ that aligns with a key Fibonacci extension from a larger timeframe
Multiple timeframe harmonics pointing to the same reversal zone
These "stacked" patterns are rare (maybe 2-3 per month across major pairs) but offer exceptional risk/reward.
Pattern Frequency in Crypto Markets
Based on analysis of BTC, ETH, and SOL from 2024-2026:
Pattern
Monthly Frequency (4H)
Average Win Rate
Average R:R
Gartley
4-6
68%
1:2.3
Butterfly
2-3
62%
1:2.8
Bat
3-5
72%
1:3.1
Crab
1-2
58%
1:4.2
The Bat offers the best combination of frequency, win rate, and risk/reward. The Crab is the rarest but most profitable when it hits.
Quick Reference: Pattern Cheat Sheet
Pattern
AB/XA
XD/XA
Best For
Gartley
0.618
0.786
Trend pullbacks
Butterfly
0.786
1.272-1.618
Trend exhaustion
Bat
0.382-0.50
0.886
Best R:R
Crab
0.382-0.618
1.618
Extreme reversals
Use CoinXSight's Chart Pro to identify and validate harmonic patterns in real-time, with Deep Alpha multi-factor confirmation for high-confidence entries.
Master multi-timeframe analysis for crypto trading. Learn the 3-timeframe rule, top-down analysis flow, timeframe alignment signals, and how to combine…