Paper Trading Guide: Practice Crypto Trading Risk-Free with Real Market Data
Master CoinXSight's Paper Trading engine — a full-featured simulated trading environment with real-time Binance data, realistic fees, leverage, performance analytics, and AI-assisted trade setups. Learn to trade without risking real capital.
CB
Chloe BennettMarket Intelligence & Narrative Lead·May 18, 2026 · 12 min read · Updated Oct 6
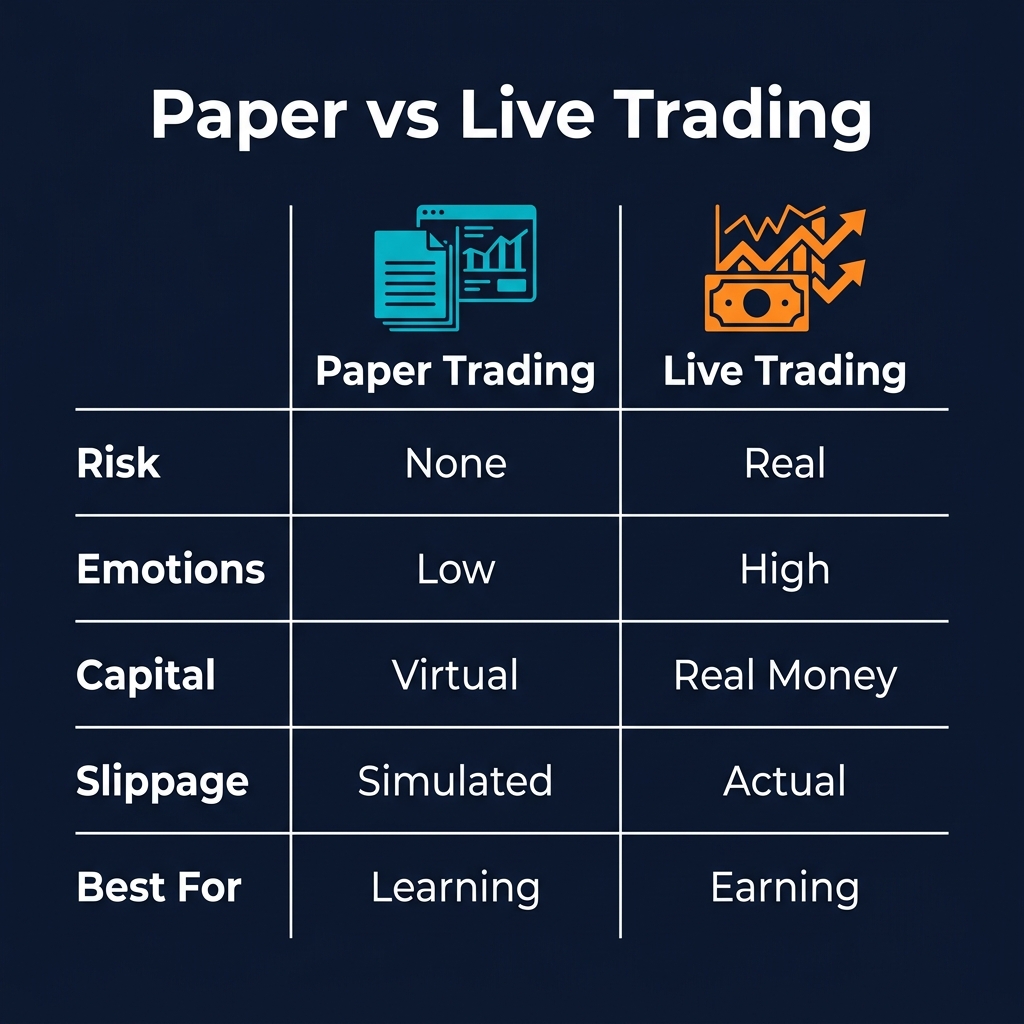
Every professional trader — from Wall Street quants to independent crypto traders — started with simulated trading. The concept is simple: trade with virtual money using real market data. You experience the full emotional and analytical process of trading without the financial consequences of mistakes.
Yet most crypto beginners skip this step entirely. They fund an exchange account, watch a few YouTube tutorials, and start trading real money. The result is predictable: 70-80% lose money within their first six months.
CoinXSight's Paper Trading engine is built to bridge this gap. It's not a simplified toy simulator — it's a production-grade trading environment that mirrors real futures trading with realistic execution, fees, slippage, and performance analytics.
Paper Trading Module Overview
CoinXSight's Paper Trading engine is located in the Backtest section of the platform sidebar. Access it at app.coinxsight.com/paper-trading.
The interface is divided into three core areas:
1. Performance Dashboard (Top)
The performance header provides an at-a-glance view of your simulated trading results:
Metric
What it tells you
Total Equity
Your current virtual portfolio value
P&L
Total profit/loss in dollars and percentage
Win Rate
Percentage of trades that were profitable
Total Trades
Complete count with wins/losses breakdown
Max Drawdown
Largest peak-to-trough decline in equity
Below the quick stats, a Detailed Performance Metrics section displays professional-grade statistics:
Sharpe Ratio — Risk-adjusted return (above 1.0 is good, above 2.0 is excellent)
Sortino Ratio — Like Sharpe but penalizes only downside volatility
Calmar Ratio — Return relative to maximum drawdown
Profit Factor — Gross profits divided by gross losses (above 1.0 means profitable)
Expectancy — Average expected profit per trade
Average Win / Average Loss — Crucial for understanding your risk/reward profile
These metrics are identical to what professional quant funds use to evaluate trading strategies. They give you an honest, statistical picture of your trading skill — not just whether you made money, but whether your approach is systematically profitable.
2. TradingView Chart (Center)
A fully interactive real-time candlestick chart powered by TradingView, featuring:
Live price data streamed from Binance
Technical indicators toggleable directly on the chart: EMA, Bollinger Bands, RSI, MACD, and Smart Money Concepts (SMC)
Visual trade management — once you open a position, your Stop Loss and Take Profit levels appear as draggable lines on the chart
The chart is the same quality as Chart Pro, giving you a professional-grade visual workspace for analysis.
3. Quick Trade Form + Positions (Right/Bottom)
The trade execution panel includes:
Asset search — switch between any supported trading pair
Long/Short selection — simulate both bullish and bearish trades
Quantity input — specify position size in the base asset
Leverage selector — choose from 1x, 2x, 5x, 10x, 20x, 50x, or set a custom multiplier
Risk management inputs — set Stop Loss, Take Profit, and Trailing Stop percentage
AI Trade Setups — embedded signals from the AI engine showing high-confidence setups on your selected timeframe
Below the trade form, two panels display:
Open Positions — real-time P&L, margin, liquidation prices, and close/modify controls
Trade History — completed trades with full execution details, exportable as CSV
Getting Started: Your First Paper Trade
Step 1: Create a Demo Account
When you first open Paper Trading, click "+ New Account" to create a virtual portfolio. You can customize:
Account name — label it for your strategy (e.g., "Swing Trading 4H", "Scalping Practice")
Starting capital — set any amount (recommended: $10,000 for realistic position sizing)
You can create multiple accounts to test different strategies independently.
Step 2: Select an Asset
Use the search field in the Quick Trade form to find your target. Start with BTC/USDT — it has the most liquidity and the most predictable behavior for beginners.
Step 3: Analyze Before Trading
Before placing any trade, check:
Chart analysis — identify the current trend, key support/resistance levels, and relevant technical indicator readings
AI Trade Setups — the embedded AI signals section shows whether the AI engine has identified any high-confidence setups on your timeframe. If it says "No high-confidence setups," consider waiting
Market context — use the sidebar to check the AI Terminal's market regime and the On-Chain module's whale activity
Step 4: Configure Your Trade
Parameter
Beginner recommendation
Direction
Follow the trend (Long in uptrend, Short in downtrend)
Quantity
Small — no more than 5% of your virtual capital per trade
Leverage
Start at 1x. Move to 2-3x only after 50+ profitable 1x trades
Stop Loss
Always set. Place at technical invalidation level
Take Profit
Set at minimum 1.5x your stop loss distance (1.5:1 R:R)
Trailing Stop
Optional. 2-3% for swing trades, 0.5-1% for day trades
Step 5: Execute and Monitor
Click "Open Long" or "Open Short" to execute. Your position appears in the Open Positions panel with real-time P&L tracking. The Stop Loss and Take Profit levels appear as interactive lines on the chart.
Important: Resist the urge to manually close trades early. Let your Stop Loss and Take Profit levels do their job. Premature exits — closing winners too early and holding losers too long — is the most common behavioral mistake.
Step 6: Review Your Results
After accumulating 20+ closed trades, analyze your Detailed Performance Metrics:
Profit Factor below 1.0? You're losing more than you're making. Either your winners are too small or your losers are too large. Adjust your R:R ratio
Max Drawdown above 20%? Your position sizing is too aggressive. Reduce to 1-2% risk per trade (see Risk Management Guide)
Sharpe Ratio below 0.5? Your returns are not compensating for the risk taken. Review your strategy selection
How Paper Trading Simulates Real Trading
CoinXSight's Paper Trading engine is designed to mirror real futures trading conditions:
Realistic Fee Structure
Every trade incurs simulated fees matching typical exchange fee structures. This prevents the common mistake of backtesting strategies that are profitable before fees but unprofitable after fees. You'll see the exact fee amount deducted in your Trade History.
Funding Rate Simulation
For leveraged positions held across funding intervals, the engine simulates funding rate charges. This teaches you the real cost of holding leveraged positions overnight — a surprise cost that catches many beginners when they transition to live trading.
Leverage and Liquidation
The engine calculates liquidation prices using the same formulas as real exchanges. If your position's margin is consumed by losses, you'll be liquidated — providing a safe lesson in leverage risk. Start with low leverage (1-3x) and observe how quickly liquidation prices narrow as leverage increases. For deeper understanding of leverage mechanics, see the Leverage Trading Guide.
Real-Time Data
All prices are streamed from Binance in real time. Your simulated trades execute at actual market prices, not historical data. This means your paper trading experience is as close to live trading as possible.
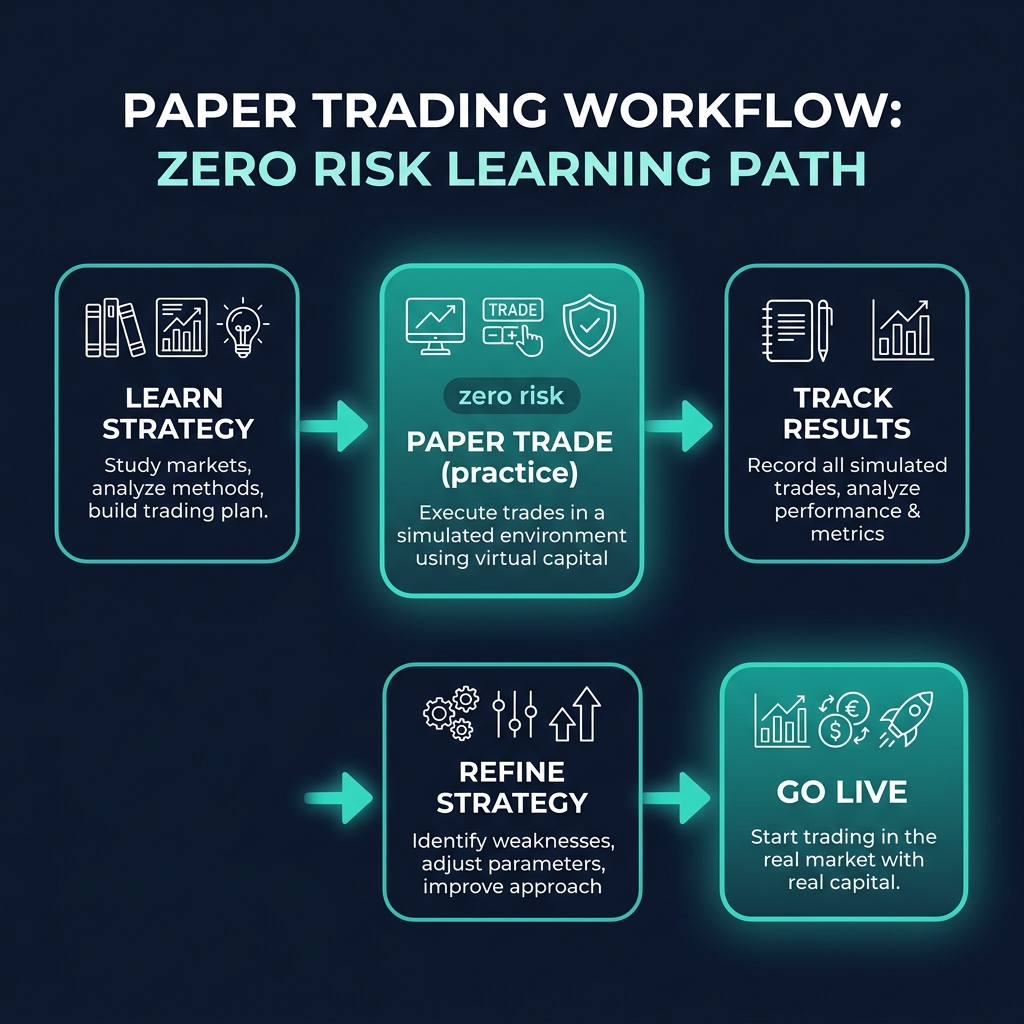
Building a Paper Trading Curriculum
Phase 1: Market Observation (Week 1-2)
Goal: Learn to read price action without trading.
Watch BTC/USDT on the 4H chart for two weeks
Toggle on EMA (20, 50, 200) and RSI indicators
Write notes (even mental ones) about what you observe:
How does price react at EMA levels?
What happens when RSI crosses above 70 or below 30?
What does a "trend" look like vs. "range-bound" action?
No trades during this phase. Observation is an underrated skill.
Phase 2: Single Indicator Trades (Week 3-4)
Goal: Learn disciplined execution with one strategy.
Introduce low leverage (2-3x) on highest-conviction setups
Review weekly: analyze Sharpe Ratio, Calmar Ratio, and Expectancy trends
Target: Sharpe Ratio above 1.0, Profit Factor above 1.2, Max Drawdown below 10%.
Phase 5: Transition Readiness (Week 13+)
You're ready to consider live trading when:
Criterion
Threshold
Total paper trades
100+
Consecutive profitable weeks
4+
Win Rate
>50%
Profit Factor
>1.2
Max Drawdown
<15%
Sharpe Ratio
>0.8
Emotional control
No revenge trades, no moved stops
Critical: Even after meeting these thresholds, start live trading with 1/4 of the position sizes you used in paper trading. Real money changes your psychology.
Using AI Signals in Paper Trading
The Quick Trade form includes an AI Trade Setups section that displays signals from CoinXSight's AI engine. These signals are the same ones shown in the Alpha Hunter module.
How to Use AI Signals
Check the timeframe. The AI evaluates setups on multiple timeframes (1H, 4H, 1D). Ensure the signal timeframe matches your trading style
Confirm with your own analysis. Never trade a signal blindly. Use the chart tools to verify the setup aligns with your technical analysis
Note when signals are absent. "No high-confidence setups" means the AI can't find a high-probability trade. This is valuable information — it tells you to wait
Tracking AI Signal Performance
Paper trading is perfect for evaluating whether AI signals improve your results:
Create two demo accounts with identical starting capital
In Account A, trade only your manual analysis
In Account B, trade only AI-confirmed setups (your analysis + AI agreement)
After 50+ trades in each, compare the Sharpe Ratios and Profit Factors
Most traders find that AI-confirmed setups have a 10-20% higher win rate than manual-only analysis.
Exporting and Reviewing Your Data
The Trade History section includes an Export CSV button. Use this to:
Build a trading journal. Import the CSV into a spreadsheet and annotate each trade with your reasoning, emotional state, and lessons learned
Identify patterns. Which assets do you trade best? Which timeframes? Which setups?
Track improvement. Compare weekly/monthly performance metrics to verify you're improving
Key Questions for Weekly Review
Which trades violated my rules? (No stop loss, excess leverage, no confluence)
What was my average hold time? (Am I cutting winners short?)
How did my AI-confirmed trades compare to manual-only trades?
Did I revenge trade after any loss?
What is my win rate trend over the last 4 weeks?
Common Paper Trading Mistakes
Mistake 1: Trading Unrealistic Sizes
Paper trading with $1,000,000 virtual capital doesn't teach you anything useful if you'll trade with $5,000 in real life. Set your demo account to match your planned live capital.
Mistake 2: Ignoring Losses
"It's just fake money" leads to sloppy risk management. Treat every virtual dollar as real. If you can't manage virtual money with discipline, you won't manage real money with discipline.
Mistake 3: Skipping the Review
The most valuable part of paper trading isn't the trading itself — it's the analysis afterward. Without reviewing your Detailed Performance Metrics and trade history, you're just gambling with different colored chips.
Mistake 4: Transitioning Too Early
Two profitable weeks is not enough data. You need 100+ trades across different market conditions (trending, ranging, volatile) to have statistical confidence in your system.
Mistake 5: Not Using Risk Management Tools
Always set Stop Loss and Take Profit levels. The Paper Trading engine supports these precisely because they're essential practice. A paper trade without a stop loss teaches you nothing except bad habits.
Summary
CoinXSight's Paper Trading engine is a professional-grade simulated trading environment built on real-time Binance data. It includes realistic fees, funding rates, leverage mechanics, and liquidation — providing an authentic trading experience without financial risk.
The key principles:
Treat paper trading as a 12-week structured curriculum, not casual experimentation
Use the Detailed Performance Metrics (Sharpe Ratio, Profit Factor, Max Drawdown) to objectively measure your skill
Leverage the AI Trade Setups feature to learn how AI confluence scoring improves trade selection
Export and review your trade history weekly to identify patterns and track improvement
Don't transition to live trading until you meet the readiness criteria across 100+ trades
Paper trading isn't a step to skip — it's the foundation that separates the 20% who profit from the 80% who don't.
Master risk management for crypto trading. Learn position sizing formulas, stop-loss strategies, and how CoinXSight's Portfolio module tracks your risk…