Market Structure Guide: How to Read BOS and CHoCH for Crypto Trend Analysis
Master market structure analysis for crypto. Learn Break of Structure (BOS), Change of Character (CHoCH), swing points, and how CoinXSight automates structure tracking.
MC
Marcus ChenSenior Quantitative Strategist·May 16, 2026 · 9 min read · Updated Oct 6
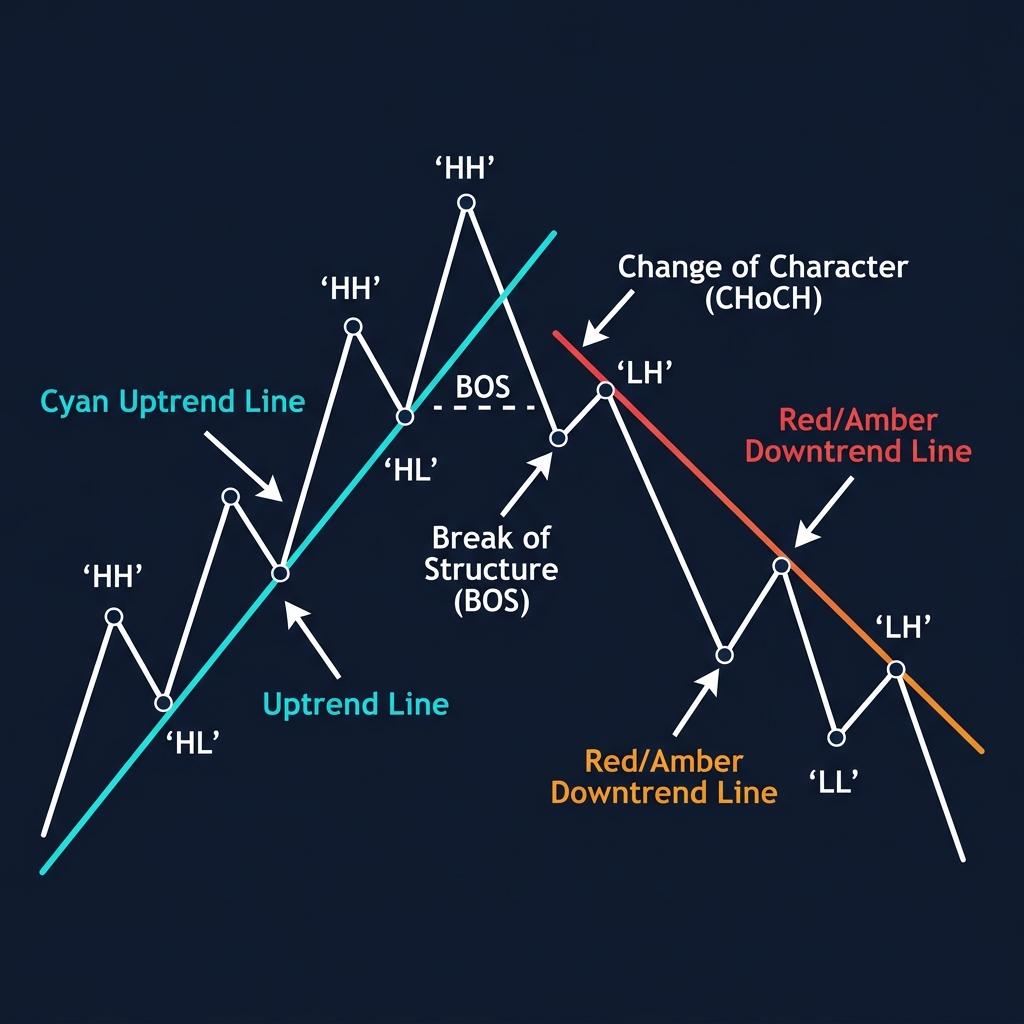
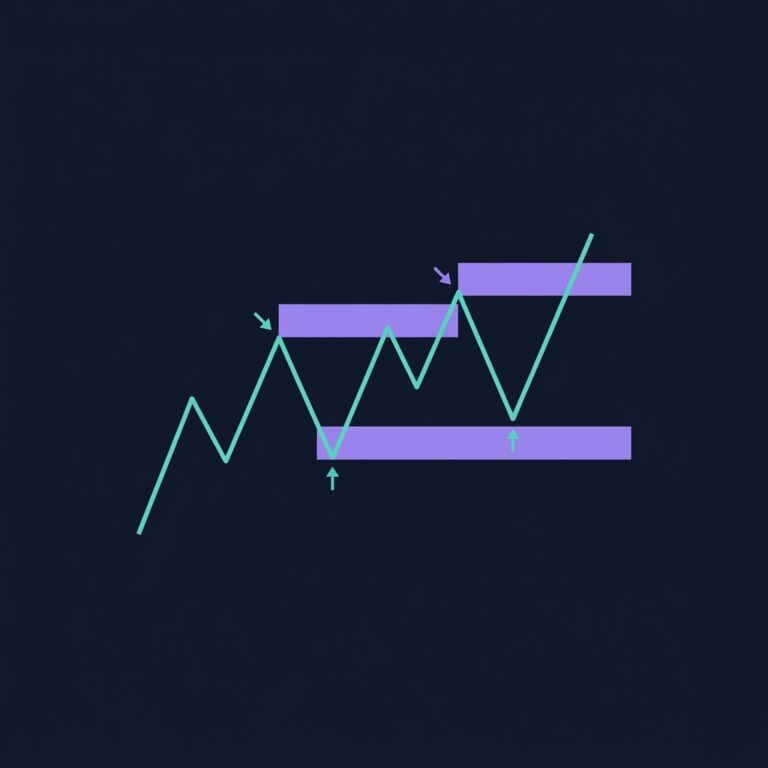
Market structure is the framework that describes how price moves in waves — creating a sequence of highs and lows that define whether a market is trending upward, trending downward, or moving sideways. It is the most fundamental concept in Smart Money Concepts (SMC) because every other SMC tool — Order Blocks, Fair Value Gaps, liquidity sweeps — is interpreted within the context of the current market structure.
In plain terms: Market structure answers the question, "Who is in control — buyers or sellers?" An uptrend (buyers in control) produces a series of higher highs and higher lows. A downtrend (sellers in control) produces lower lows and lower highs. When the pattern breaks, control is shifting.
💡 On CoinXSight, market structure is analyzed automatically by the platform's SMC engine and the results are surfaced across multiple modules — Deep Alpha labels the current structure (Uptrend, Downtrend, Ranging) and flags BOS/CHoCH events, Chart Pro marks swing points visually on the chart, and Discovery uses structure data for signal triage.
The Building Blocks: Swing Highs and Swing Lows
Market structure is built from swing points — the peaks and valleys of price movement.
Swing High: A candle (or group of candles) whose high is higher than the candles immediately before and after it. This represents a local peak where buyers temporarily lost control.
Swing Low: A candle (or group of candles) whose low is lower than the candles immediately before and after it. This represents a local valley where sellers temporarily exhausted.
The sequence of swing points defines the structure:
Structure
Swing Highs
Swing Lows
Meaning
Uptrend
Higher Highs (HH)
Higher Lows (HL)
Buyers are consistently pushing higher
Downtrend
Lower Highs (LH)
Lower Lows (LL)
Sellers are consistently pushing lower
Range
Equal Highs (EH)
Equal Lows (EL)
Neither side has control
Break of Structure (BOS) — Trend Continuation
A Break of Structure (BOS) occurs when price breaks beyond the most recent swing point in the direction of the existing trend, confirming that the trend continues.
Bullish BOS:
Uptrend in progress:
  Swing Low → Swing High ($100) → Higher Low → Price breaks above $100
  ← This break above the previous high is a Bullish BOS
  ← The uptrend is confirmed to continue
Bearish BOS:
Downtrend in progress:
  Swing High → Swing Low ($80) → Lower High → Price breaks below $80
  ← This break below the previous low is a Bearish BOS
  ← The downtrend is confirmed to continue
What BOS tells you: The dominant trend is intact. Continue trading in the trend direction. Do not fight it.
BOS on CoinXSight: Deep Alpha labels BOS events with directional tags — "Bullish BOS at $X" or "Bearish BOS at $X." Chart Pro marks BOS points with visual annotations on the candlestick chart.
Change of Character (CHoCH) — Trend Reversal Warning
A Change of Character (CHoCH) is the first break of structure in the opposite direction. This is the earliest warning sign that the current trend may be ending.
Bullish CHoCH (potential reversal from downtrend to uptrend):
Downtrend in progress: Lower Highs, Lower Lows
  Last Lower High was at $90
  → Price breaks ABOVE $90
  ← This is a Bullish CHoCH
  ← The downtrend's pattern of lower highs is broken
  ← Buyers may be taking control
Bearish CHoCH (potential reversal from uptrend to downtrend):
Uptrend in progress: Higher Highs, Higher Lows
  Last Higher Low was at $75
  → Price breaks BELOW $75
  ← This is a Bearish CHoCH
  ← The uptrend's pattern of higher lows is broken
  ← Sellers may be taking control
The critical difference between BOS and CHoCH:
BOS = trend continues (same direction)
CHoCH = trend may be reversing (opposite direction)
Event
Direction
Signal
Action
Bullish BOS
With the uptrend
Continuation — buy dips
Hold longs, add on pullbacks
Bearish BOS
With the downtrend
Continuation — sell rallies
Hold shorts, add on rallies
Bullish CHoCH
Against the downtrend
Potential reversal upward
Watch for confirmation, prepare longs
Bearish CHoCH
Against the uptrend
Potential reversal downward
Tighten stops, prepare to exit longs
⚠️ Limitation: A single CHoCH is a warning, not a confirmed reversal. Approximately 40% of CHoCH events are "false alarms" — price breaks the swing point briefly but the original trend resumes. Always wait for a confirming BOS in the new direction before fully committing to the reversal thesis. CoinXSight's Confluence Score helps: if the CHoCH aligns with oversold RSI, an Order Block, and whale accumulation (7+/10), the reversal probability increases significantly.
Real-World Scenario: ETH Market Structure Shift on CoinXSight
Scenario — ETH, March 2026, daily chart:
From February 1 to March 15, 2026, ETH was in a clear downtrend — producing a series of lower highs ($3,800 → $3,600 → $3,400) and lower lows ($3,200 → $3,000 → $2,850).
The CHoCH:
On March 18, ETH rallied from $2,900 and broke above $3,400 — the most recent lower high. CoinXSight's Deep Alpha flagged this as a Bullish CHoCH. This was the first time ETH broke a lower high in 6 weeks.
What CoinXSight showed at the CHoCH:
Deep Alpha — SMC Panel:
"Bullish CHoCH at $3,400" — structure shift flagged
Bullish Order Block at $3,050-$3,150 (unmitigated)
RSI: 58 (recovering from deeply oversold territory)
On-Chain:
Whale wallets accumulated 42,000 ETH over the preceding 5 days
Exchange reserves dropped by $28M — consistent with institutional accumulation
The confirming BOS:
On March 24, ETH broke above $3,600 — the next lower high in the sequence — producing a Bullish BOS. The trend reversal was confirmed. ETH rallied to $4,100 over the following 3 weeks.
Market Structure Across Timeframes
Higher timeframes dominate lower timeframes. A daily uptrend supersedes a 4H downtrend.
Timeframe
Structure Role
Example
Weekly
Macro trend — the "final word"
If weekly is bullish, daily pullbacks are buying opportunities
Daily
Primary trend — most reliable signals
BOS/CHoCH on daily defines the trading bias
4H
Swing trading execution
Use 4H structure for entry timing within daily trend
1H
Intraday fine-tuning
Only relevant if aligned with 4H and daily
Rule of thumb: Always check market structure on at least 2 timeframes — one for the macro trend (daily or weekly) and one for the entry (4H or 1H). CoinXSight's Deep Alpha module shows structure status that factors in multiple timeframes.
Common Market Structure Mistakes
Trading CHoCH without BOS confirmation: A CHoCH is a warning signal, not an entry signal. Wait for the confirming BOS in the new direction before fully committing. Entering on CHoCH alone has a ~60% success rate; entering on CHoCH + BOS has a ~75% rate.
Ignoring the higher timeframe: A Bullish CHoCH on the 1H chart means little if the daily chart shows a strong downtrend with no CHoCH. Higher timeframes override lower timeframes.
Over-marking swing points: Not every local peak or valley qualifies as a swing point. Use clear, significant highs and lows that are visible without zooming in. If you need to zoom into a 5-minute chart to see it, it is not a meaningful swing point.
Confusing BOS with CHoCH: BOS goes with the existing trend (continuation). CHoCH goes against it (reversal). Mixing them up leads to trading in the wrong direction.
How to Read Market Structure on CoinXSight — Multi-Module Workflow
Reading market structure manually takes years of screen time. The biggest advantage of using an automated system is consistency — the engine marks every BOS and CHoCH without the bias that comes from wanting a trade to work. Here is how I use CoinXSight's structure labels in practice.
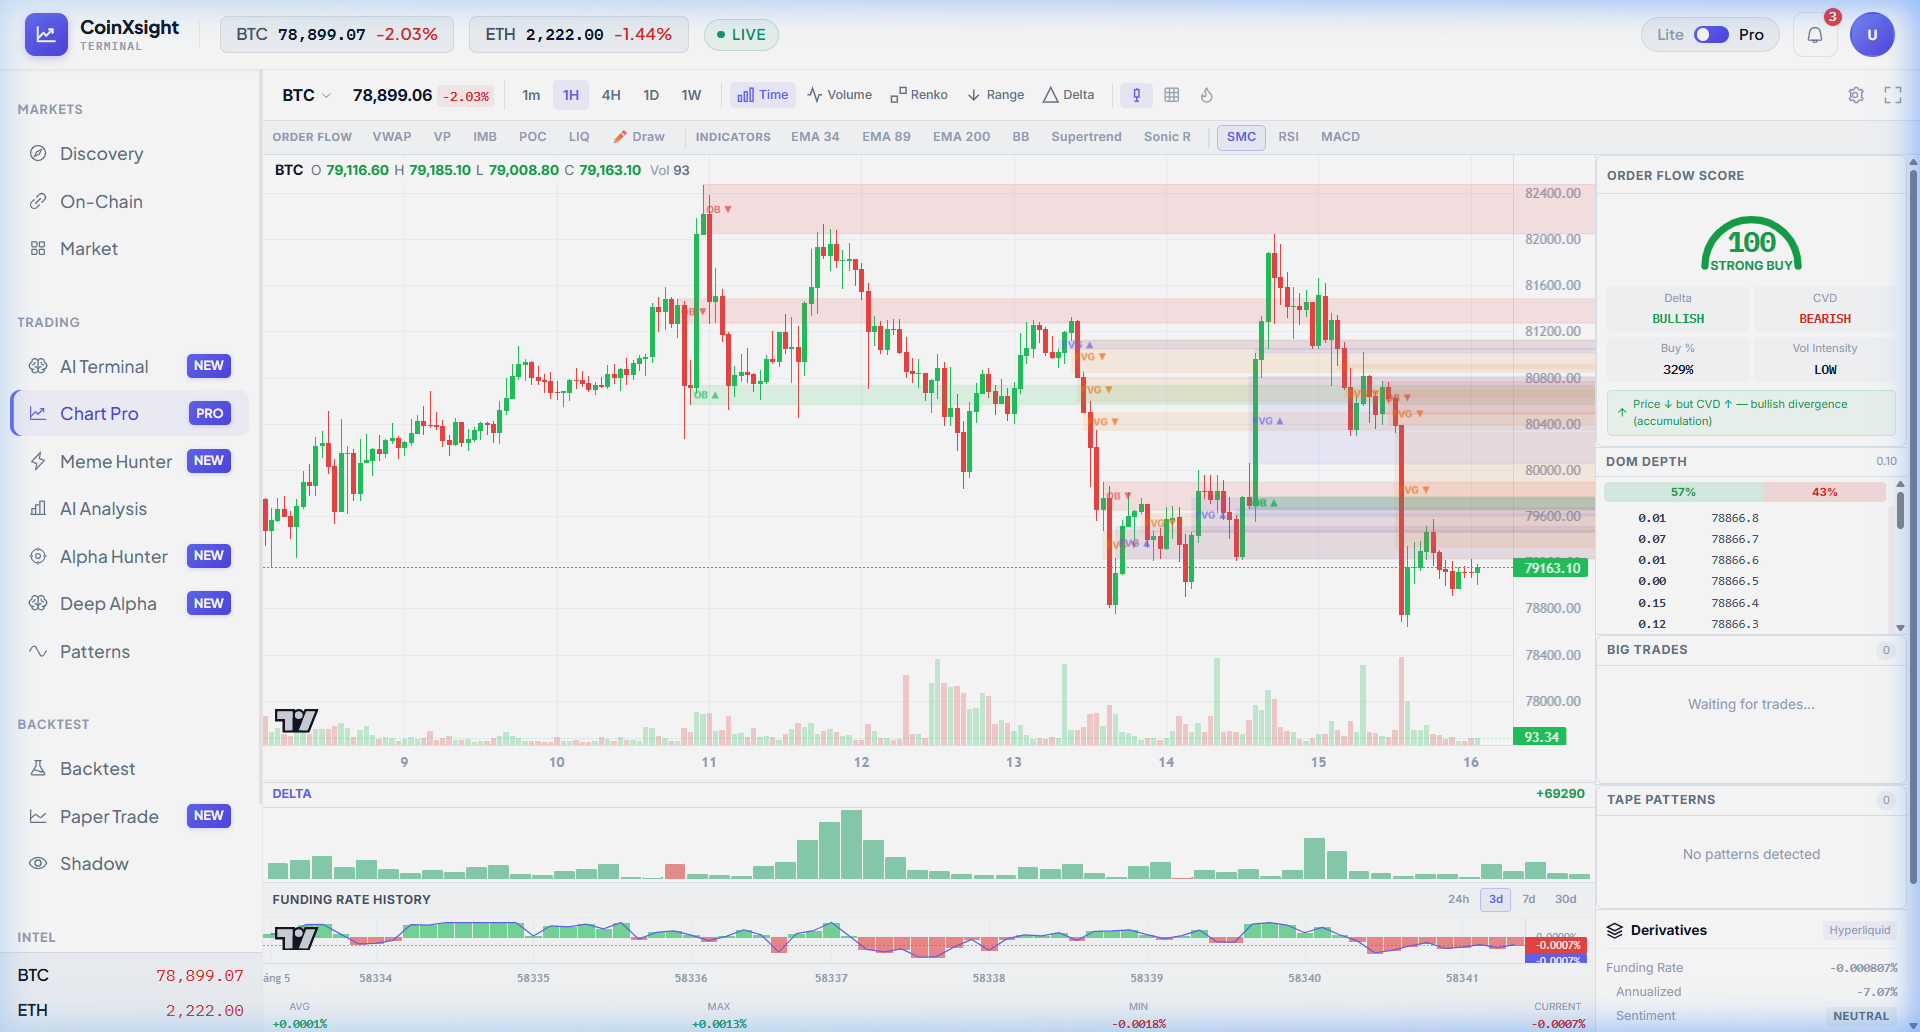
Open Chart Pro → toggle SMC from the indicator toolbar. The chart annotates swing points with "BOS" (Break of Structure) and "CHoCH" labels automatically. In the screenshot below, BTC 1H shows the structural story clearly:
There is a bearish BOS visible below $80,000 where price broke the previous swing low — confirming the downtrend continuation.
Multiple OB ▼ (bearish Order Block) labels at $81,500-$82,400 show where selling pressure originated. These are the swing highs that define the bearish structure.
The OB ▲ (bullish Order Block) at $79,800-$80,200 marks a potential structure reversal zone. If price breaks above the most recent OB ▼ (lower high), that would be a Bullish CHoCH.
What I specifically check: is the sequence intact? Lower highs → lower lows = downtrend. The moment a "lower high" gets broken, the sequence breaks and a CHoCH is in play. Right now, the last lower high is at ~$82,400 (the OB ▼ zone). Until price breaks above that, the bearish structure holds.
Navigate to Deep Alpha → search BTC. The header row explicitly states Trend: BEARISH and MTF Alignment: MOSTLY_BEARISH. This confirms the Chart Pro structure reading across multiple timeframes — the 1H bearish structure is not just a local pattern, it aligns with the 4H. The Confluence reads PARTIAL because while the structure is bearish, some indicators (like ASI 70 BUY) are showing early accumulation. This is the classic pre-CHoCH phase: structure is still bearish but underlying metrics are starting to shift.
Step 3: Check if structure shift has institutional backing on On-Chain
A CHoCH without institutional backing usually fails. Navigate to On-Chain → check Exchange Flows. The current reading shows +$32.8M inflow — tokens moving TO exchanges, which means selling. For a Bullish CHoCH to be credible, I need to see this flip to net outflows (accumulation). Until Exchange Flows turn negative and whale transactions show BTC accumulation, the bearish structure has no reason to reverse. The Whale Transactions table shows GALA and SIDUS activity but no meaningful BTC whale buys — further confirming the bearish structure is intact.
Frequently Asked Questions
What is the difference between BOS and CHoCH?
BOS (Break of Structure) confirms the existing trend continues — price breaks the most recent swing point in the trend direction. CHoCH (Change of Character) signals a potential trend reversal — price breaks a swing point in the opposite direction. BOS = same direction, CHoCH = opposite direction.
How many CHoCH signals should I wait for before trading a reversal?
One CHoCH is a warning. Wait for at least one confirming BOS in the new direction before fully committing. Some traders wait for CHoCH + the first higher low (for bullish reversals) to form before entering. CoinXSight's Confluence Score helps filter: a CHoCH with a score of 7+/10 has higher reliability.
Does market structure work on all timeframes?
Market structure exists on all timeframes, but reliability increases with higher timeframes. Daily and 4H structure produces the most actionable signals for swing trading. 1H structure is useful for entry timing within a higher-timeframe setup. Below 1H, structure breaks happen too frequently to be meaningful.
Can market structure be automated?
CoinXSight's SMC engine automates market structure analysis — it tracks swing highs, swing lows, BOS, and CHoCH events across relevant timeframes. This removes the subjectivity of manual structure marking. However, interpreting whether a CHoCH will lead to a full reversal still requires multi-factor analysis (Confluence Score).
What happens when different timeframes show conflicting structure?
Higher timeframes always take priority. If the daily chart shows an uptrend with no CHoCH, but the 4H chart shows a Bearish CHoCH, the 4H move is likely a pullback within the daily uptrend, not a macro reversal. Trade in the direction of the highest timeframe structure.