Every crypto trader eventually runs into the same fork in the road: should you study charts and indicators, or dig into tokenomics and on-chain data? The technical analysis vs fundamental analysis crypto debate has raged for decades in traditional markets — but in crypto, the answer is surprisingly clear.
The best traders in 2026 don't choose sides. They use both.
Technical analysis (TA) tells you when to act. Fundamental analysis (FA) tells you what to act on. Treat them as competing religions and you'll always be half-blind. Combine them into a single workflow and you'll make decisions that most traders simply can't.
This guide breaks down both approaches honestly — what each does well, where each fails, and exactly how to merge them into a practical hybrid framework you can start using today. Whether you're day-trading BTC around $105,000 or building a long-term altcoin portfolio, the TA vs FA crypto question deserves a nuanced answer.
What Is Technical Analysis?
Technical analysis studies price behavior — past and present — to forecast where price is likely to go next. The core assumption is simple: everything that matters (news, sentiment, fundamentals, whale activity) is already reflected in the chart.
Price action: Raw candlestick analysis, order flow, and market structure reading that requires no indicators at all.
Where TA Shines
Technical analysis excels at one thing above all else: timing. It answers questions like:
Is now a good entry, or should I wait for a pullback?
Where should I set my stop-loss?
What's a realistic profit target for this trade?
Is momentum fading, or just getting started?
For a trader looking at BTC sitting at $105,000 and wondering whether to buy, TA provides concrete, actionable answers based on what price is doing right now. Our 2026 crypto technical analysis guide covers the full modern toolkit.
Where TA Falls Short
Technical analysis cannot tell you whether a project is worth owning in the first place. A coin can have a picture-perfect bullish chart setup and still collapse to zero if the team abandons the project, a critical exploit is discovered, or token unlocks flood the market with supply. TA reads the scoreboard — it doesn't evaluate the players.
What Is Fundamental Analysis in Crypto?
Fundamental analysis evaluates the intrinsic value of an asset by studying everything that isn't the price chart. In traditional stocks, that means earnings reports, P/E ratios, and management quality. In crypto, it's a completely different game.
There is no earnings call for Ethereum. There's no quarterly revenue report for Solana (at least not in the traditional sense). Crypto fundamental analysis has evolved its own language, its own metrics, and its own frameworks — and in 2026, these tools are more powerful and accessible than ever.
Tokenomics: The Supply Side
Tokenomics is the study of a token's economic design — and it's arguably the most important fundamental factor in crypto. Here's what to examine:
Tokenomics Factor
What to Look For
Red Flag
Total supply
Fixed (like BTC's 21M) vs. inflationary
Unlimited supply with no burn mechanism
Circulating supply
How much is actually tradeable today
Less than 20% of total supply circulating
Inflation rate
Annual new token issuance
>10% annual inflation with no demand offset
Vesting schedule
When team/investor tokens unlock
Large cliff unlocks approaching within 30 days
Burn mechanism
Does the protocol permanently destroy tokens?
No deflationary pressure in a high-supply token
A coin can have the most bullish chart in the world, but if 40% of the supply unlocks next month, those gains are built on sand. For more on trading around these events, see our token unlock trading strategy guide.
On-Chain Metrics: Crypto's Unique Edge
This is where crypto FA gets genuinely exciting — and where it diverges most from traditional markets. Because blockchains are public, you can see exactly what's happening inside a network in real time. No waiting for quarterly reports. No trusting management's spin.
Key on-chain metrics include:
NVT Ratio (Network Value to Transactions): The crypto equivalent of P/E ratio. A high NVT means the network's valuation is outpacing its actual usage — potentially overvalued. A low NVT suggests the network is undervalued relative to its transaction volume.
MVRV (Market Value to Realized Value): Compares the current market cap to the aggregate cost basis of all holders. MVRV above 3.5 historically signals overheated markets; below 1.0 signals deep value.
Active addresses: How many unique wallets are transacting daily. Rising active addresses = growing adoption. Falling active addresses while price rises = divergence worth watching.
Developer activity: GitHub commits, active developers, and repository activity. A project with declining developer count is a project losing its future.
In 2026, the best crypto projects generate real revenue — and you can measure it:
Total Value Locked (TVL): For DeFi protocols, TVL represents the capital users have deposited. It's a direct measure of trust and utility.
Protocol revenue: Fees generated by the protocol. Ethereum generates billions annually. Compare revenue growth quarter-over-quarter.
Fee generation vs. token emissions: Is the protocol earning more in fees than it's paying out in token rewards? If not, it's subsidizing growth with inflation.
User growth: Daily active users, new wallet creation, transaction count trends. Sustainable growth should show steady upward trends, not spikes followed by cliffs.
Team, Ecosystem, and Competitive Moat
Some fundamentals are qualitative rather than quantitative:
Funding and treasury: How much runway does the project have? A project with a $500M treasury can survive a two-year bear market. A project with $2M cannot.
Partnerships and integrations: Real partnerships (with live integrations) vs. press-release partnerships (announcements with no follow-through).
Competitive positioning: Is this the only project solving a specific problem, or is it the 47th Layer-2 with no differentiation?
Macro Fundamentals
The crypto market in 2026 is deeply connected to macro forces:
Regulatory environment: ETF approvals, stablecoin legislation, and exchange regulations all move markets. The wave of spot ETF approvals in 2024-2025 permanently changed crypto's investor base.
ETF flows: Institutional inflows and outflows through Bitcoin and Ethereum ETFs now represent a significant portion of market demand. Tracking these flows is essential FA.
Institutional adoption: Corporate treasury allocations, bank custody services, and pension fund exposure all signal long-term demand shifts.
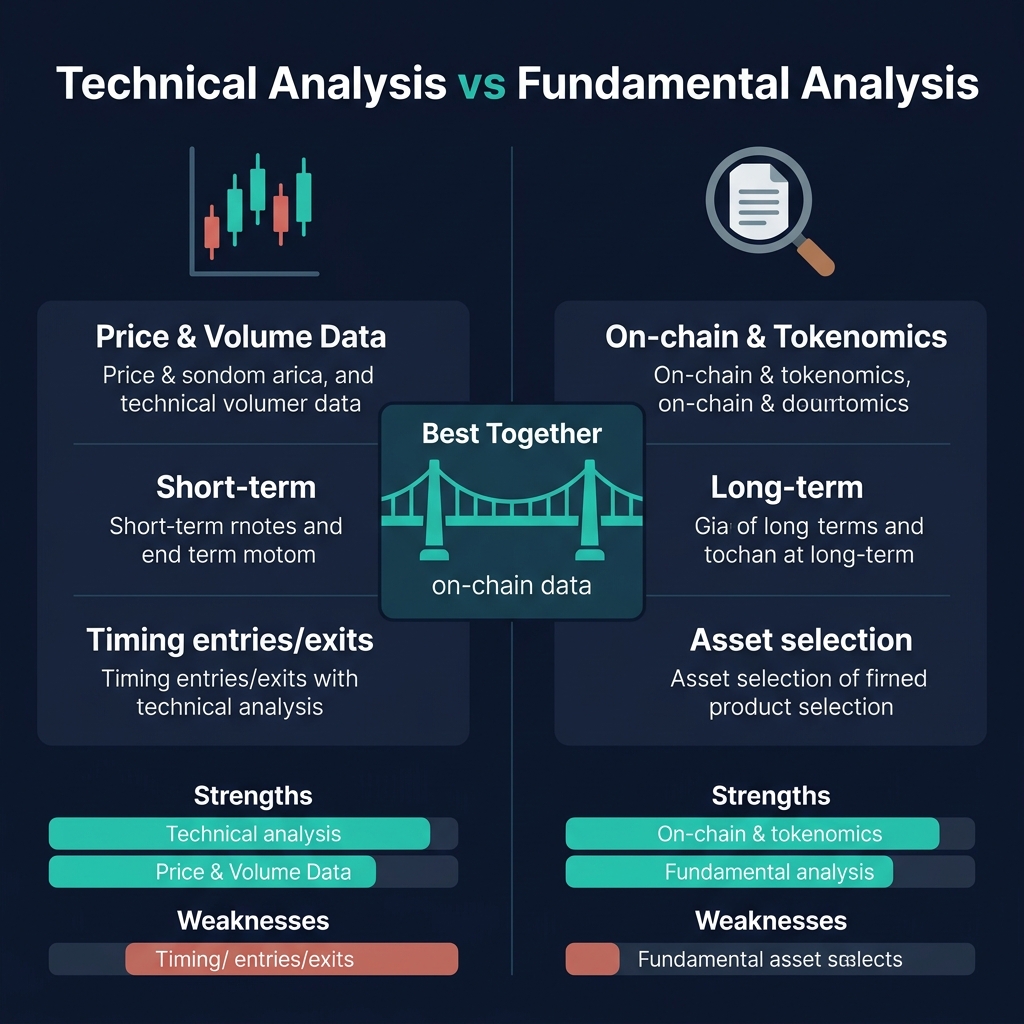
Head-to-Head Comparison: TA vs FA in Crypto
Here's the honest, side-by-side breakdown of how technical analysis vs fundamental analysis crypto approaches stack up:
Dimension
Technical Analysis
Fundamental Analysis
Time horizon
Minutes to weeks (best for short/medium-term)
Weeks to years (best for long-term positioning)
Data sources
Price charts, volume, order books, indicators
Tokenomics, on-chain data, protocol metrics, news
Learning curve
Moderate — patterns and indicators can be learned in weeks
Steep — requires understanding crypto economics, blockchain mechanics, and macro
Works best for
Timing entries and exits, risk management, swing/day trading
Strong for short-term price direction (hours to days)
Strong for medium/long-term value appreciation (months to years)
Reaction speed
Immediate — reacts to price changes in real time
Slower — fundamentals shift gradually, often over weeks
Works in bear markets
Yes — can trade both directions, profit from shorts and range-bound setups
Partially — good for identifying accumulation zones, but timing is vague
Risk of false signals
High (30-40% of pattern breakouts fail)
Lower for long-term, but "value traps" exist in crypto too
Neither approach is universally superior. The right question isn't "which is better?" — it's "which is better for this specific decision?"
When Technical Analysis Wins
There are scenarios where TA is clearly the superior tool. Here are the most important ones, with real 2026 examples.
1. Short-Term Trading (Intraday and Swing)
If your holding period is hours to days, fundamental analysis is almost irrelevant. Tokenomics don't change hour to hour. TVL doesn't move enough in a single trading session to matter. But price action, volume, and momentum indicators change constantly.
Example workflow for a 4-hour BTC swing trade:
Check the 4H EMA ribbon — are the 9, 21, and 55 EMAs stacked bullish?
Confirm with RSI — is it above 50 but below 70 (room to run)?
Set stop-loss below the recent swing low (1-2% risk)
Target the next resistance level for a 2:1 or better reward-to-risk ratio
No amount of fundamental analysis can replicate this precision for short-term trades.
2. Timing Entries on Fundamentally Strong Coins
Even if you've done deep FA research and concluded that ETH at $2,800 is a long-term buy, TA can save you 5-15% by timing your entry properly. Why buy at $2,800 if the 4H chart shows an RSI divergence suggesting a pullback to $2,650 is likely?
The difference between a good investment and a great one is often the entry price — and that's TA's domain.
3. Sideways and Bear Market Trading
When the entire market is consolidating or declining, fundamental analysis struggles. A project can have perfect fundamentals and still bleed 40% because macro conditions are hostile. TA provides actionable setups even in ugly markets:
Short setups on breakdowns with trend-following confirmation
Volume profile analysis to identify high-probability reversal zones
4. The March 2026 BTC Pullback: A TA Victory
In early March 2026, BTC was trading near $108,000 and crypto Twitter was overwhelmingly bullish. Fundamentals supported the thesis — ETF inflows were strong, on-chain metrics looked healthy, and institutional adoption was accelerating.
But the charts told a different story:
Daily RSI had formed a clear bearish divergence — price was making higher highs while RSI made lower highs
Volume was declining on each successive push higher (distribution pattern)
The 4H MACD had crossed bearish and was accelerating to the downside
A rising wedge pattern on the daily chart was reaching its apex
Traders who relied solely on fundamentals held through the pullback. Those who combined their bullish FA conviction with TA awareness either reduced position size, tightened stops, or waited for the dip — and bought BTC closer to $99,000 before it recovered.
Fundamentals told you to be bullish on BTC. Technicals told you not yet.
When Fundamental Analysis Wins
FA has its own moments of clear superiority — especially for decisions that TA simply cannot inform.
1. Long-Term Portfolio Construction
If you're building a crypto portfolio with a 1-3 year time horizon, FA is your primary weapon. No indicator can tell you whether a project will still exist in two years. But fundamental analysis can:
A practical FA portfolio screening checklist:
[ ] Circulating supply > 50% of total supply (lower dilution risk)
[ ] Active developer count growing or stable quarter-over-quarter
[ ] Protocol generating real revenue (not just token emissions)
[ ] Token has a clear utility within its ecosystem
[ ] Vesting schedule doesn't have major cliffs in the next 6 months
[ ] Team has shipped consistently over the past 12 months
[ ] TVL or user metrics showing organic growth (not incentive-driven spikes)
Coins that pass this checklist are your "tradeable universe." TA then tells you when to buy them.
2. Identifying Undervalued Altcoins Before Breakout
The biggest gains in crypto come from buying fundamentally strong projects before the crowd discovers them. TA can't identify these opportunities — by definition, there's no chart pattern to analyze if price hasn't moved yet.
What to look for:
NVT ratio significantly below historical average (undervalued relative to usage)
Rising developer activity and protocol upgrades in the pipeline
Growing user base that hasn't yet been reflected in price
Strong tokenomics with upcoming catalysts (fee switches, burns, staking yields)
3. Avoiding Rug Pulls and Dying Projects
This is perhaps FA's most important function: keeping you out of disasters. A coin can have a perfect technical setup — clean breakout, strong volume, bullish momentum — and still be a trap if:
The team is anonymous with no track record
80% of supply is locked in wallets controlled by insiders
The protocol has no real users (ghost chain with wash trading)
There's no revenue model and the treasury is depleting rapidly
Smart contract hasn't been audited, or the audit revealed critical issues
TA cannot detect any of these risks. FA can.
4. Solana's 2026 Rally: An FA Victory
Solana's rally in early 2026 — from around $130 to $170+ — was one of the clearest examples of fundamentals leading price. Months before the breakout, the fundamental picture was improving dramatically:
TVL grew steadily from $8B to $12B+ as DeFi protocols on Solana attracted real capital
Daily active addresses reached new all-time highs, surpassing 2M unique wallets
Developer count increased 35% year-over-year, making Solana the second-most-active development ecosystem
Fee revenue tripled as network activity surged — this was organic demand, not subsidized growth
Institutional interest grew with multiple Solana-focused products launching from traditional finance firms
Traders who tracked these fundamental shifts accumulated SOL between $125-$140, well before the breakout triggered obvious technical signals. By the time TA confirmed the uptrend with a clean break above the $155 resistance, much of the easy money had already been made.
Fundamentals told you Solana was undervalued. Technicals confirmed it — but later.
The Hybrid Framework: Combining TA and FA
The most effective approach in 2026 isn't choosing between technical analysis vs fundamental analysis in crypto — it's building a systematic workflow that leverages both. Here's how.
The Core Principle
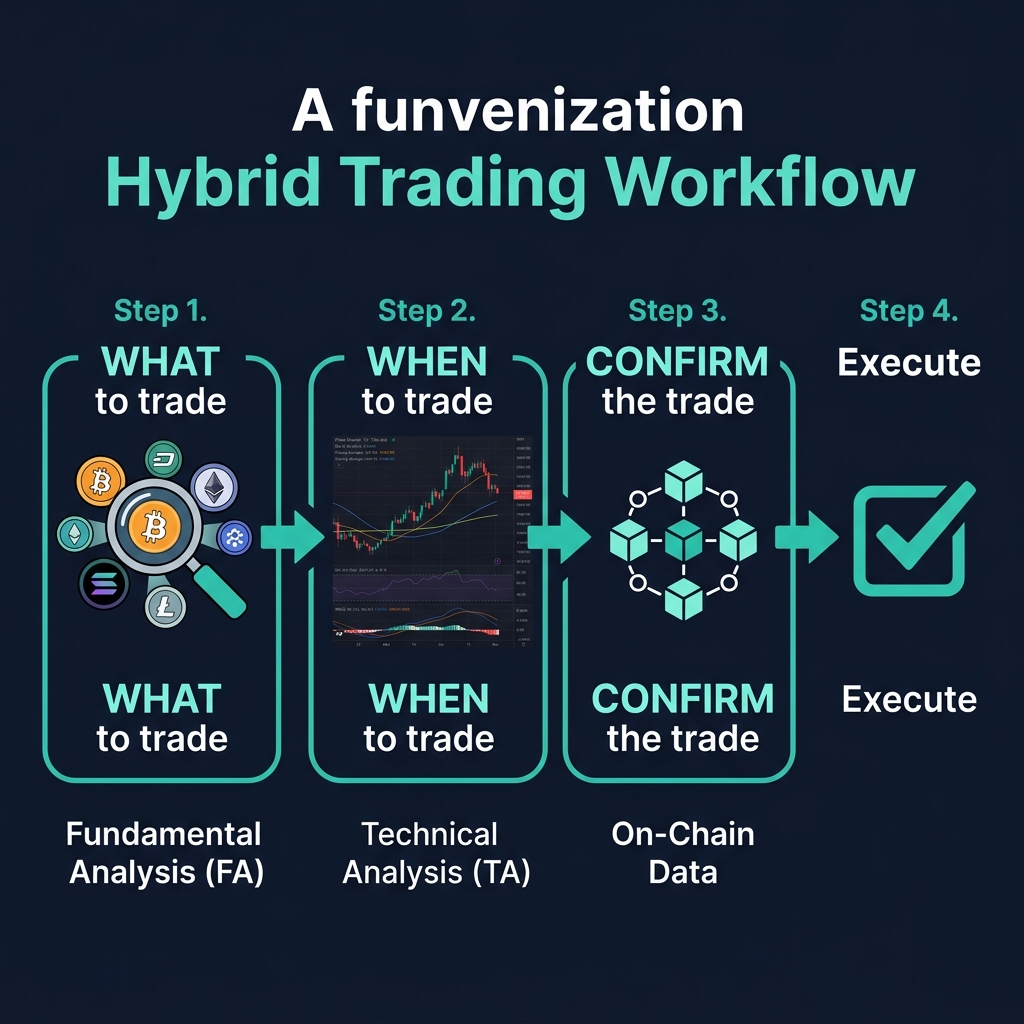
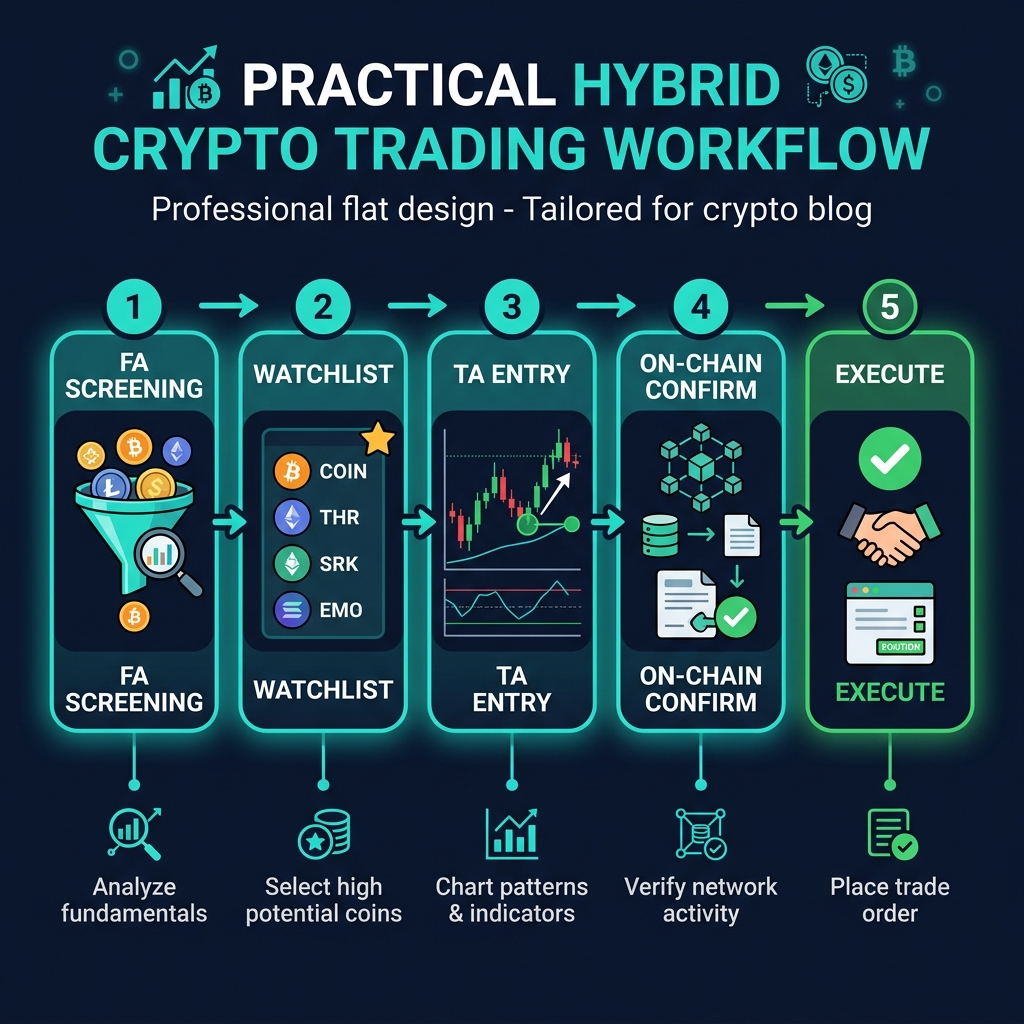
Use FA to decide WHAT to trade. Use TA to decide WHEN to trade it.
This simple division of labor eliminates the biggest weakness of each approach:
FA alone leaves you with terrible timing (buying ETH at $2,800 when a 10% dip is imminent)
TA alone leaves you trading garbage coins with pretty charts (buying a clean breakout on a dead project)
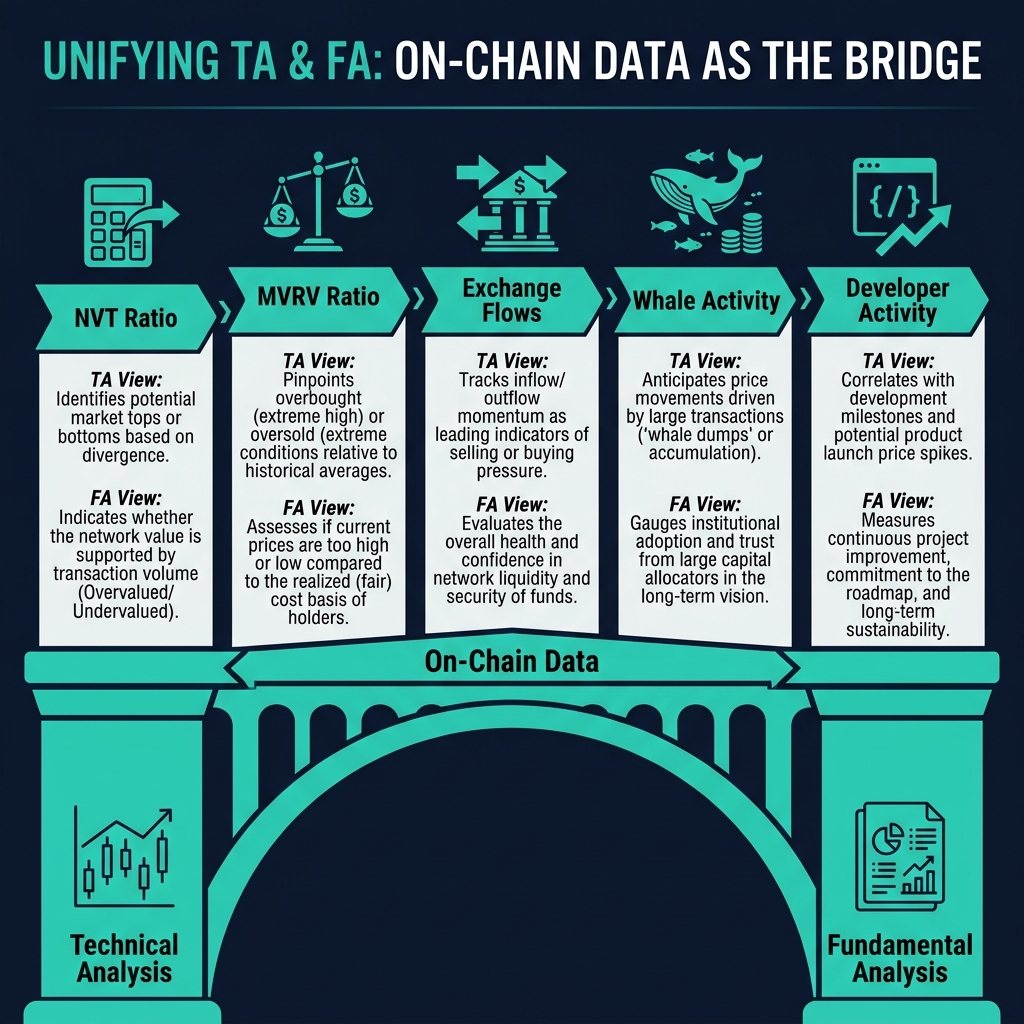
On-Chain Data: The Bridge Between TA and FA
On-chain metrics occupy a fascinating middle ground — they're fundamental data that updates in real time, making them useful for both long-term evaluation and short-term trading signals.
Consider these on-chain signals that blend both worlds:
This is exactly the problem CoinXSight's ASI Score was designed to solve. The ASI (Alpha Signal Index) combines:
Technical signals: Trend strength, momentum, volatility, and pattern recognition across multiple timeframes
On-chain data: Whale activity, exchange flows, holder distribution shifts, and network health metrics
Volume analysis: Real volume assessment filtered for wash trading and anomalous activity
The result is a single composite score that reflects both the fundamental health and the technical timing of any given asset. Rather than choosing between TA and FA, the ASI Score synthesizes them — giving you a signal that accounts for both what is happening on-chain and when it's showing up in price action.
Here's a step-by-step process you can implement today:
Step 1: Fundamental Screening (Weekly — 30 minutes)
Build your watchlist based on fundamental quality. Screen for:
Active development (GitHub activity, recent protocol upgrades)
Growing usage metrics (TVL, active addresses, transaction volume)
Healthy tokenomics (reasonable inflation, no imminent large unlocks)
Real revenue generation or clear path to sustainability
Use CoinXSight's Discovery scanner to filter by on-chain and fundamental criteria. Aim for a focused watchlist of 8-15 coins that pass your fundamental bar.
Step 2: Technical Entry (Daily — 15 minutes per coin)
For each coin on your fundamentally-approved watchlist, check the charts:
Only enter when both FA and TA agree. If fundamentals are strong but technicals are bearish, wait. If technicals are bullish but fundamentals are weak, skip it.
Monitor FA for thesis-breaking changes (team departure, exploit, regulatory action)
Watch on-chain metrics for shifts in whale behavior or exchange flows
Reassess weekly: has anything changed that invalidates your original thesis?
Hybrid Framework Decision Matrix
Not sure which analysis type to prioritize? Use this quick reference:
Your Situation
Lead With
Support With
Day trading / scalping
TA (100%)
Not applicable — FA is too slow
Swing trading (2-14 days)
TA (70%)
FA (30%) — confirm project quality
Position trading (1-3 months)
Equal: TA (50%) + FA (50%)
On-chain confirmation critical
Long-term investing (6+ months)
FA (70%)
TA (30%) — time your entries
Portfolio rebalancing
FA (80%)
TA (20%) — avoid rebalancing into resistance
Exploring new altcoins
FA (90%)
TA (10%) — don't chase pumps on unknown coins
Common Mistakes When Combining TA and FA
Even with the right framework, traders often stumble. Here are the pitfalls to avoid:
Mistake 1: Letting FA Bias Your TA Reading
You've done deep research on a project. You believe in it. You want it to succeed. And now you're seeing bullish patterns on the chart that aren't really there. This is confirmation bias — and it's the single most dangerous trap in hybrid analysis.
Fix: Read the chart before you check the fundamentals. Form your technical opinion in a vacuum, then compare it to your fundamental thesis. If they conflict, lean toward caution.
Mistake 2: Ignoring FA Because the Chart "Looks Good"
A beautiful ascending triangle on a coin you've never researched is not a trade — it's a gamble. Technical patterns fail at a base rate of 30-40%. On low-quality projects, that failure rate is even higher.
Fix: Never trade a coin that isn't on your fundamentally-screened watchlist (except with very small, speculative sizing).
Mistake 3: Analysis Paralysis
Combining two analysis methods doubles the data you're processing. Some traders get trapped in an endless cycle of checking one more metric, waiting for one more confirmation, and never actually entering a trade.
Fix: Define your criteria before you analyze. Write down: "I will buy if conditions X, Y, and Z are met." Then execute when they're met — don't add conditions after the fact. For more on the psychological challenges, see our trading psychology guide.
Mistake 4: Using FA Timeframes for TA Decisions (and Vice Versa)
Fundamental analysis operates on weeks-to-months timeframes. If you're using a bearish NVT reading to avoid a 4-hour swing trade, you're mismatching timeframes. Similarly, using a 15-minute RSI reading to make a portfolio allocation decision makes no sense.
Fix: Match the analysis type to the decision timeframe. Short-term decisions = TA. Long-term decisions = FA. Medium-term = both.
Frequently Asked Questions
Is technical analysis or fundamental analysis better for crypto beginners?
Start with technical analysis. It's more immediately actionable, has a shorter learning curve, and teaches you the critical skills of risk management, stop-loss placement, and position sizing. These skills protect your capital while you're still learning. Once you're comfortable reading charts and managing trades, layer in fundamental analysis to improve your coin selection. Most beginners who start with FA alone end up holding through devastating drawdowns because they have no timing framework.
Can you make money with only technical analysis in crypto?
Yes — many profitable traders use TA exclusively, particularly day traders and short-term swing traders. However, pure TA traders face two specific risks in crypto: trading fundamentally broken projects (rug pulls, dead chains), and being blindsided by events that don't appear on charts (hacks, regulatory actions, token unlocks). Adding even a basic fundamental filter — checking that a project has real users, active development, and reasonable tokenomics — dramatically reduces these risks.
How does fundamental analysis in crypto differ from stocks?
Dramatically. Stock FA relies on earnings reports, P/E ratios, dividend yields, and management guidance — all reported quarterly through regulated disclosures. Crypto FA uses entirely different metrics: tokenomics (supply schedules, vesting, burns), on-chain data (active addresses, NVT ratio, MVRV), protocol metrics (TVL, fee revenue, developer activity), and macro factors (ETF flows, regulatory environment). The biggest advantage? Crypto's blockchain data is real-time and publicly auditable — no waiting for quarterly earnings calls or trusting management's numbers.
What's the best way to combine TA and FA for crypto trading?
Use the "what + when" framework: FA determines what you trade (which coins make your watchlist), and TA determines when you trade them (entry timing, stop-loss placement, profit targets). Start each week with a 30-minute fundamental review to curate your watchlist. Then check charts daily on your approved list for technical setups. Before entering any trade, do a quick on-chain sanity check (whale activity, exchange flows). This hybrid workflow takes roughly 30-60 minutes daily and consistently outperforms either approach used in isolation.
Does CoinXSight use technical analysis, fundamental analysis, or both?
CoinXSight is built on a hybrid model. The ASI Score combines technical signals (trend, momentum, volatility, pattern recognition) with on-chain data (whale activity, exchange flows, network health) to produce a composite rating. Alpha Hunter generates trade signals based primarily on technical setups, while Deep Alpha provides deeper analytics that incorporate on-chain and volume-based insights. The platform's Discovery scanner lets you filter by both technical and fundamental criteria simultaneously — so you never have to choose between the two.
Summary
The technical analysis vs fundamental analysis crypto debate isn't really a debate at all — it's a false choice. Each approach answers a different question, covers a different time horizon, and protects against a different set of risks.
Technical analysis excels at timing: finding entries, setting exits, managing risk, and trading profitably in any market condition. It's your tactical tool — precise, immediate, and actionable.
Fundamental analysis excels at selection: identifying quality projects, avoiding disasters, building long-term portfolios, and spotting undervalued assets before the crowd. It's your strategic tool — thorough, forward-looking, and protective.
The hybrid approach — using FA for what to trade, TA for when to trade, and on-chain data as the bridge between them — gives you the complete picture that either method alone cannot provide.
In 2026, with BTC above $105,000, institutional flows reshaping market structure, and on-chain analytics more accessible than ever, there's no reason to limit yourself to one half of the toolkit. Build the habit now: screen fundamentally, enter technically, confirm on-chain.