Learn which crypto trading timeframe fits your style. Compare 1-minute to weekly charts with indicator settings, profit targets, and practical examples.
MC
Marcus ChenSenior Quantitative Strategist·Jun 6, 2026 · 19 min read · Updated Oct 6
The timeframe you choose on your chart isn't just a setting — it's a declaration about what kind of trader you are. A 5-minute Bitcoin chart and a daily Bitcoin chart can show completely opposite signals at the exact same moment. Neither is wrong. They're answering different questions for different traders.
Most beginners open a chart, pick whatever timeframe looks "right," and start drawing lines. Then they wonder why their RSI says overbought while someone else's RSI says oversold — on the same asset, at the same time. The difference? Timeframes.
This guide breaks down every major crypto trading timeframe individually, explains exactly what each one tells you, and helps you match the right timeframe to your trading style. If you're looking for how to combine multiple timeframes into one analysis, check out our multi-timeframe analysis guide — this article focuses on understanding and choosing the right timeframe first.
Why Your Timeframe Choice Matters More Than Your Indicator
Here's a reality check: a 20-period EMA on a 1-minute chart covers 20 minutes of price data. The same 20-period EMA on a daily chart covers 20 trading days. Same indicator, same setting, completely different information.
Your timeframe determines:
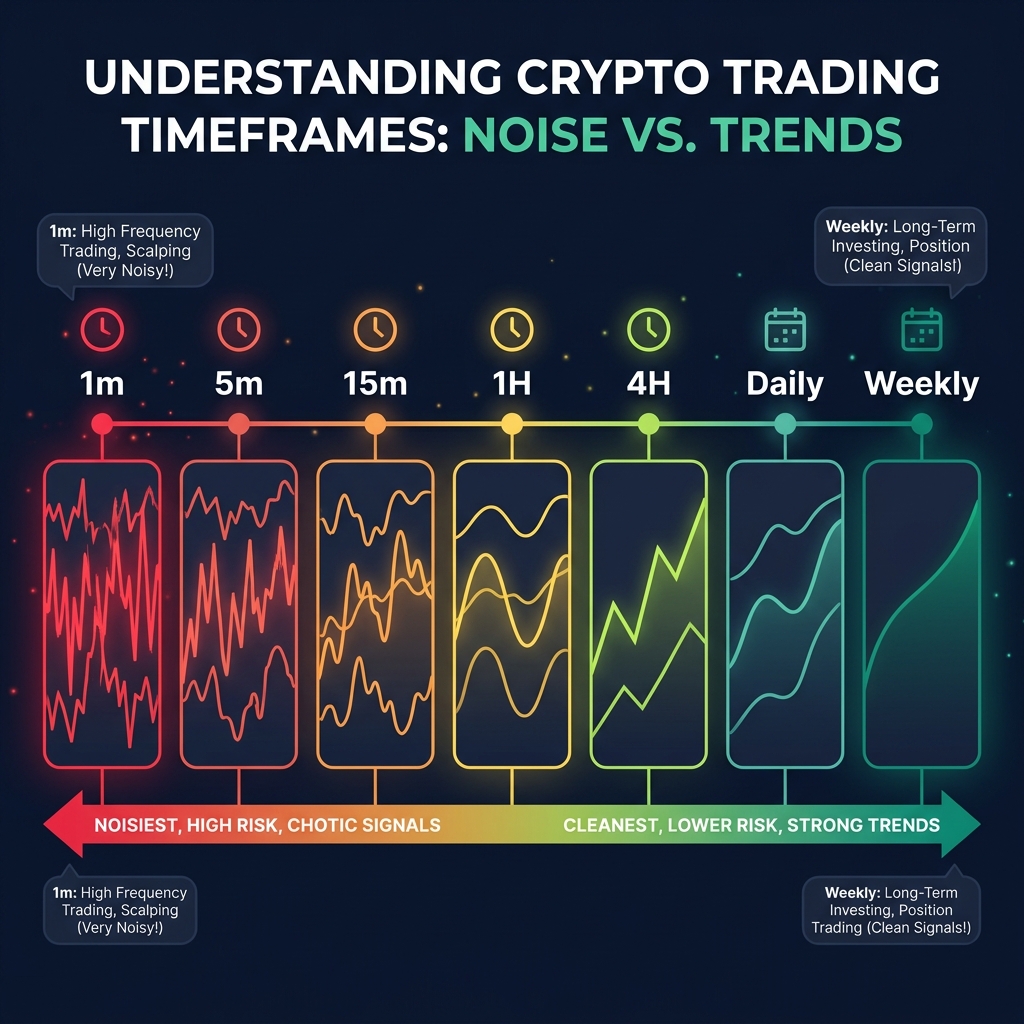
How much noise you see — Lower timeframes show every micro-movement; higher timeframes filter them out
How long you hold trades — A signal on the 1H chart means a different hold time than a signal on the weekly
How much screen time you need — Scalpers watch charts for hours; position traders check once a day
Your stress level — Watching 1-minute candles for 8 hours is mentally exhausting compared to reviewing daily candles over coffee
Your transaction costs — More trades mean more fees, more spread, and more slippage
With BTC trading around $105,000 in mid-2026, even a 0.1% fee adds up to $105 per round trip on a 1 BTC position. Choose a timeframe that gives you enough profit per trade to justify those costs.
Individual Timeframe Deep Dive
Let's break down each major timeframe you'll encounter on platforms like CoinXSight's Chart Pro. For each one, we'll cover what it actually shows you, who it's best for, and how to use it effectively.
1-Minute Chart (1m)
Attribute
Detail
Noise level
Extremely high — dominated by random order flow
Signal quality
Very low for trend analysis; useful only for precise entries
Best for
Scalpers executing within seconds to minutes
Candles to analyze
Last 60–120 candles (1–2 hours of data)
Realistic profit target
0.05%–0.15% per trade ($52–$157 on 1 BTC)
Key risk
Spread and fees can eat most of your edge
Indicator settings for 1m: Use faster periods — RSI(7), EMA(9/21), Bollinger Bands(10, 1.5). Standard settings like RSI(14) are too slow and will lag behind 1-minute price action by several candles.
Crypto-specific note: The 1-minute chart on BTC is only tradeable with sufficient liquidity. During weekend low-volume hours (Saturday 02:00–08:00 UTC), 1m candles can show massive wicks from single orders that have zero predictive value. Stick to high-volume sessions: US market hours (14:00–21:00 UTC) and the Asian open (00:00–03:00 UTC).
Verdict: Unless you're an experienced scalper with sub-0.02% fees and a co-located connection, the 1-minute chart is where most beginners lose money fastest.
5-Minute Chart (5m)
Attribute
Detail
Noise level
High, but starting to form recognizable patterns
Signal quality
Low-to-moderate; basic patterns start to work
Best for
Active day traders and scalpers stepping up in timeframe
Candles to analyze
Last 50–100 candles (4–8 hours of data)
Realistic profit target
0.15%–0.4% per trade ($157–$420 on 1 BTC)
Key risk
News events destroy 5m setups instantly
Indicator settings for 5m: RSI(9), EMA(12/26), MACD(8,17,9), Bollinger Bands(15, 2.0). These slightly faster settings help indicators respond to the compressed timeframe without whipsawing on every candle.
Crypto-specific note: The 5-minute chart is the most common timeframe for crypto futures scalpers. Funding rate resets every 8 hours (00:00, 08:00, 16:00 UTC) create predictable volatility bursts on the 5m chart — you'll often see a spike or dump in the 15 minutes surrounding each reset.
Verdict: Viable for day traders with experience, but requires 2–4 hours of active screen time per session. Your day trading strategy needs to account for the high number of false signals.
15-Minute Chart (15m)
Attribute
Detail
Noise level
Moderate — the first timeframe where trends become visible
Signal quality
Moderate; support/resistance levels start holding
Best for
Day traders who want fewer, higher-quality setups
Candles to analyze
Last 40–80 candles (10–20 hours of data)
Realistic profit target
0.3%–0.8% per trade ($315–$840 on 1 BTC)
Key risk
Can mislead you during consolidation — range-bound 15m charts generate many false breakouts
Indicator settings for 15m: RSI(12), EMA(15/30), MACD(10,21,9), Bollinger Bands(20, 2.0). These are approaching standard settings and offer a good balance between responsiveness and smoothing.
Crypto-specific note: The 15-minute chart is where most crypto exchanges calculate their "15m change %" displayed on tickers. Market makers and bots often use this timeframe for mean-reversion strategies, which means support and resistance zones on the 15m chart tend to hold better than on 5m charts — until they don't.
Verdict: The sweet spot for active day traders. Enough signal to be useful, few enough candles to avoid burnout. A good "entry timeframe" when your bias comes from the 1H or 4H chart.
1-Hour Chart (1H)
Attribute
Detail
Noise level
Low-to-moderate — clear trends and structures emerge
Signal quality
High; most standard indicators work well with default settings
Best for
Day traders and swing traders; the workhorse timeframe
Candles to analyze
Last 24–72 candles (1–3 days of data)
Realistic profit target
0.8%–2.5% per trade ($840–$2,625 on 1 BTC)
Key risk
Can miss intraday entries if you rely on it alone
Indicator settings for 1H: RSI(14), EMA(20/50), MACD(12,26,9), Bollinger Bands(20, 2.0), ATR(14). Standard settings work perfectly here — the 1-hour timeframe is what most indicators were originally designed for.
Crypto-specific note: The 1H chart is where the 1H vs 4H vs daily crypto debate gets interesting. One-hour candles give you enough data points per day (24 candles) to spot intraday trends, but enough smoothing to filter out noise. Key level: the 1H 200 EMA is widely watched by crypto traders and frequently acts as dynamic support or resistance. In mid-2026, BTC's 1H 200 EMA has been a reliable bounce zone during pullbacks within the broader uptrend.
Verdict: If you're choosing one timeframe to master, the 1-hour chart offers the best signal-to-noise ratio for crypto. CoinXSight's Alpha Hunter frequently flags setups on this timeframe for exactly this reason.
4-Hour Chart (4H)
Attribute
Detail
Noise level
Low — major moves and trend changes are clearly visible
Signal quality
Very high; false signals are significantly reduced
Best for
Swing traders and patient day traders
Candles to analyze
Last 30–60 candles (5–10 days of data)
Realistic profit target
2%–6% per trade ($2,100–$6,300 on 1 BTC)
Key risk
Slow to signal — you may enter late and miss part of the move
Indicator settings for 4H: RSI(14), EMA(21/55), MACD(12,26,9), Bollinger Bands(20, 2.0), ATR(14). Standard settings are ideal. Some traders use a slightly longer EMA pair (21/55 instead of 20/50) to better capture the multi-day swings visible on this timeframe.
Crypto-specific note: The 4H chart divides each day into exactly 6 candles, and the candle close times (00:00, 04:00, 08:00, 12:00, 16:00, 20:00 UTC) align with key institutional activity windows. The 08:00 UTC 4H candle close often marks the European session open, while the 16:00 UTC close captures the US session overlap. The 4H 50 EMA is one of the most respected dynamic levels in crypto — when BTC or ETH breaks below their 4H 50 EMA, swing traders take notice.
Verdict: The ideal primary timeframe for swing trading crypto. You check the chart 3–4 times a day, catch real moves, and avoid the noise that traps day traders.
Daily Chart (1D)
Attribute
Detail
Noise level
Very low — only significant moves register
Signal quality
Very high; reliable trends that last days to weeks
Best for
Position traders, trend followers, and investors
Candles to analyze
Last 30–90 candles (1–3 months of data)
Realistic profit target
5%–20% per swing ($5,250–$21,000 on 1 BTC)
Key risk
Wide stop losses required — a $3,000+ stop on BTC is normal
Indicator settings for 1D: RSI(14), EMA(20/50/200), MACD(12,26,9), Bollinger Bands(20, 2.0), ATR(14). The daily chart is where textbook settings shine. The 50-day and 200-day moving averages are the two most-watched levels in all of crypto — institutional traders, algorithms, and media all reference them.
Crypto-specific note: Unlike stocks, crypto daily candles close at UTC midnight (00:00 UTC). This is critical because many traders don't realize their platform might display daily candles using a different timezone. Always verify your chart platform's daily close time. Also note that the daily chart tells you almost nothing about intraday moves — BTC can drop 5% and recover within the same daily candle, showing just a wick that looks harmless in hindsight.
Verdict: The daily chart is where you define your bias. Whether you trade the 1H, 4H, or 15m, your first question should always be: "What's the daily chart saying?" This is the perspective behind CoinXSight's ASI Score — evaluating trend health at the daily level first.
Weekly Chart (1W)
Attribute
Detail
Noise level
Minimal — only macro trends visible
Signal quality
Extremely high, but very slow to generate signals
Best for
Long-term investors and macro cycle analysts
Candles to analyze
Last 20–52 candles (5–12 months of data)
Realistic profit target
20%–100%+ per position over weeks to months
Key risk
Signals arrive late; you miss the first 10–15% of moves
Indicator settings for 1W: RSI(14), EMA(10/21), MACD(12,26,9). On the weekly chart, a 10-period EMA represents ~2.5 months of data, which is already substantial. The weekly RSI has historically been one of the best tools for identifying crypto market cycle tops and bottoms — weekly RSI above 85 has marked every major BTC cycle top since 2017.
Crypto-specific note: Weekly candles close at UTC midnight on Sunday/Monday (the exact day depends on your platform). Because crypto trades 24/7, the weekly close captures all weekend activity — including the notoriously low-liquidity Sunday evening (UTC) sessions that can produce misleading wicks.
Verdict: Check the weekly chart every Sunday as part of your weekend analysis routine. It won't give you trades, but it'll keep you on the right side of the macro trend.
Timeframe vs Trading Style Matrix
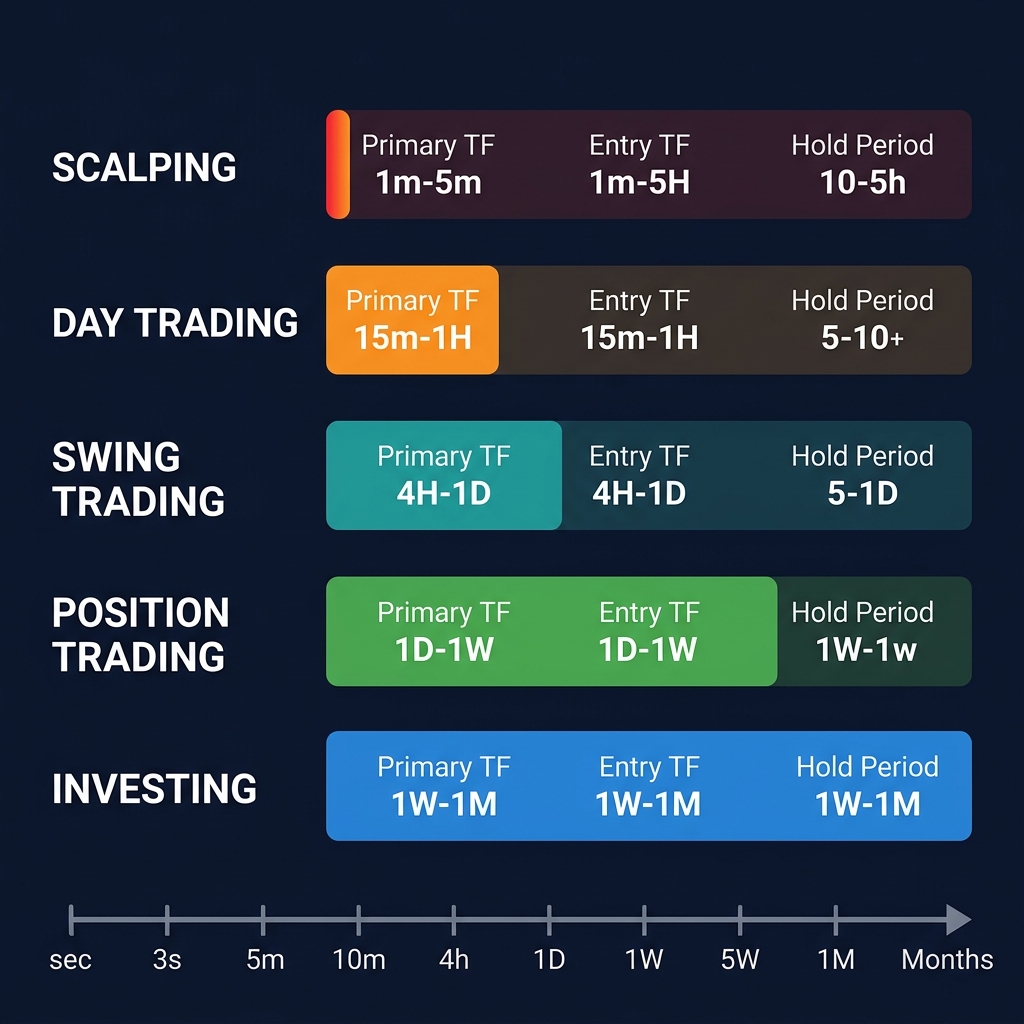
This is the table you bookmark. It maps every trading style to its ideal timeframe combination, expected hold time, and position sizing approach:
Trading Style
Primary TF
Entry TF
Confirmation TF
Typical Hold Time
Trades/Week
Suggested Position Size
Scalping
5m
1m
15m
30 seconds – 15 minutes
30–100+
5%–10% of portfolio per trade
Day Trading
15m or 1H
5m
4H
30 minutes – 8 hours
5–15
3%–5% of portfolio per trade
Swing Trading
4H
1H
1D
2 days – 2 weeks
2–5
2%–4% of portfolio per trade
Position Trading
1D
4H
1W
2 weeks – 3 months
1–2
5%–10% of portfolio per trade
Investing
1W
1D
Monthly
3 months – 2+ years
<1
10%–25% of portfolio per position
How to Read This Table
Primary TF is where you do your main analysis — trend identification, support/resistance, pattern recognition
Entry TF is one step lower, where you fine-tune your exact entry price and timing
Confirmation TF is one step higher, where you check that the broader trend supports your trade
Example in practice: You're a swing trader looking at ETH (currently around $2,800). On the daily chart (confirmation TF), ETH is in an uptrend above the 50 EMA. On the 4H chart (primary TF), you spot a pullback to the 21 EMA with RSI at 42 — a potential bounce zone. You drop to the 1H chart (entry TF) and wait for a bullish engulfing candle to trigger your entry. You risk 2% of your portfolio with a stop below the 4H swing low.
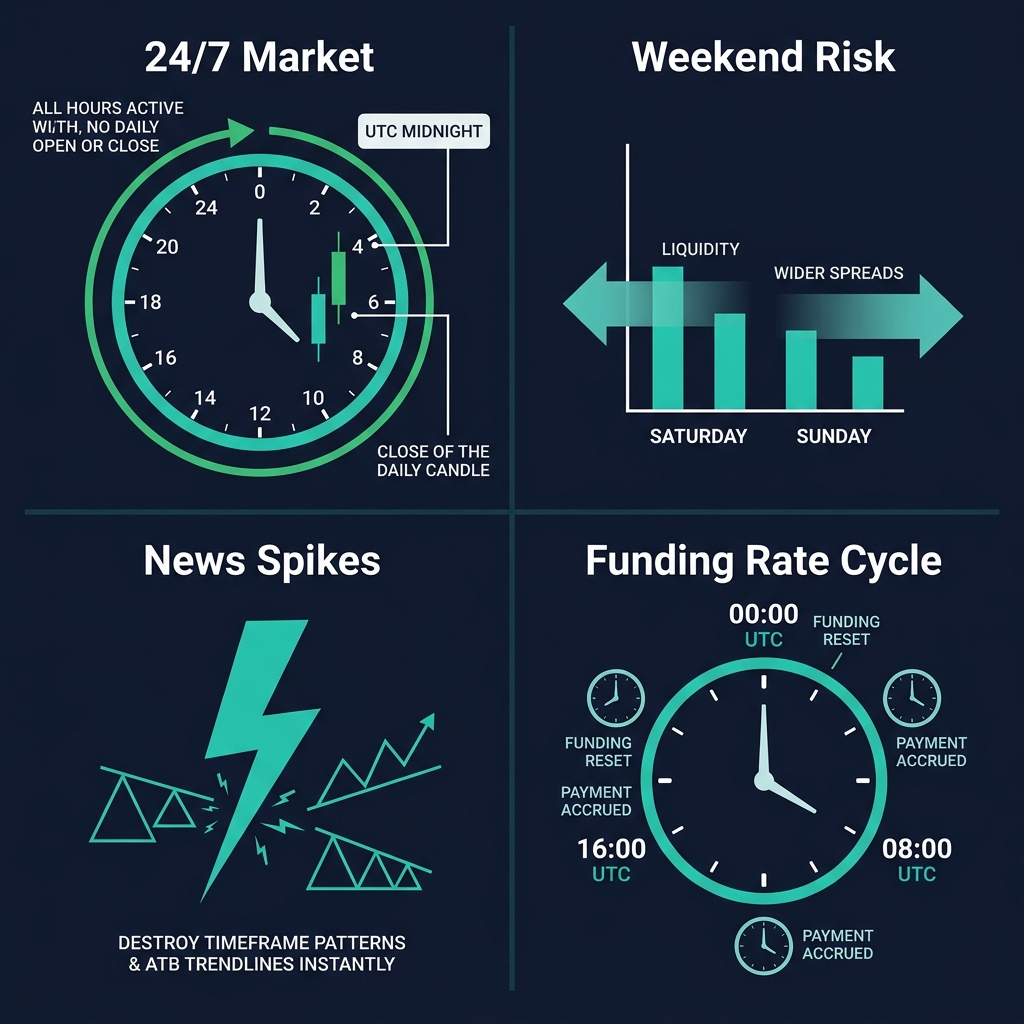
Crypto isn't stocks. The market runs 24/7/365, and this fundamentally changes how timeframes work. Here are four things every crypto trader must understand:
1. The 24/7 Market and the UTC Midnight Close
Stocks have a clear open and close. Crypto doesn't — so where does the "daily candle" begin and end?
The industry standard is UTC midnight (00:00 UTC). This is what Binance, Coinbase, CoinXSight, and most major platforms use. But some charting tools default to your local timezone or the exchange's timezone.
Why this matters: If you're analyzing a daily candle close at the 200 EMA, but your chart uses EST while the rest of the market uses UTC, you might be looking at a completely different candle shape. Always set your chart to UTC for daily and higher timeframes.
2. Weekend Liquidity Gaps
Not all 1H candles are created equal. A 1-hour candle during Tuesday's New York session might contain $2 billion in BTC volume. A 1-hour candle on Saturday morning UTC might contain $200 million — 10x less liquidity.
Practical rule: Patterns and signals on lower timeframes (1m through 1H) are significantly less reliable during:
Saturday 00:00 – Sunday 12:00 UTC (lowest liquidity window)
Major holidays (Christmas, Chinese New Year)
If you see a "perfect" 15m breakout at Saturday 03:00 UTC, treat it with extreme skepticism. Wait for Monday's session to confirm.
3. News-Driven Spikes and Timeframe Destruction
Crypto is one of the most news-sensitive markets on earth. A single tweet, regulatory announcement, or exchange hack can move BTC 5–10% in minutes.
When major news hits, every timeframe below the daily becomes unreliable instantly. A carefully constructed 1H support level means nothing when a surprise SEC ruling drops. This is why risk management — specifically stop losses — matters more in crypto than in any other market.
Practical rule: Always have a stop loss, regardless of timeframe. If you're trading the 5m chart, news can hit before you even see the candle close. If you're trading the daily chart, at least you have time to react.
4. The Funding Rate 8-Hour Cycle
Crypto perpetual futures have a unique mechanic: funding rates reset every 8 hours (typically 00:00, 08:00, and 16:00 UTC). This creates predictable patterns:
5 minutes before funding: Positions get adjusted. Expect choppy price action on the 1m and 5m charts
At funding reset: A small spike or dip as longs or shorts pay the funding fee
5–15 minutes after funding: Price often reverses the pre-funding move
For futures traders, aligning your 5m or 15m analysis with these 8-hour cycles can improve timing. Check funding rate and open interest data for current rates before entering positions.
Indicator Settings Per Timeframe
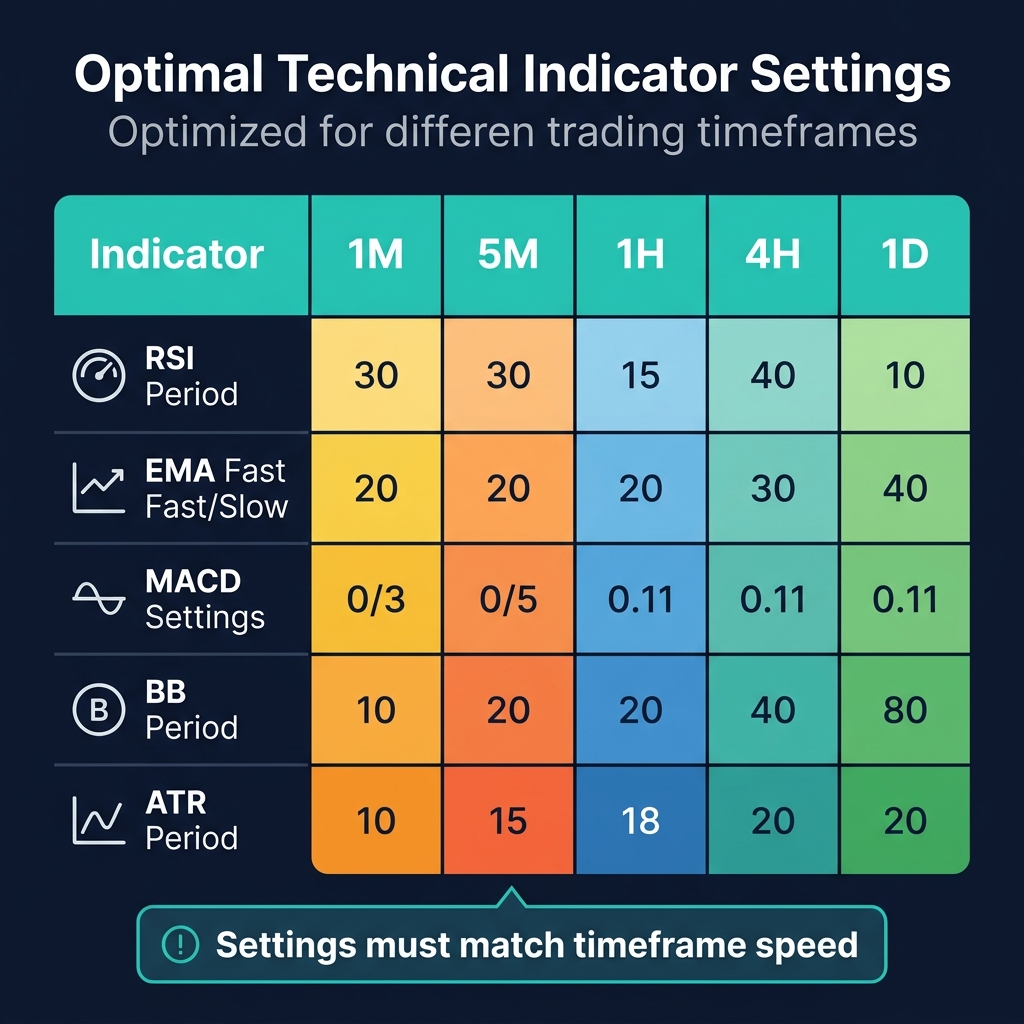
One of the most common beginner mistakes is using the same indicator settings across all timeframes. Here's a practical reference table with optimized settings:
Indicator
1m
5m
15m
1H
4H
1D
RSI
7
9
12
14
14
14
Fast EMA
9
12
15
20
21
20
Slow EMA
21
26
30
50
55
50
MACD
8,17,9
8,17,9
10,21,9
12,26,9
12,26,9
12,26,9
Bollinger Bands
10, 1.5σ
15, 2.0σ
20, 2.0σ
20, 2.0σ
20, 2.0σ
20, 2.0σ
ATR
7
10
14
14
14
14
Why Settings Change on Lower Timeframes
Standard indicator settings (RSI 14, EMA 20/50, etc.) were designed for daily stock charts. When you compress them to 1-minute candles, a 14-period RSI only looks at 14 minutes of data — far too little to produce reliable overbought/oversold signals.
The general rule: the lower the timeframe, the shorter your indicator periods should be. This compensates for the reduced amount of meaningful data each candle contains.
CoinXSight's Deep Alpha panel automatically adjusts indicator sensitivity based on your selected timeframe, so you don't have to manually reconfigure settings when switching between charts.
Practical tip: If you customize indicator settings, save them as a template for each timeframe. Switching from a 4H to 5m chart and forgetting to adjust your RSI from 14 to 9 can lead to dangerously lagging signals.
The "Higher TF Confirms, Lower TF Triggers" Rule
This is the single most important concept in timeframe selection, and it's simple enough to fit on an index card:
Never take a trade against the higher timeframe trend. Always time your entry on the lower timeframe.
Here's a concrete example with SOL (trading around $170 in June 2026):
Weekly chart: SOL is in a clear uptrend, above the 10 and 21 weekly EMAs. Bias: bullish only.
Daily chart (confirmation): SOL pulled back to the 20 EMA at $163. RSI(14) at 45 — not oversold, but cooling off. This supports the "buy the dip" thesis.
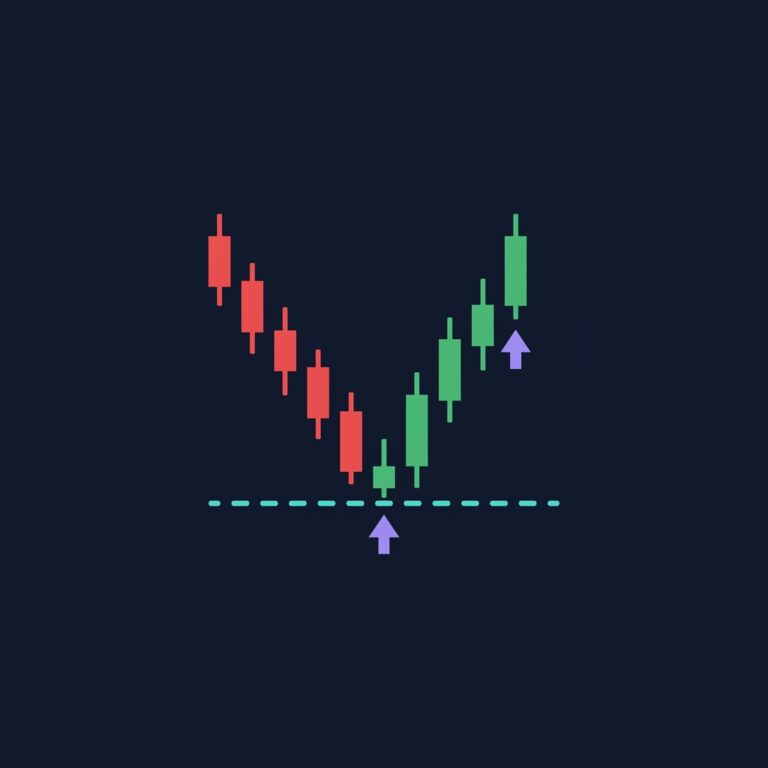
4H chart (primary analysis): A bullish divergence is forming — price made a lower low at $163, but RSI made a higher low. A potential reversal zone.
1H chart (entry trigger): You wait for a bullish engulfing candle above the 1H 20 EMA. It arrives at $166. You enter long.
Trade management: Stop loss below the 4H swing low at $161 (risk: $5/SOL, or ~3%). Target: $178 (previous 4H resistance), reward: $12/SOL, or ~7.2%. Risk-to-reward: 1:2.4.
The higher timeframe told you what to do (buy). The lower timeframe told you when to do it (bullish engulfing at $166). This is how professionals use timeframes — not as isolated views, but as a hierarchy.
Mistake 1: Switching Timeframes to Confirm Your Bias
This is the most dangerous habit in trading. You see a bearish signal on the 4H chart, but you don't want to close your long position. So you switch to the 1H chart — "Oh look, the 1H RSI is only at 50, still room to run!" Then you switch to the 15m — "See, there's a small bounce forming!"
You just went from a reliable timeframe to a noisy one, specifically to find evidence that supports what you want to believe. This is called timeframe shopping, and it will destroy your account over time.
The fix: Decide your primary, entry, and confirmation timeframes BEFORE you open a trade. Write them down. Only look at those three. If your primary TF says exit, you exit — regardless of what the lower TFs show.
Mistake 2: Using Daily Indicator Settings on 5-Minute Charts
We covered this above, but it's worth repeating because it's so common. Running RSI(14) on a 5-minute chart means your RSI is looking at just 70 minutes of price data. That's not enough to generate meaningful overbought/oversold signals in crypto's volatile environment.
The fix: Use the indicator settings table above, or let CoinXSight's Deep Alpha auto-adjust settings for you. At minimum, reduce RSI to 9 and EMA periods proportionally when using timeframes below 1H.
Mistake 3: Ignoring the Noise Floor
Every timeframe has a "noise floor" — a level of random price movement that contains no useful information. On the 1-minute chart, moves of 0.02–0.05% are pure noise. On the daily chart, even moves of 0.5–1% can be meaningless wicks.
The problem: traders see a 0.03% bounce on a 1-minute candle and think it's a "reversal signal." It's not. It's market microstructure — bid-ask spread fluctuations, small orders getting filled, and algorithmic arbitrage.
The fix: For any timeframe, know the minimum move size that constitutes a real signal. Here's a rough guide for BTC at $105,000:
Timeframe
Noise Floor (typical random move)
Minimum Signal Move
1m
0.02%–0.05% ($21–$52)
>0.1% ($105)
5m
0.05%–0.15% ($52–$157)
>0.25% ($262)
15m
0.1%–0.3% ($105–$315)
>0.5% ($525)
1H
0.2%–0.5% ($210–$525)
>0.8% ($840)
4H
0.3%–1.0% ($315–$1,050)
>1.5% ($1,575)
1D
0.5%–2.0% ($525–$2,100)
>3.0% ($3,150)
If a move on your chosen timeframe doesn't exceed the "Minimum Signal Move," it's probably noise. Don't trade noise.
Mistake 4: Analyzing Too Many Candles
Beginner traders often zoom out to see hundreds of 1H candles, thinking more data means better analysis. But a 1H candle from 3 months ago is largely irrelevant to today's price action — market conditions, sentiment, and participants have all changed.
The fix: Stick to the "candles to analyze" ranges listed in each timeframe section above. For the 1H chart, that's the last 24–72 candles (1–3 days). For the daily chart, it's 30–90 candles (1–3 months). Beyond that, you're looking at historical context, not actionable data.
Mistake 5: Trying to Trade Every Timeframe
Some traders run six monitors with different timeframes open simultaneously, trying to catch every move on every chart. The result? Information overload, contradictory signals, and decision paralysis.
The fix: Pick ONE trading style from the matrix table above. Use its three designated timeframes (primary, entry, confirmation). Ignore everything else. You can always change your style later — but you can't trade all styles at once.
Frequently Asked Questions
What is the best timeframe for crypto trading beginners?
The 1-hour chart is the best starting point for beginners. It provides enough data points per day (24 candles) to practice pattern recognition without the overwhelming noise of lower timeframes. Standard indicator settings (RSI 14, EMA 20/50) work correctly on 1H charts, and realistic profit targets of 0.8%–2.5% per trade give you room to cover fees and still profit even with a modest win rate. Once you're consistently profitable on the 1H, you can explore moving up to 4H for swing trading or down to 15m for more active day trading.
Is the 4-hour or daily chart better for swing trading?
The 4-hour chart is better as your primary analysis timeframe for swing trading because it gives you 6 data points per day compared to the daily chart's single candle. This means you see trend changes, support tests, and pattern formations 1–2 days earlier than daily-only traders. However, the daily chart should serve as your confirmation timeframe — always check that the daily trend supports your 4H trade idea before entering. Think of it as: "The daily chart tells me what to trade, the 4H chart tells me when to trade it."
Why do my indicators give different signals on different timeframes?
Because each timeframe represents a different slice of market data. A 14-period RSI on the 1H chart calculates momentum over the last 14 hours. The same RSI(14) on the daily chart calculates momentum over the last 14 days. These are fundamentally different measurements. The 1H RSI might show overbought conditions from a quick intraday rally, while the daily RSI shows a neutral reading because the broader trend hasn't extended yet. This isn't a conflict — it's different traders seeing different things. The key is to trust your primary timeframe's signals and use others only for confirmation.
How does the 24/7 crypto market affect timeframe analysis?
The biggest impact is on the daily candle close. In stocks, the daily close happens at a fixed time when the market shuts down, creating a "final price" that everyone agrees on. In crypto, the daily close at UTC midnight is arbitrary — trading continues immediately after. This means daily candle closing patterns (like doji or engulfing candles) can be slightly less reliable in crypto than in stocks, because there's no gap between candles. Additionally, lower timeframes (1m–1H) behave very differently during high-liquidity hours (US/Europe overlap) versus low-liquidity hours (weekend nights), which simply doesn't happen in traditional markets.
Should I use different timeframes for different cryptocurrencies?
Generally, use the same primary timeframe regardless of the asset — your trading style shouldn't change between BTC and an altcoin. However, you may need to adjust your noise floor expectations. BTC at $105,000 has tighter percentage moves than a small-cap altcoin that can swing 10% in an hour. For highly volatile altcoins, consider moving up one timeframe from what you'd use for BTC. For example, if you day trade BTC on the 15m chart, try the 1H chart for smaller altcoins — the extra smoothing helps compensate for their higher volatility and wider spreads.
Summary
Choosing the right crypto trading timeframe isn't about finding the "best" chart — it's about matching your chart to your lifestyle, risk tolerance, and trading goals. Here's what to remember:
1-minute and 5-minute charts are for experienced scalpers only. The noise-to-signal ratio is brutal, and fees eat your edge.
15-minute and 1-hour charts are where most day traders find their sweet spot. Standard indicators work well, and you get enough setups per day without burning out.
4-hour and daily charts are ideal for swing and position traders. Fewer false signals, lower stress, and bigger profit targets that justify the wider stops.
Weekly charts are for macro trend analysis and long-term investing — check them once a week, not once an hour.
Always use the "Higher TF Confirms, Lower TF Triggers" rule — never trade against the bigger picture.
Crypto-specific factors (24/7 trading, weekend liquidity, funding cycles, news sensitivity) affect lower timeframes more than higher ones.
The best timeframe for crypto trading is the one you can trade consistently, profitably, and without destroying your mental health. Start with the 1H chart, build a track record, and only expand when your results justify it.
Master multi-timeframe analysis for crypto trading. Learn the 3-timeframe rule, top-down analysis flow, timeframe alignment signals, and how to combine…
Master crypto swing trading with AI-powered signal generation, EMA crossover strategies, and risk management. Step-by-step setups using CoinXSight with real…