You deposited $1,000 with 100x leverage. You now control $100,000 in BTC. You feel like a whale. In 37 minutes, you have $0.
That's not a hypothetical. BTC moves 1% in under an hour on a quiet day. At 100x leverage, a 1% move against you triggers full liquidation — your entire $1,000 is gone. No partial loss. No chance to react. Zero.
This article breaks down the exact math behind crypto leverage trading, using real 2026 liquidation data from CoinGlass. If you're searching for "100x leverage" with dollar signs in your eyes, these numbers will change your mind.
What Is Leverage Liquidation in Crypto Trading?
Leverage liquidation is the forced closure of a leveraged position when your losses consume the margin (collateral) you deposited. The exchange closes your trade automatically to recover the borrowed funds — you lose everything you put in.
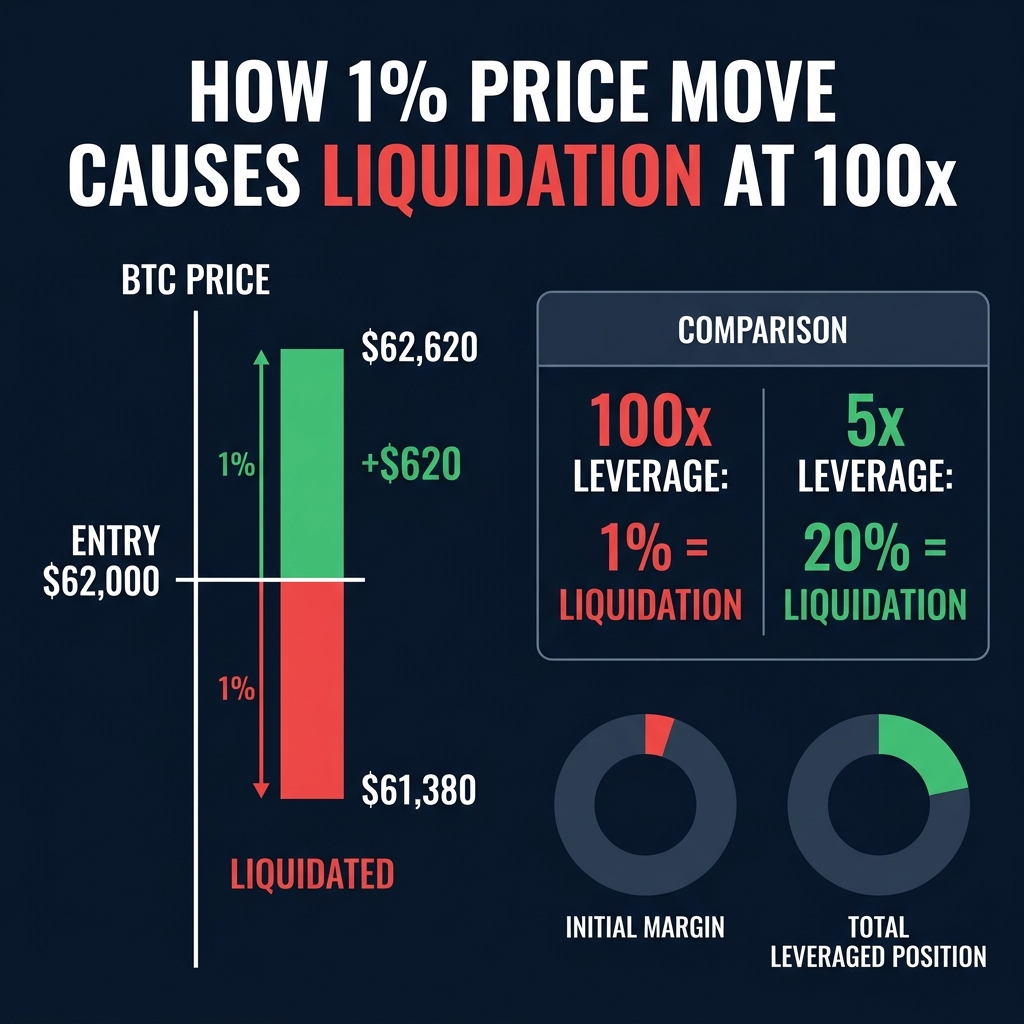
At 100x leverage, your margin is 1% of your position size. That means a price move of just 1% against your direction wipes your account to zero. There is no warning, no second chance, and no way to undo it once the price crosses your liquidation threshold.
The formula is straightforward, and it works against you faster than most traders expect.
How Liquidation Price Is Calculated
The liquidation price for an isolated-margin position depends on your entry price and leverage level. The approximation formula, standard across major exchanges:
These formulas come from the core mechanics of margin trading: the exchange needs to ensure the borrowed capital is repaid, so it closes your position before losses exceed your deposit.
💡 On CoinXSight, the Chart Pro module auto-calculates your liquidation price when you input your entry, leverage, and margin mode. No manual math required — the platform handles it in real time.
Why Does a 1% Move Liquidate You at 100x?
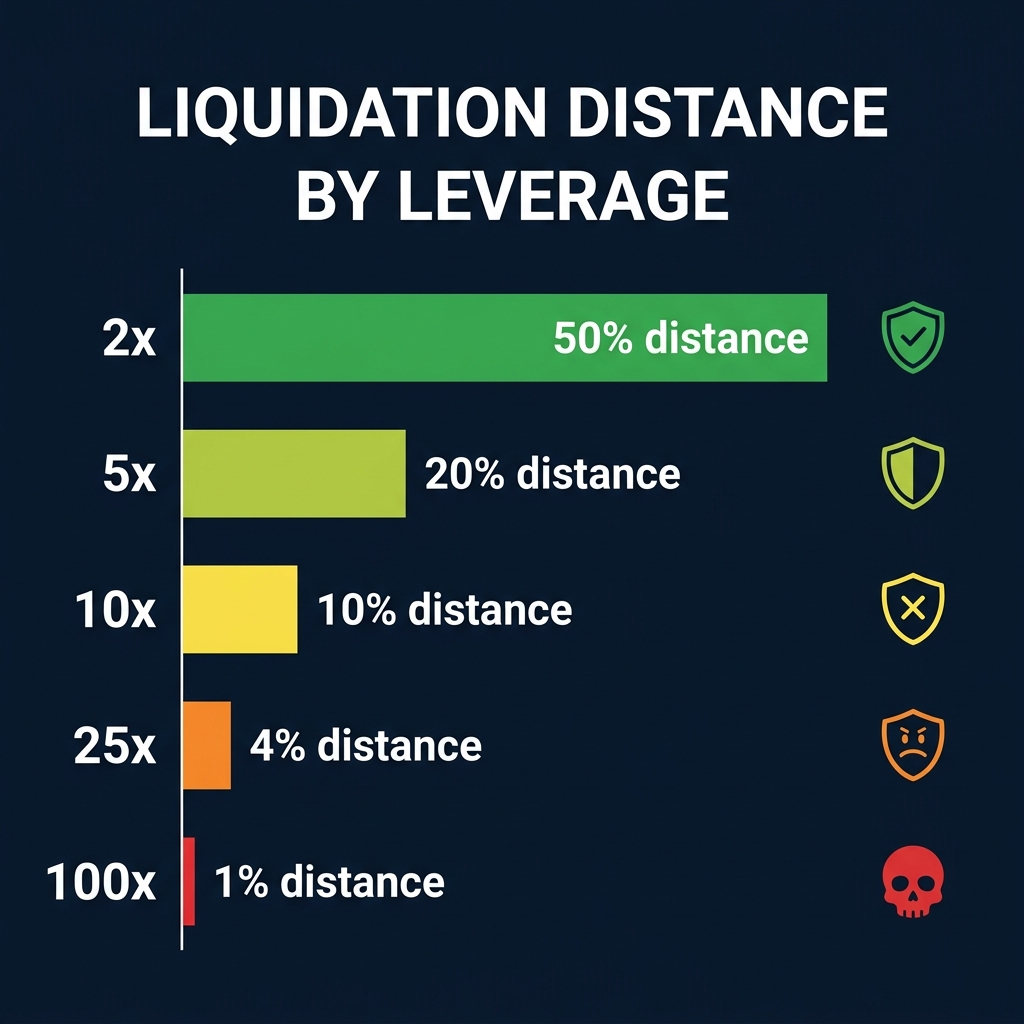
At 100x leverage, your margin is exactly 1/100th of your position size. A 1% adverse price move generates a loss equal to 100% of your margin — and the exchange liquidates.
Here's the math with BTC at $62,000:
Leverage
Margin on $62,000 position
Liquidation distance
Liquidation price (long)
BTC daily avg. move
2x
$31,000
50.0%
$31,000
2-4%
5x
$12,400
20.0%
$49,600
2-4%
10x
$6,200
10.0%
$55,800
2-4%
25x
$2,480
4.0%
$59,520
2-4%
50x
$1,240
2.0%
$60,760
2-4%
100x
$620
1.0%
$61,380
2-4%
BTC's average daily range in 2026 is 2-4%. At 100x leverage, a single standard price fluctuation — not a crash, not a black swan, just normal market noise — exceeds your liquidation threshold by 2-4 times.
The conclusion is mathematical, not opinion-based: at 100x leverage, the probability of surviving a single trading session is near zero.
⚠️ Limitation: These calculations use simplified liquidation formulas. Actual liquidation prices vary slightly by exchange due to maintenance margin requirements, insurance fund contributions, and fee deductions. Binance, Bybit, and OKX each have their own liquidation engine rules. Always verify your exact liquidation price on the exchange before opening a position.
Real Liquidation Data: What 2026 Looks Like
The numbers below aren't theory. They're from CoinGlass liquidation data and exchange reports covering January through June 2026.
2026 Liquidation Events
Period
Total liquidated
Dominant side
Key driver
Jan 20, 2026
$1.08 billion (24h)
89% longs
Macro sell-off, overleveraged market
Feb 5, 2026
311,000 traders liquidated (24h)
Longs
Sudden volatility spike
June 4-5, 2026
$1.3-1.8 billion/day
Longs
BTC ETF outflows, rapid sell-off
June 1-7, 2026
~$7 billion (weekly)
81% longs ($5.7B)
Sustained ETF outflows + leverage cascade
In the first week of June 2026 alone, $7 billion in leveraged positions were wiped out. Of that, $5.7 billion came from long positions — traders who thought BTC would go up and used leverage to amplify that bet.
Example — BTC Liquidation Cascade on CoinXSight Chart Pro (June 4, 2026)
BTC traded at $64,200 at 08:00 UTC. By 09:15 UTC, price had dropped to $62,800 — a 2.2% decline in 75 minutes. CoinXSight's Chart Pro module showed volume spike to 340% of the 20-period average, with the Confluence Score dropping from 7/10 to 3/10 within the hour. Any trader holding a 50x+ long position opened above $64,000 was liquidated during this window. At 100x, liquidation triggered at $63,558 — reached within the first 12 minutes of the move.
The Liquidation Cascade Effect
High-leverage liquidations don't happen in isolation. When a cluster of 100x and 50x positions gets liquidated, those forced sell orders push the price down further, triggering liquidations at lower leverage levels. This creates a cascade:
100x longs liquidated at -1% → forced selling
50x longs liquidated at -2% → more forced selling
25x longs liquidated at -4% → price accelerates downward
The result: what started as a normal 1% dip becomes a 5-8% flash crash, driven entirely by leveraged liquidations feeding on each other. This structural dynamic is why crypto markets crash harder and faster than traditional markets — the leverage is higher, and the liquidation engines are automated.
The Hidden Costs That Destroy High-Leverage Traders
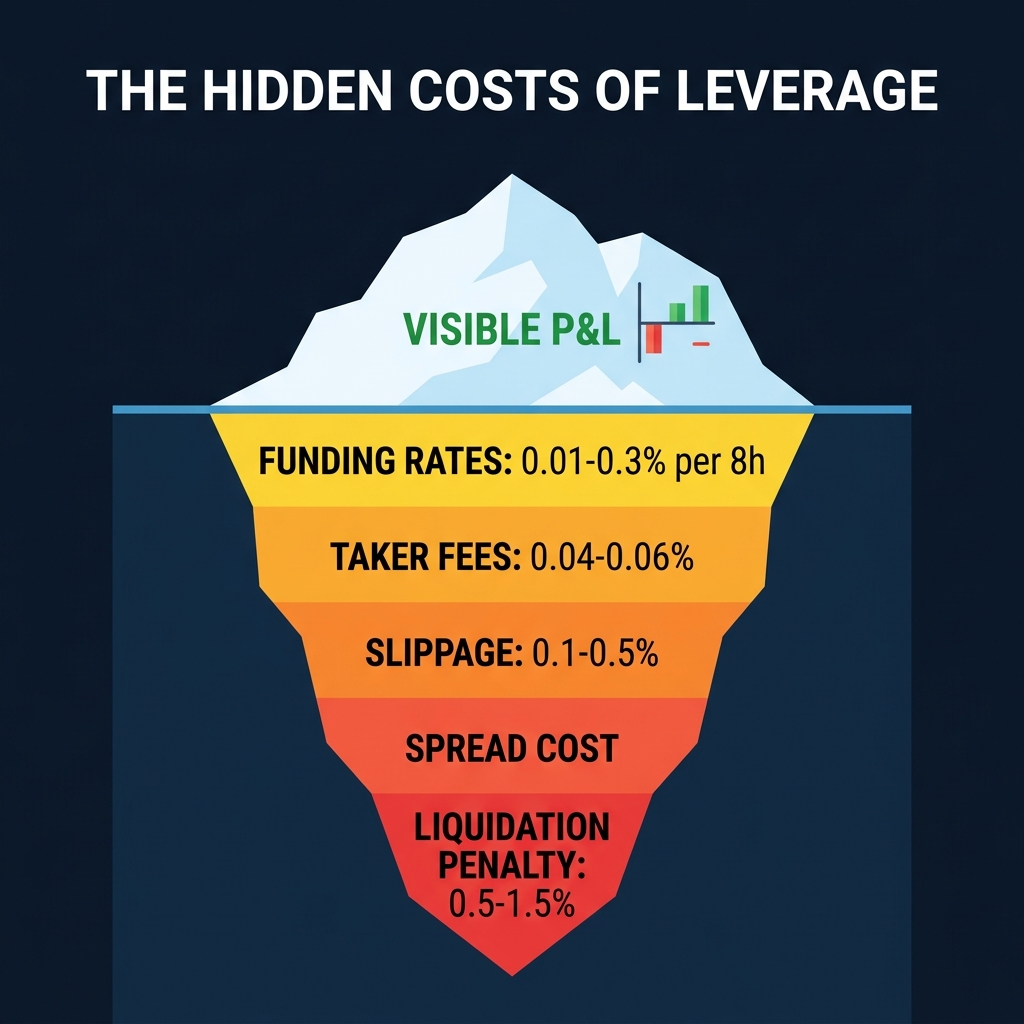
Even if price doesn't move against you immediately, high leverage positions bleed money through costs most beginners overlook.
Cost Breakdown on a $100,000 Position (100x on $1,000 margin)
Cost
Rate
Amount per event
Daily cost
Taker fee (open)
0.05%
$50
One-time
Taker fee (close)
0.05%
$50
One-time
Funding rate
0.01% / 8h
$10 per payment
$30
Slippage
~0.05-0.1%
$50-$100
Per trade
Spread cost
~0.01-0.03%
$10-$30
Per trade
Total cost to open and close: $160-$230 minimum.
On a $1,000 margin account with 100x leverage, those fees consume 16-23% of your margin before price moves at all. You need a 0.16-0.23% favorable move just to break even — and that's before funding rates start accumulating every 8 hours.
Break-Even Price Move by Leverage Level
Break-Even Move = Total Fees / Position Size

At 100x: ~0.16% move needed (but 1% liquidation distance)
At 25x:  ~0.16% move needed (but 4% liquidation distance)
At 5x:   ~0.16% move needed (but 20% liquidation distance)
At 2x:   ~0.16% move needed (but 50% liquidation distance)
The fees are roughly the same in dollar terms regardless of leverage. But at 100x, those fees represent a much larger percentage of your margin. At 2x leverage, the same fees are barely noticeable against your 50% margin buffer.
Funding Rates Compound Against You
During bullish markets, funding rates can spike to 0.03-0.1% per 8 hours. On a $100,000 position:
That's $90/day on a $1,000 margin account — 9% of your capital gone daily, even if BTC price doesn't move. After 11 days, funding alone would have consumed your entire margin.
The standard fee structures across major exchanges like Binance (0.02%/0.05% maker/taker for futures), Bybit (0.02%/0.055%), and OKX (0.02%/0.05%) mean these costs are unavoidable on any crypto trading platform.
What Leverage Actually Works? The Data-Backed Answer
The math narrows the usable range fast. Here's the analysis by trading style, using BTC's observed volatility in 2026.
Swing Trading (Holding 1-14 Days)
Optimal leverage: 2-3x maximum
BTC's average weekly range in 2026 is 5-12%. A 10% drawdown at 3x leverage costs 30% of your margin — painful but survivable. At 10x, that same 10% drawdown liquidates you completely.
Leverage
5% drawdown impact
10% drawdown impact
Survives 2026 weekly vol?
2x
-10% of margin
-20% of margin
✅ Yes
3x
-15% of margin
-30% of margin
✅ Yes (tight)
5x
-25% of margin
-50% of margin
⚠️ Barely
10x
-50% of margin
Liquidated
❌ No
Day Trading / Scalping (Holding Minutes to Hours)
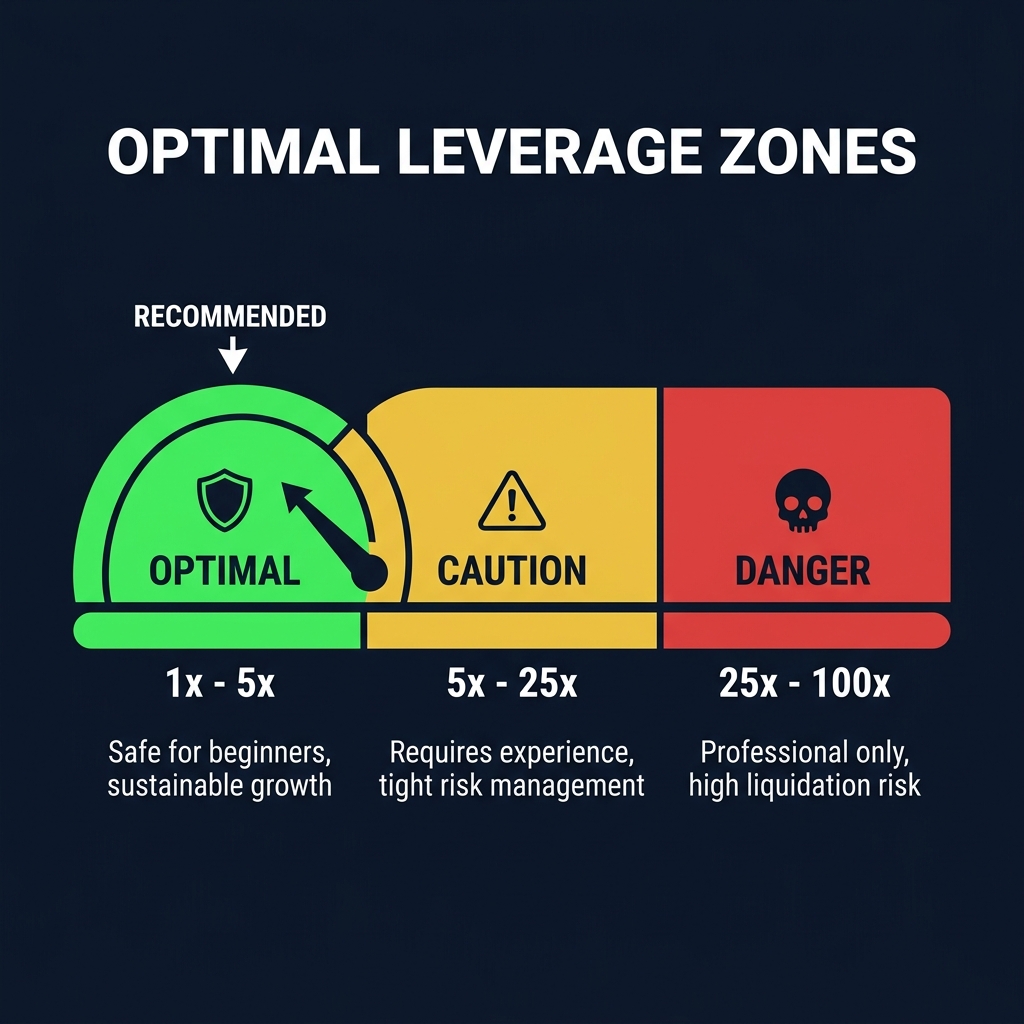
Maximum leverage: 5-10x with strict stop losses
Intraday BTC moves typically range 1-4%. At 5x, you can survive a 3% adverse move (15% margin loss). At 10x, a 3% move costs 30% of your margin — viable only with a stop loss at 1-2% price distance.
Example — ETH Leverage Comparison on CoinXSight Chart Pro (June 8, 2026)
ETH traded at $2,840. A trader opens two identical long positions with $500 margin each:
Position A — 5x leverage ($2,500 position):
Liquidation price: $2,272 (20% below entry). ETH drops to $2,760 (-2.8%), losing $70 (14% of margin). Position survives. ETH recovers to $2,890 the next day — net profit: $25 (5% return on margin).
Position B — 100x leverage ($50,000 position):
Liquidation price: $2,811.60 (1% below entry). ETH drops to $2,811 within 22 minutes of opening. Position liquidated. Loss: $500 (100% of margin). No recovery possible.
Same trade, same direction, same timing. The 5x position profits. The 100x position is destroyed.
The Rule of Thumb
Your maximum leverage should never exceed the inverse of your expected drawdown. If you expect a maximum 5% adverse move before your thesis plays out, your leverage ceiling is 1/0.05 = 20x. In practice, halve that number for safety: 10x maximum.
For most retail traders, 2-5x is the range where leverage adds value without creating existential risk to your account.
How AI Changes Crypto Leverage Trading in 2026
In 2026, AI tools have moved from novelty to necessity in crypto futures trading. The core advantage: AI removes the emotional decision-making that kills leveraged traders.
CoinXSight's AI-Powered Position Sizing
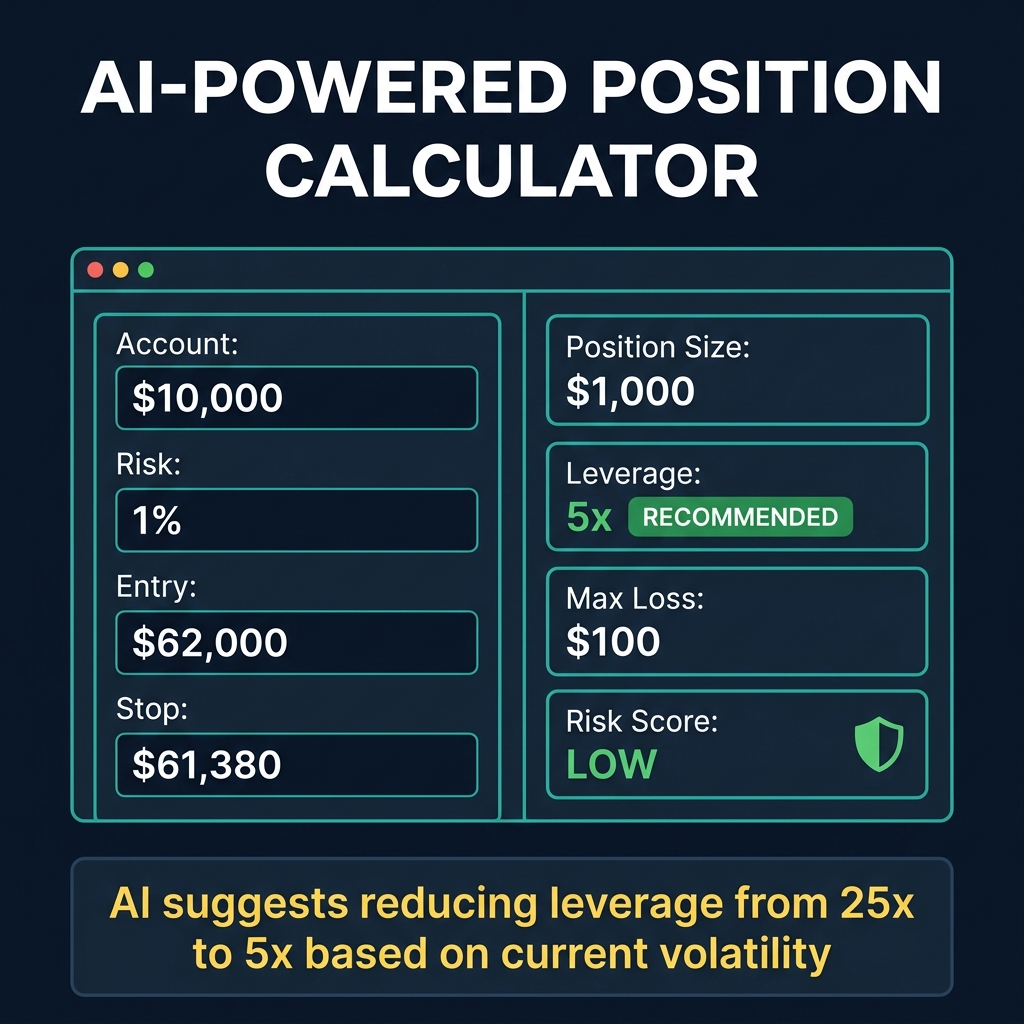
CoinXSight's Chart Pro module includes an AI risk calculator that computes your optimal position parameters before you enter a trade:
Input your entry price and stop loss — based on technical levels from the chart
Set your risk amount — e.g., 2% of account equity
AI calculates: position size, suggested leverage, liquidation price, and risk/reward ratio
Safety check — the module flags high-volatility conditions where any leverage above 3x is dangerous
The system uses real-time volatility data (ATR, Bollinger Band width, volume profiles) to adjust leverage recommendations dynamically. During high-volatility periods like the June 2026 sell-off, the AI automatically suggests reducing leverage from its baseline.
💡 On CoinXSight, the Chart Pro module integrates position sizing with the 4-layer Confluence Scoring system: Trend Layer (EMA + Supertrend), SMC Layer (Order Blocks + Fair Value Gaps), Momentum Layer (RSI + MACD + StochRSI + MFI), and Volume Layer. A low Confluence Score (below 5/10) triggers an automatic recommendation to reduce leverage or skip the trade entirely.
ChatGPT Prompt for Leverage Risk Assessment
You can use any AI assistant to stress-test a leveraged position. Copy this prompt:
I'm considering a BTC long position with the following parameters:
- Entry: $62,000
- Account balance: $5,000
- Planned leverage: 10x
- Stop loss: $60,500

Calculate:
1. My position size and margin required
2. My liquidation price (isolated margin)
3. Maximum loss if stop loss triggers
4. Break-even price after fees (0.05% taker, 0.01% funding/8h)
5. Required price target for a 2:1 reward/risk ratio
6. How many hours of funding I can sustain before fees consume 10% of margin

Flag any risks with these parameters.
This takes 10 seconds and can prevent a catastrophic loss. In 2026, there is no excuse for entering a leveraged trade without running the math first — AI does it instantly.
The Kelly Criterion: Mathematical Leverage Sizing
The Kelly Criterion, developed by John L. Kelly Jr. at Bell Labs in 1956, provides a mathematically optimal formula for position sizing. It's the closest thing to a scientific answer for "how much leverage should I use?"
The Kelly Formula
f* = W - (1 - W) / R
Where:
f* = optimal fraction of capital to risk
W = win rate (probability of winning trade)
R = reward-to-risk ratio (average win ÷ average loss)
Kelly Applied to Crypto Leverage
Suppose a trader has a verified 55% win rate and a 1.5:1 reward-to-risk ratio:
f* = 0.55 - (1 - 0.55) / 1.5
f* = 0.55 - 0.30
f* = 0.25 (25% of capital per trade)
This means the Kelly Criterion suggests risking 25% of capital per trade — which translates to a maximum effective leverage of about 4x if using a 5% stop loss.
But Kelly assumes perfect knowledge of your edge. In reality, crypto markets have regime changes, correlation shifts, and fat tails that break assumptions. That's why professionals use Half-Kelly or Quarter-Kelly:
Approach
Capital at risk
Effective leverage (5% stop)
Drawdown tolerance
Full Kelly
25%
~5x
Extreme drawdowns possible
Half Kelly
12.5%
~2.5x
Moderate, recoverable
Quarter Kelly
6.25%
~1.25x
Conservative, stable
Half-Kelly (2-3x leverage) consistently produces the best risk-adjusted returns in backtests across crypto markets from 2020-2026. Full Kelly generates higher total returns but with drawdowns exceeding 50% — psychologically impossible for most traders to sustain.
⚠️ Limitation: The Kelly Criterion requires accurate estimates of your win rate and reward-to-risk ratio. If you overestimate your edge by even 10%, the formula will suggest dangerously oversized positions. Track at least 100 trades before relying on Kelly-based sizing. The formula also assumes independent bets — correlated crypto positions (e.g., BTC and ETH longs simultaneously) require adjustment.
How to Use Chart Pro for Position Sizing on CoinXSight
Open the Chart Pro module from the main navigation
Select your trading pair (BTC/USDT, ETH/USDT, etc.)
Click the Position Calculator tool in the chart toolbar
Enter your entry price, stop loss level, and account balance
The calculator returns: recommended position size, effective leverage, liquidation price, and risk/reward ratio
Cross-reference with the Confluence Score — if it's below 6/10, the module suggests reducing leverage or passing on the trade
Use the volatility overlay (ATR-based) to verify that your stop loss sits outside the current noise range
💡 CoinXSight's Chart Pro position calculator automatically factors in exchange fees and estimated funding rates when computing break-even prices. This removes the manual calculation step that trips up most beginners on any crypto trading platform.
The platform connects position sizing directly to technical analysis: your stop loss isn't arbitrary — it's anchored to support and resistance levels and market structure identified by the chart tools. This is the difference between gambling with leverage and using it as a precision instrument.
FAQ
What happens when you get liquidated in crypto futures trading?
Your entire margin deposit for that position is lost. The exchange's liquidation engine forcibly closes your trade at the liquidation price, and you receive $0 back. On isolated margin, only that position's margin is lost. On cross margin, your entire account balance may be consumed.
What is the safest leverage for crypto trading?
2-3x leverage is considered the safest range for most traders. At 2x, you can survive a 50% price drop before liquidation. This gives enough margin buffer to handle BTC's typical 5-15% weekly swings while still amplifying returns on high-conviction setups.
How does CoinXSight calculate optimal leverage for a trade?
CoinXSight's Chart Pro module uses your entry price, stop loss, and account balance to compute position size and effective leverage automatically. It factors in real-time volatility (ATR), exchange fees, and funding rates, then flags trades where leverage exceeds safe thresholds relative to market conditions.
Is 100x leverage ever profitable in crypto?
Statistically, no. While individual 100x trades can win, the math guarantees long-term losses. A 1% adverse move causes full liquidation, and BTC's average intraday range is 2-4%. Even with a 60% win rate, funding costs and fees at 100x erode profits faster than wins accumulate.
What is the Kelly Criterion and how does it apply to crypto leverage?
The Kelly Criterion is a mathematical formula (f* = W – (1-W)/R) that calculates optimal position size based on your win rate and reward-to-risk ratio. Applied to crypto, it typically recommends 2-5x effective leverage. Most professionals use Half-Kelly (halving the suggested size) for extra safety.
Disclaimer: This article is for educational and informational purposes only and does not constitute financial, investment, or trading advice. Cryptocurrency markets are highly volatile and involve substantial risk of loss. Leveraged trading can result in losses exceeding your initial deposit. This content is not suitable for all investors. No trading strategy guarantees profits. Paper-trade or demo-trade before risking real capital. Always conduct your own research (DYOR) and consult a licensed financial advisor before making any investment decisions. Past performance does not guarantee future results. CoinXSight provides analytical tools and data — not investment recommendations.
Master risk management for crypto trading. Learn position sizing formulas, stop-loss strategies, and how CoinXSight's Portfolio module tracks your risk…
Master funding rate analysis, open interest tracking, and liquidation cascade prediction for crypto trading. Learn to read leveraged positioning, detect…