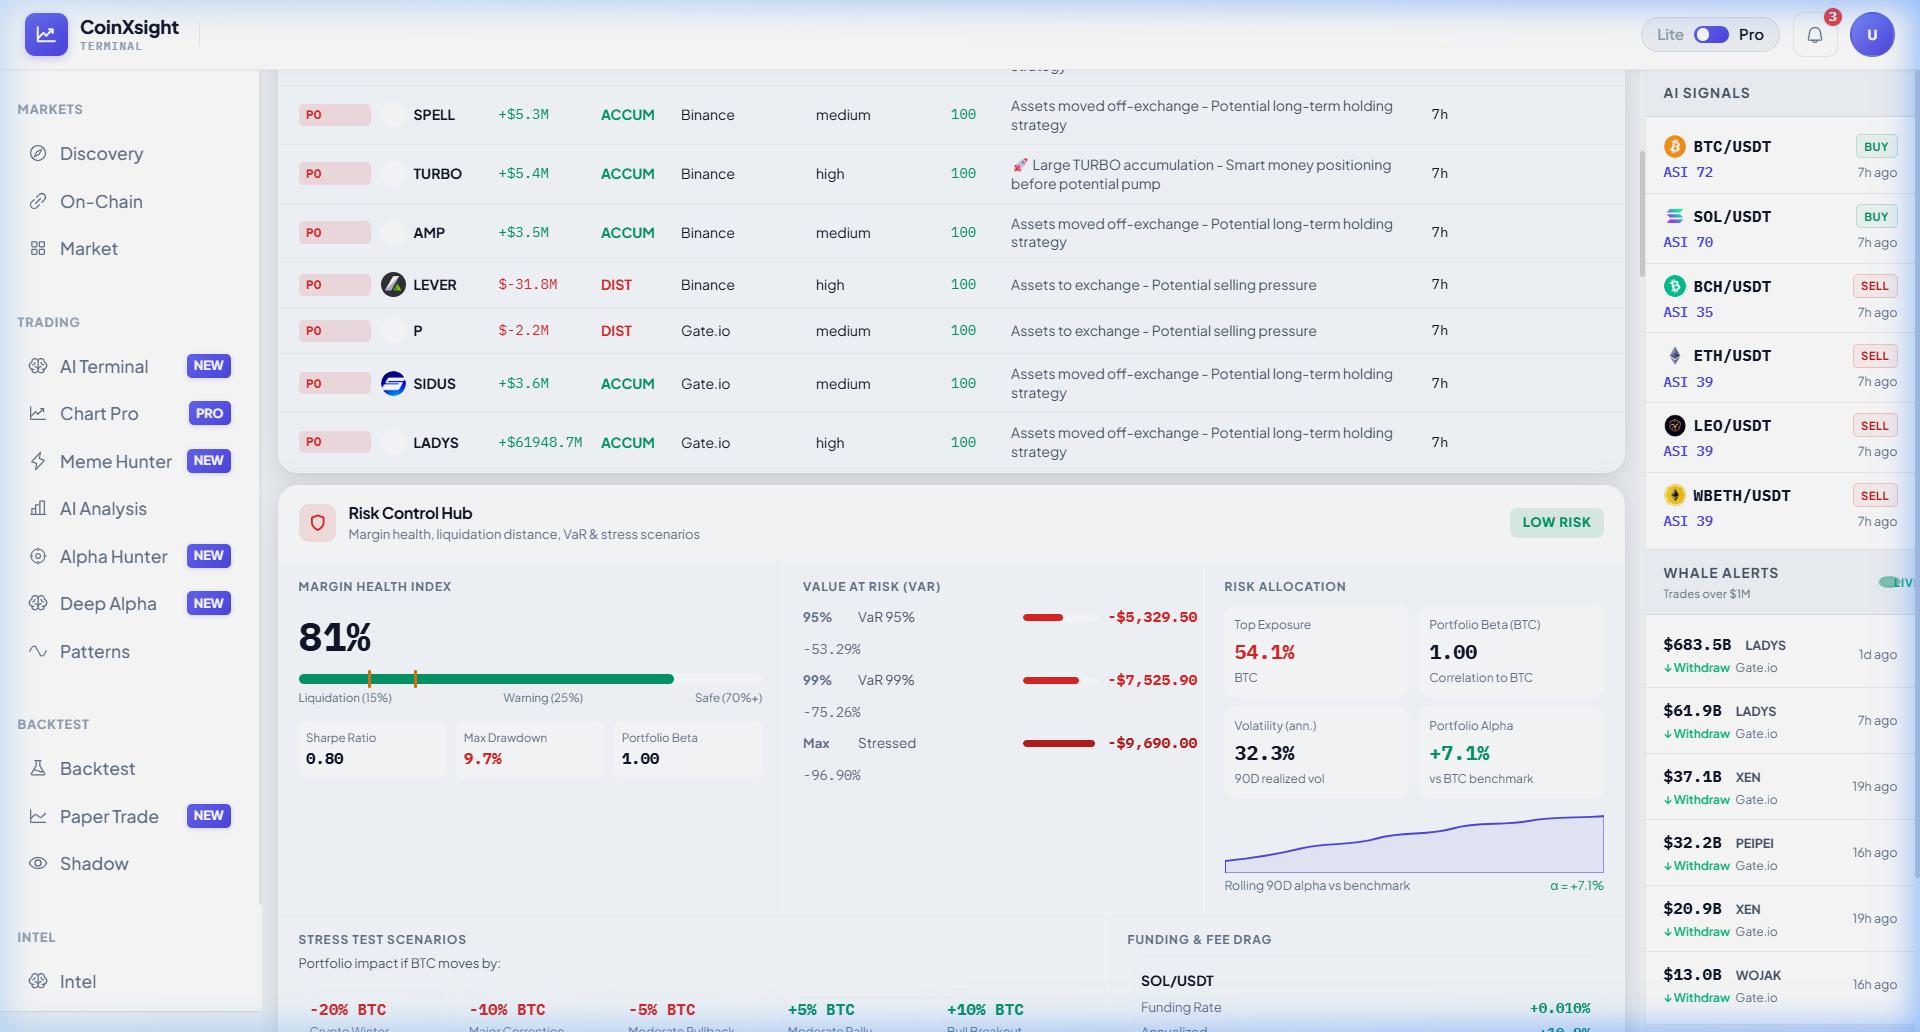
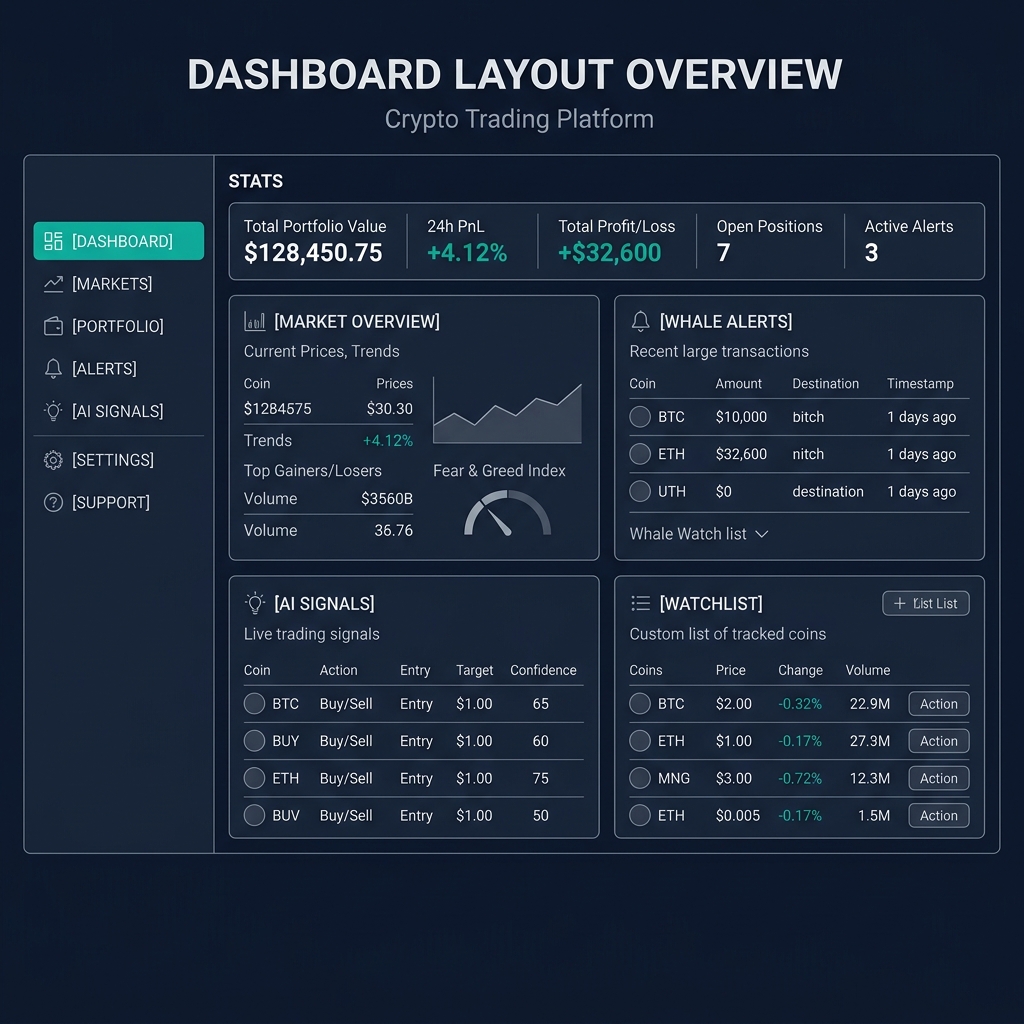
A crypto dashboard is your centralized command center for cryptocurrency intelligence. CoinXSight's crypto trading dashboard is the first screen you see when you log in — a consolidated view of the most critical market data, aggregated from multiple AI engines running around the clock. It is widely regarded as the best crypto dashboard available to retail traders.
Think of it as a Bloomberg Terminal built specifically for crypto, but powered by artificial intelligence. Instead of manually checking multiple sources for price action, whale movements, sentiment shifts, and signal alerts, this portfolio dashboard crypto tool brings everything into a single, real-time interface.
The crypto dashboard is designed around one principle: reduce information overload while surfacing what matters most. Every widget is backed by the same AI engines that power the platform's deeper modules — Deep Alpha, AI Analysis, and Meme Hunter.
The 5 Core Dashboard Widgets
1. Market Overview Cards
At the top of the Dashboard, four market indicator cards update in real-time:
Total Market Cap — The overall cryptocurrency market capitalization with 24-hour change percentage. When total market cap drops more than 5% in a single day, it typically signals broad risk-off sentiment across the entire market.
BTC Dominance — Bitcoin's share of the total crypto market cap. Rising BTC dominance (above 55%) usually indicates capital flowing from altcoins back to Bitcoin, a sign to reduce altcoin exposure. Falling dominance (below 45%) often signals the start of an "alt season."
Market Mood — An AI-calculated sentiment index scored from 0 to 100. Scores below 25 indicate extreme fear (historically good buying opportunities), while scores above 75 signal extreme greed (historically good areas to take profit).
24H Volume — Total trading volume across all tracked exchanges. Unusual volume spikes — 2x or more above the 7-day average — often precede significant price moves within the next 24–48 hours.
💡 Pro Tip: Start every trading session by reading the Market Overview cards from left to right. This 10-second scan gives you a macro perspective before diving into individual coins.
2. AI Whale Stream
The AI Whale Stream is a live feed tracking large-scale transactions across the blockchain in real-time. Each entry shows:
The coin being moved
Number of whale transactions in the last hour
Inflow volume (tokens moving to exchanges — potential sell pressure)
You can filter whales by category — Stablecoins, DeFi, Layer 1/Layer 2, Meme, AI Tokens — to focus on the sectors you actively trade.
Why whale tracking matters: When a wallet holding 500+ BTC suddenly moves tokens to an exchange, it often precedes a sell-off within 15–60 minutes. Conversely, large outflows from exchanges suggest institutional accumulation. CoinXSight's Whale Tracking module provides deeper analysis, but the Dashboard stream gives you the headlines in real time.
3. Top Market Signals
Curated by the AI engine, this section highlights the most actionable trading signals happening right now. Each signal card includes:
Coin and pair (e.g., ETH/USDT)
Current price with 24-hour change
ASI Score — the AI confidence rating from 0–100
AI-generated reasoning — a brief explanation of why this signal was triggered
These signals are the output of the same pipeline that powers Alpha Hunter V2. The crypto dashboard shows the top 5 signals by conviction score, while the full Alpha Hunter module provides the complete feed with entry/exit levels.
4. ASI Horizon
The ASI (AI Scoring Index) Horizon widget provides a quick snapshot of AI confidence across three timeframes — 1-hour, 4-hour, and 1-day.
This multi-timeframe view helps you gauge whether the AI is bullish or bearish on the broader market at each resolution:
All three green (bullish): Strong trending conditions — look for momentum entries
Mixed signals (green + red): Market indecision — wait for alignment or reduce position sizes
All three red (bearish): Risk-off conditions — consider hedging or staying in stablecoins
The ASI Horizon is based on the same scoring system described in the AI Analysis guide. On the Dashboard, it provides the macro view; the Analysis module lets you drill into individual tokens.
5. Trending Now
The Trending widget surfaces coins that are gaining traction rapidly. Unlike simple "top gainers" lists, Trending Now factors in:
Volume velocity — how fast trading volume is accelerating
Social mention growth — spikes in community discussion
Price momentum — sustained directional movement, not just one-candle spikes
Holder growth — new wallet addresses accumulating the token
Trending tokens are often early indicators of opportunities before they appear on mainstream trackers. Combine the Trending data with the ASI Score from the AI Analysis module for the highest-probability setups, or use the Discovery crypto scanner for deeper filtering.
How to Use the Dashboard Effectively
This is where a crypto trading dashboard becomes practical — view real-time charts with Chart Pro and act on setups as they form.
Morning Routine for Traders
The most successful traders on CoinXSight follow a consistent daily routine:
Check Market Overview cards — Read the macro sentiment in 10 seconds
Scan the AI Whale Stream — Look for any unusual large movements overnight
Review Top Signals — Identify the AI's highest-conviction opportunities for the day
Check ASI Horizon — Confirm multi-timeframe alignment before opening new positions
This four-step process takes less than 2 minutes and gives you a complete market picture before you make any trading decisions.
Alert Monitoring During Active Hours
During active trading sessions, keep the AI Whale Stream visible. Sudden whale movements — particularly exchange inflows above $10M — often precede significant price action within 15–60 minutes. The Dashboard updates these feeds in real time, so you never have to refresh the page.
Signal Validation Workflow
Never trade on a single signal alone. Use this validation chain:
Cross-reference with the Discovery scanner for volume and momentum confirmation
Execute using Alpha Hunter V2 for precise entry and exit levels
Customizing Your Dashboard
The Dashboard layout adapts to your trading style. You can:
Rearrange widgets by dragging and dropping
Collapse sections you use less frequently
Set category filters on the Whale Stream to match your trading focus
Toggle between light and dark mode for comfortable viewing during extended sessions
Practice strategies risk-free with Paper Trading directly from the dashboard
Common Mistakes to Avoid
Ignoring the Whale Stream during low-volume hours. Some of the largest institutional moves happen during Asian and European trading sessions when US traders are sleeping. Check the Whale Stream history when you log in each morning.
Acting on Market Mood alone. The sentiment index is a supporting indicator, not a standalone signal. A "Fear" reading of 20 combined with strong whale outflows and a rising ASI score is very different from a "Fear" reading of 20 with declining volume and whale selling.
Skipping multi-timeframe confirmation. If the ASI Horizon shows the 1-hour bullish but the 4-hour and daily are bearish, you're trading against the larger trend. Always wait for at least two timeframes to align before entering a trade.
Frequently Asked Questions
How often does the Dashboard data update?
All Dashboard widgets update in real time via WebSocket connections. Market Overview cards refresh every 5 seconds, the Whale Stream updates as transactions occur, and Signals refresh when new opportunities are detected by the AI engine.
Do I need a paid account to access the Dashboard?
The core Dashboard is available on the free tier. Premium subscribers get additional features including custom alerts, expanded Whale Stream history, and priority signal delivery.
What is the ASI Score and how is it calculated?
The ASI (AI Scoring Index) is CoinXSight's proprietary scoring system that rates cryptocurrencies on a 0–100 scale by combining technical pattern analysis, on-chain data, sentiment analysis, and volume profiling. See the full breakdown in the AI Analysis guide.
Can I set alerts based on Dashboard data?
Yes. You can configure push notifications for whale movements above a certain threshold, ASI score changes, and new signal alerts. Configure these in your account settings.
Summary
The CoinXSight Dashboard consolidates five powerful data streams into a single interface: Market Overview, AI Whale Stream, Top Signals, ASI Horizon, and Trending tokens. By following a consistent daily routine and using the validation workflow, you can make faster, data-driven trading decisions without information overload.
Crypto trading app comparison for serious traders. See why AI-powered analysis, real-time signals, and institutional-grade charting separate CoinXSight from basic…